AXS is moving out from inverted H&SAXS is forming inverted Head and Should at bottom. A upside breakout is expected in a few weeks ahead. RR is great for a try
AXSUSDT trade ideas

AXS is getting ready to moveGaming narrative and the broader BTC move are setting up strong projects like Axie Infinity ecosystem, for a nice upside move.
Any dips below $7 I'm accumulating. Similar to the SOL/ETH pair early head up I gave all of you. AXS has the same set up. If you followed me, you had caught the SOL move from the 12-19 dollar range.
This is a 3 day chart and AXS has multi time frame squeezes firing to the long side. So this will take a few weeks and months to play out. My first profit target is at $16 and the second target is at $40. This is not a financial advice. This is what I'm doing.

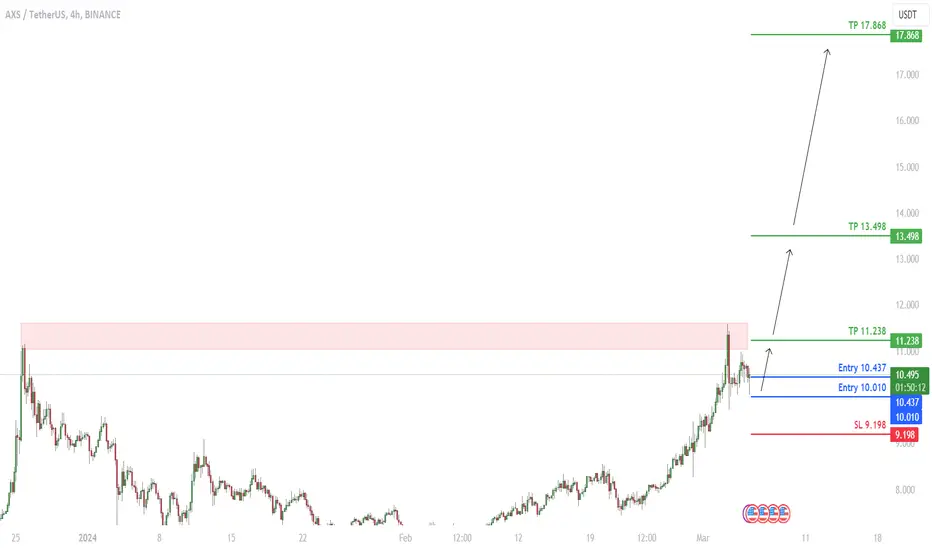
AXS after the pullback will continue to go upAXS after the pullback will continue to go up
🔵Entry Zone 10.010 - 10.437
🔴SL 9.198
🟢TP1 11.238
🟢TP2 13.498
🟢TP3 17.868
Risk Warning
Trading Forex, CFDs, Crypto, Futures, and Stocks involve a risk of loss. Please consider carefully if such trading is appropriate for you. Past performance is not indicative of future results.
If you liked our ideas, please support us with your likes 👍 and comments.
AXIE: Fundamentally and Technically Set For The Gaming RunAxie is probably one of the most known Web3 gaming projects rn with massive active user base. It became known during the last bullrun after creating many fresh new millionaires. Since then they have developed their game even further and treated their community with all kinds of official merch and Axie related toys. Fundamentally, Axie is as solid as WEB3 gaming project can be.
On the technical perspective everything seems pretty clear. My favourite long term indicator, the weekly RSI, is setting up for a multi year bullrun, as seen with many other coins. It also formed pretty clear bottom with touching the 4 dollar region in two different occasions.
Easy long term choice for me since I'm extremely bullish on the gaming coins for the upcoming gaming run.
I do hold spot position for AXIE as a longer term investment.
nfa

AXS / AXSUSDTGood Luck >>
• Warning •
Any deal I share does not mean that I am forcing you to enter into it, you enter in with your full risk, because I'll not gain any profits with you in the end.
The risk management of the position must comply with the stop loss.
(I am not sharing financial or investment advice, you should do your own research for your money.)

AXS trade entry setupWeekly: long term analysis
AXS was one of the top gainers of the last altcoin bull run. After more than 95% deep correction during the bear market, AXS is building a reversal Head&Shoulder on a weekly support zone around the 4$ price.
Daily: short term analysis
The inverted H&S pattern is attempting a breakout upward.
If this breakout is confirmed, prices can start a strong upward move based on previous price action of AXS. The latest higher low contracted the price’s volatility and is offering us a good risk/reward setup.
Strategy
Buy signal will be given from a weekly close above the resistance line (neckline of the inverted H&S) around the 10$ mark.
Objective 1: Next resistance line (before the H&S swing move target) at 20$ ( +100%)
Objective 2: Next resistance around the 45$ zone (+350%)
Objective 3: Weekly ATH around 154$ (+1400%)
Invalidation
Mental Stop: just below the recent weekly swing low. This setup proposes a nice Risk Reward
If prices retrace to this stop level we will wait for the weekly closing price then set a Stop loss ¼ or Risk below the weekly close price.
Risk = Distance between Mental stop and entry point.

Solana fractal on AXS. Will it repeat?Just having an experiment since chart looking pretty similar. Crazy thoughts tho, if AXS able to replicate Solana move, it might hit $15 the next few weeks. Probably 30-40$ in a few months. Just my crazy thoughts. #nfa #dyor

AXSUSDTThe signal was much earlier. As a result of the signal, the price rose by 44% and then corrected. But the targets remained, all targets based on Fibonacci levels. Long-term signal, purchases only on SPOT

AXE/USDTHello guys
Considering the completion of the correction of AXS, if the price does not go below the blue range, there are two possible targets:
Tp1 : 19
Tp2: 28
If you have any questions, you can write it in comments below, and I will answer them.
And please don't forget to support this idea with your like and comment.
always make your analysis before a trade
it is not offer to trade.
good luck

AXS IS A KINGAXS correction diametric has been completed for some time. Now the price should enter a medium-term bullish phase.
By maintaining the green range, Flip can move towards the targets
Closing a daily candle below the invalidation level will violate the analysis.
For risk management, please don't forget stop loss and capital management
When we reach the first target, save some profit and then change the stop to entry
Comment if you have any questions
Thank You

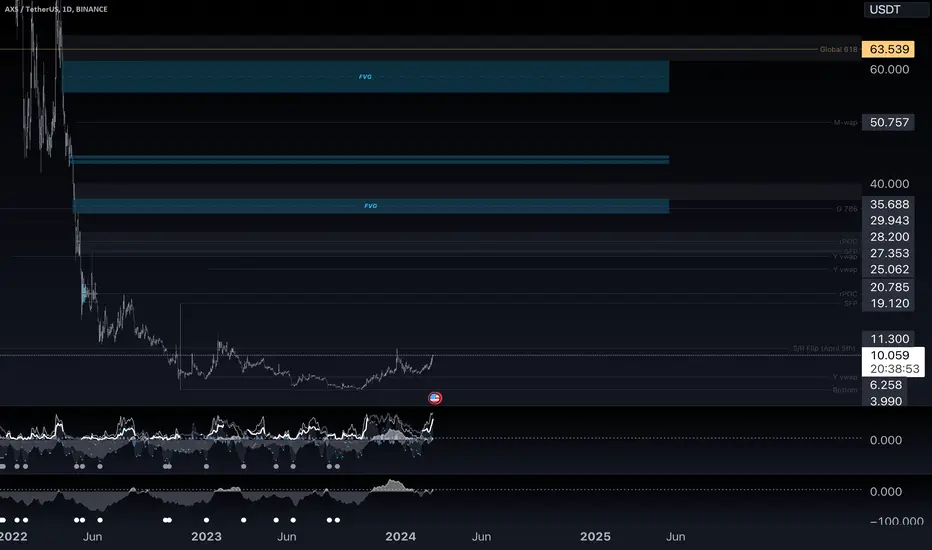
AXS Daily Timeframe Key LevelsLevels on the chart include
-Yearly Vwap snap points
-Monthly Vwap snap points
-Global 618
-Global 786
-Range Points of Control
-Order Blocks
-Fair Value Gaps (Imbalances)
Notice the FVG's close to the orderblocks.
Price gravitates to these levels.
The moneyflow is curving up and increasing.
We have been in the bottom of the bear market.
AXSUSDTmy entry on this trade idea is taken from a point of interest BELOW an inducement.. I extended my stoploss area to cover for the whole swing as price can target the liquidity there before going as i anticipate.. just a trade idea, not financial advise

AXS: Approaching SupportTrade setup : Price is in an Uptrend. Following a bullish breakout from a Descending Triangle pattern, price rallied +20% to $8.50 before pulling back on some profit taking. If it pulls back near $7.00, that could be another attractive swing trade entry in Uptrend. Stop Loss (SL) at $6.70, just below prior swing low.
Trend : Uptrend across all time horizons (Short- Medium- and Long-Term).
Momentum is Bullish but inflecting. MACD Line is above MACD Signal Line and RSI is above 55 but momentum may have peaked since MACD Histogram bars are declining, which suggests that momentum is weakening.
Support and Resistance : Nearest Support Zone is $7.00 (previous resistance), then $6.00. The nearest Resistance Zone is $9.50, then $11.00.

AXSUSDT BUYMade a purchase at the spot. Goals on the chart. I will fix it in parts.
#AXS #AXSBUY #BUY
More ideas me tekegram.

AXS longAXS is bouncing off the support area which is also matching with the Fibonacci 0.382 retracement level. Bullish trend is expected to continue up to 8.55.

AXSUSDTmy entry on this trade idea is taken from a point of interest BELOW an inducement.. I extended my stoploss area to cover for the whole swing as price can target the liquidity there before going as i anticipate.. just a trade idea, not financial advise

AXS: Approaching SupportTrade setup : Price is in an Uptrend. Following a bullish breakout from a Descending Triangle pattern, price rallied +20% to $8.50 before pulling back on some profit taking. If it pulls back near $7.00, that could be another attractive swing trade entry in Uptrend. Stop Loss (SL) at $6.70, just below prior swing low.
Trend : Uptrend across all time horizons (Short- Medium- and Long-Term).
Momentum is Bullish but inflecting. MACD Line is above MACD Signal Line and RSI is above 55 but momentum may have peaked since MACD Histogram bars are declining, which suggests that momentum is weakening.
Support and Resistance : Nearest Support Zone is $7.00 (previous resistance), then $6.00. The nearest Resistance Zone is $9.50, then $11.00.

Breakout - Target:11$1. Supertrend positiv
2. positiv accumulation
3. positiv squeeze
Targets marked with dotted lines in chart

AXS: Descending Triangle BreakoutTrade setup : Trends are mixed. Bullish breakout from a Descending Triangle pattern could see price revisit $8.00 near-term and $9.50 medium-term. Stop Loss (SL) at $6.70, just below prior swing low.
Trend : Uptrend across all time horizons (Short- Medium- and Long-Term).
Momentum is Bullish (MACD Line is above MACD Signal Line and RSI is above 55).
Support and Resistance : Nearest Support Zone is $7.00 (previous resistance), then $6.00. The nearest Resistance Zone is $9.50, then $11.00.


AXS LONGAgain, fill the order in incremental order to get very safe long built in the uncertain BTC zone

AXS Don't Miss Out! Grab the Bull by the Horns and Invest Smart## AXS Coin: Fundamentals, Recent News, and Disclaimer
**Disclaimer:** I am not a financial advisor and this information should not be considered financial advice. Please do your own research before making any investment decisions.
**Fundamentals:**
* **Name:** Axie Infinity (AXS)
* **Type:** ERC-20 token
* **Platform:** Ethereum (with Ronin sidechain)
* **Use case:** Governance token for the Axie Infinity game, used for breeding Axies, staking, and participating in the Axie Infinity DAO.
* **Total supply:** 270 million AXS (capped)
* **Circulating supply:** 137.2 million AXS (as of February 12, 2024)
* **Current price:** $7.69 USD (as of February 12, 2024)
* **Market cap:** $1.05 billion USD (as of February 12, 2024)
**Recent News:**
* **Axie Infinity: Origins launched:** A revamped version of the original Axie Infinity game with improved graphics and gameplay.
* **$150 million funding round:** Sky Mavis, the team behind Axie Infinity, raised $150 million in a funding round led by Andreessen Horowitz (a16z).
* **AXS listed on Coinbase:** AXS was listed on the major cryptocurrency exchange Coinbase in October 2023.
* **Continued growth of Axie Infinity ecosystem:** The number of daily active users on the Axie Infinity platform has continued to grow in recent months.
**Additional Notes:**
* The Axie Infinity game has been criticized for its high entry barrier (requiring the purchase of Axies, which can be expensive), and for its potential links to gambling.
* The crypto market is volatile and the price of AXS could fluctuate significantly in the future.
I hope this information is helpful. Please remember to do your own research before making any investment decisions.

AXS/USDT | 1W 👀I'm buying AXS. The coin has corrected very well, a very attractive price to buy. I'm waiting for the goal according to the plans
Axie Infinity is a platform that allows you to earn tokens and contribute to the ecosystem in a gaming format. Externally, it's a cartoonish game about fantastic creatures, but essentially, it's a social platform and a working network that utilizes NFTs
- Not financial advice, trade with caution.
✅ Stay updated on market news and developments that may influence the price of AxieInfinity. Positive or negative news can significantly impact the cryptocurrency's value.
✅ Exercise patience and discipline when executing your trading plan. Avoid making impulsive decisions driven by emotions, and adhere to your strategy even during periods of market volatility.
✅ Remember that trading always involves risk, and there are no guarantees of profit. Conduct thorough research, analyze market conditions, and be prepared for various scenarios. Trade only with funds you can afford to lose and avoid excessive risk-taking.
#Crypto #AxieInfinity #Investment #AXS
