$BAKEUSDT on it week upside candlestick on it all time low and also on it week upside strong orderblock
BAKEUSDT trade ideas

BAKE ready to restart the uptrendhi traders,
Let's have a look at BAKEUSDT on the monthly time frame.
To be honest, there are not many altcoins that look as good as BAKE on the monthly.
Multiple months of the reaccumulation.
Support holds strong.
I can't see it to fail.
First target: 0,90
Second target: 1,62
BAKE is a low market-cap altcoin so I won't be surprised if the pump is fast and after that we will get a deep pullback again.
Good luck

BAKEUSDT 1W AnalysisBAKE ~ 1W Analysis
#BAKE Buy back gradually from here with a short term target of at least 20%+ from this support.

BAKE - Amazing Signal gave us TOP 13.5% Profits.Just Wow.
Volume + Footprint allowed us to recognize market sentiment and movement change.
1️⃣ 1st Signal: We were waiting for a breakout from the Grey Triangle. Price broke down and retested the lower White Level (lower Edge) of the Triangle and dropped to POC. It was Like Textbook. My POC Level was Sniping 🎯. Insane accuracy 👌🎯😎 .
3.5 % 💰 💵 💲
2️⃣ 2nd Signal: 2 Days Later I updated the Same TA and gave a LONG as Signal.
I wrote: "eyes on Fib and 4h" .
Yellow Circle Marks. 👌🎯😎
Beautiful Reaction on that new 4h-LEvel + Fib 0.38.
AND BOOM💰💵💲 10 %
-- Below the link of both Original TA/Signals:
1st Signal:https://www.tradingview.com/chart/BAKEUSDT.P/QB8ppmBK-BAKE-Some-POIs/
2nd Signal:https://www.tradingview.com/x/B0j82o6D/
Follow for more ideas/Signals.💲
Just donate some of your profit to Animal rights or other charity :)✌️

BAKE - Some POIsThe Grey triangle could be a nice trade. Eyes on it.
I will be not active for next 1-2 days but here a small TA.
There is not much to say.
a quick overview of BAKE.
Follow for more ideas/Signals. 💲
Look at my other ideas 😉
Just donate some of your profit to Animal rights and rescue or other charity :)✌️

BAKEUSDT 1WBAKE ~ 1W Analysis
#BAKE Buy gradually from here if you still have a Conviction on this coin with a short -term target of at least 20%+.

BAKE - Some POIs that Blue box could be a nice short possibility.
Just wait until it reaches there then new small TA regarding Volume, then probably Short.
Follow for more ideas/Signals. 💲
Look at my other ideas 😉
Just donate some of your profit to Animal rights and rescue or other charity :)✌️

BAKEUSDT 1WBAKE ~ 1W Analysis
#BAKE Buy gradually from here if you still have a Conviction on this coin with a short -term target of at least 20%+.

BAKEUSDT – Red Boxes Are Strong Resistance Zones!The red boxes on BAKEUSDT represent significant resistance zones where we can expect considerable selling pressure. These levels have shown their strength in the past, and it's crucial to approach them with caution.
🔴 Key Insights:
Strong Resistance: The red boxes are key resistance areas with high potential for price rejection. Sellers are likely to be active here, so don’t rush.
Patience is Key: Always wait for lower time frame (LTF) breakouts with CDV and volume profile confirmation before making any decisions.
Avoid Blind Entries: Trading these zones blindly can be risky. Let the market show you its intention, and only trade with confirmation.
💡 Smart Approach:
Wait for a clear signal before making a move. If the market doesn’t break and retest these red zones with volume, there’s no reason to take unnecessary risks. Your entry should always be backed by proper data and analysis. Patience + Smart Entries = Successful Trades.
I keep my charts clean and simple because I believe clarity leads to better decisions.
My approach is built on years of experience and a solid track record. I don’t claim to know it all, but I’m confident in my ability to spot high-probability setups.
If you would like to learn how to use the heatmap, cumulative volume delta and volume footprint techniques that I use below to determine very accurate demand regions, you can send me a private message. I help anyone who wants it completely free of charge.
I have a long list of my proven technique below:
🎯 ZENUSDT.P: Patience & Profitability | %230 Reaction from the Sniper Entry
🐶 DOGEUSDT.P: Next Move
🎨 RENDERUSDT.P: Opportunity of the Month
💎 ETHUSDT.P: Where to Retrace
🟢 BNBUSDT.P: Potential Surge
📊 BTC Dominance: Reaction Zone
🌊 WAVESUSDT.P: Demand Zone Potential
🟣 UNIUSDT.P: Long-Term Trade
🔵 XRPUSDT.P: Entry Zones
🔗 LINKUSDT.P: Follow The River
📈 BTCUSDT.P: Two Key Demand Zones
🟩 POLUSDT: Bullish Momentum
🌟 PENDLEUSDT.P: Where Opportunity Meets Precision
🔥 BTCUSDT.P: Liquidation of Highly Leveraged Longs
🌊 SOLUSDT.P: SOL's Dip - Your Opportunity
🐸 1000PEPEUSDT.P: Prime Bounce Zone Unlocked
🚀 ETHUSDT.P: Set to Explode - Don't Miss This Game Changer
🤖 IQUSDT: Smart Plan
⚡️ PONDUSDT: A Trade Not Taken Is Better Than a Losing One
💼 STMXUSDT: 2 Buying Areas
🐢 TURBOUSDT: Buy Zones and Buyer Presence
🌍 ICPUSDT.P: Massive Upside Potential | Check the Trade Update For Seeing Results
🟠 IDEXUSDT: Spot Buy Area | %26 Profit if You Trade with MSB
📌 USUALUSDT: Buyers Are Active + %70 Profit in Total
🌟 FORTHUSDT: Sniper Entry +%26 Reaction
🐳 QKCUSDT: Sniper Entry +%57 Reaction
📊 BTC.D: Retest of Key Area Highly Likely
I stopped adding to the list because it's kinda tiring to add 5-10 charts in every move but you can check my profile and see that it goes on..
A tiny part of my runners;
🌊 WAVESUSDT.P: Demand Zone Potential
🟣 UNIUSDT.P: Long-Term Trade
🔵 XRPUSDT.P: Entry Zones
🔗 LINKUSDT.P: Follow The River
📈 BTCUSDT.P: Two Key Demand Zones
A tiny part of my runners;
💼 STMXUSDT: 2 Buying Areas
🐢 TURBOUSDT: Buy Zones and Buyer Presence
🌍 ICPUSDT.P: Massive Upside Potential | Check the Trade Update For Seeing Results
🟠 IDEXUSDT: Spot Buy Area | %26 Profit if You Trade with MSB
📌 USUALUSDT: Buyers Are Active + %70 Profit in Total
🌟 FORTHUSDT: Sniper Entry +%26 Reaction
🐳 QKCUSDT: Sniper Entry +%57 Reaction
j
📌I keep my charts clean and simple because I believe clarity leads to better decisions.
📌My approach is built on years of experience and a solid track record. I don’t claim to know it all but I’m confident in my ability to spot high-probability setups.
📌If you would like to learn how to use the heatmap, cumulative volume delta and volume footprint techniques that I use below to determine very accurate demand regions, you can send me a private message. I help anyone who wants it completely free of charge.
🔑I have a long list of my proven technique below:
🎯 ZENUSDT.P: Patience & Profitability | %230 Reaction from the Sniper Entry
🐶 DOGEUSDT.P: Next Move
🎨 RENDERUSDT.P: Opportunity of the Month
💎 ETHUSDT.P: Where to Retrace
🟢 BNBUSDT.P: Potential Surge
📊 BTC Dominance: Reaction Zone
🌊 WAVESUSDT.P: Demand Zone Potential
🟣 UNIUSDT.P: Long-Term Trade
🔵 XRPUSDT.P: Entry Zones
🔗 LINKUSDT.P: Follow The River
📈 BTCUSDT.P: Two Key Demand Zones
🟩 POLUSDT: Bullish Momentum
🌟 PENDLEUSDT.P: Where Opportunity Meets Precision
🔥 BTCUSDT.P: Liquidation of Highly Leveraged Longs
🌊 SOLUSDT.P: SOL's Dip - Your Opportunity
🐸 1000PEPEUSDT.P: Prime Bounce Zone Unlocked
🚀 ETHUSDT.P: Set to Explode - Don't Miss This Game Changer
🤖 IQUSDT: Smart Plan
⚡️ PONDUSDT: A Trade Not Taken Is Better Than a Losing One
💼 STMXUSDT: 2 Buying Areas
🐢 TURBOUSDT: Buy Zones and Buyer Presence
🌍 ICPUSDT.P: Massive Upside Potential | Check the Trade Update For Seeing Results
🟠 IDEXUSDT: Spot Buy Area | %26 Profit if You Trade with MSB
📌 USUALUSDT: Buyers Are Active + %70 Profit in Total
🌟 FORTHUSDT: Sniper Entry +%26 Reaction
🐳 QKCUSDT: Sniper Entry +%57 Reaction
📊 BTC.D: Retest of Key Area Highly Likely
📊 XNOUSDT %80 Reaction with a Simple Blue Box!
📊 BELUSDT Amazing %120 Reaction!
I stopped adding to the list because it's kinda tiring to add 5-10 charts in every move but you can check my profile and see that it goes on..

Bakeusdt Buy Opportunity Entered DCA leverage long from here cause i see a good buy opportunity from here though its very risky.
RR is good if this holds and Bounce.
Expecting a strong and fast bounce if holds.
entered under 0.1400
will scale out if holds under 0.1385
Targeting 0.1700
Note: Not a Financial Advice

BAKEUSDT 1WBAKE ~ 1W Analysis
#BAKE This is the lowest support for now.
Buy from here if you still have a Conviction on this coin with a short -term target of at least 20%+.

BAKE - What a Beautiful Nice Short -The levels were given some days ago. 😎
Even trump news didn't change our levels.
What a strong Reject from marked yellow levels. 👌 🎯
👌🎯 20 % .
previous TA was given here :
Follow for more ideas/Signals. 💲
Look at my other ideas ;)
Just donate some of your profit to Animal rights and rescue or other charity :)✌️

BAKE some interesting POIsif 0.155 breaks then short the scht out it (only at retest) (if you could get a retest 🤣 )
BAKE is jumpy. maybe we see the upper (yellow ~ 0.21 ish) level too
BAKE is a little bit risky to trade. Like XRP and CAKE, dont use leverages over 2X.
Try to trade Spot or low lvrg.
Follow for more ideas/Signals. 💲
Just donate some of your profit to Animal rights and rescue or other charity :)✌️

BAKE update#BAKE went down to a demand zone i think this zone can make the price rise to the supply zone this can make over 50% profit

BAKE TA was given several days ago and nowBAKE TA was given several days ago and now.
There are some important levels marked (yellow)
there will be dynamic TA at those levels, as soon as we reached them.
one level reached since i had given it days ago. Now we look at new levels.
Follow for more ideas/Signals. 💲
Just donate some of your profit to Animal rights and rescue or other charity :)✌️

BAKE udpdate#BAKE is going down which can reach the demand zone
this demand zone has a lot of liq which can force the market to rise
the whole market is bullish

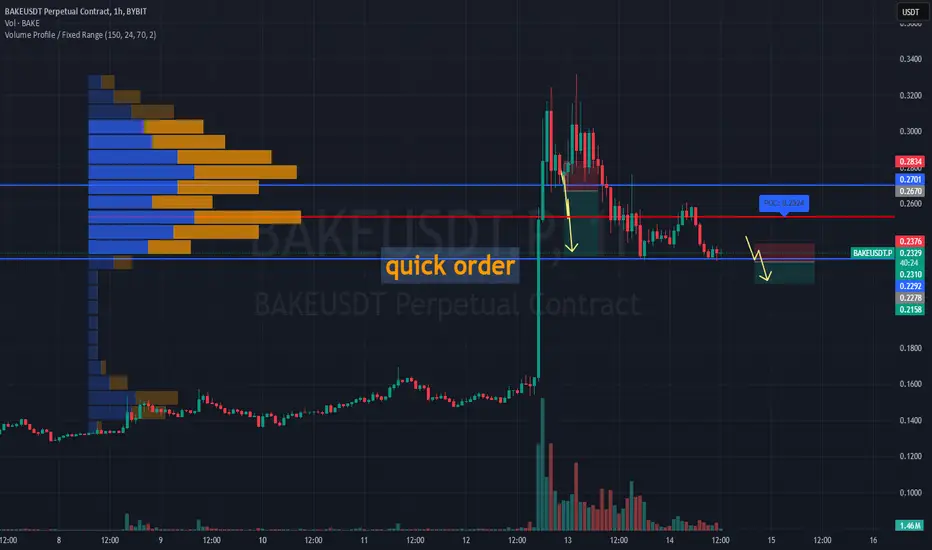
#BAKEUSDT – Quick Trade: Fast Short Opportunity!BYBIT:BAKEUSDT.P is showing weakness after breaking below the $0.2310 zone and consolidating lower. Sellers are in control, price remains below POC $0.2524, and volume confirms bearish pressure.
👉 Key Takeaways:
⚡️ This is a fast trade – no waiting!
The goal is to set the order, take profit, and exit quickly.
⚡️ Fast entry – confirmed breakdown below $0.2278.
⚡️ Tight stop-loss – set at $0.2376 to minimize risk.
⚡️ Quick target – $0.2158, where a bounce may occur.
📉 SHORT BYBIT:BAKEUSDT.P from $0.2278
🛡 Stop Loss: $0.2376
⏱️ 1H Timeframe (Quick Trade!)
✅ Overview:
➡️ BYBIT:BAKEUSDT.P is trading below $0.2310, confirming buyer weakness.
➡️ Downward momentum remains strong, next support is at $0.2158.
➡️ This trade is designed for fast execution and exit at the target level.
⚡️ Plan:
➡️ Act fast – enter and exit without hesitation.
➡️ If price slows down before $0.2158, exit early.
➡️ Don’t chase the price – wait for a clean setup.
📍 Take Profit:
🎯 TP1: $0.2158 – exit zone.
📌 Don't chase – wait for clear execution!
📌 Strategy: Momentum + Quick Profit Target.
🚀 BYBIT:BAKEUSDT.P Breaking Support – Fast Short Opportunity!
BAKEUSDT(BakeryToken) Updated till 12-02-25BAKEUSDT(BakeryToken) Daily timeframe range. we can see a really smooth push from its local low. trying to get through 0.2873 if we can get a confirm close, next 0.4076 needs to be look into. recent support at 0.2072.

BAKE last drop !#BAKE has an ABC pattern which has an ABCDE in the middle so a drop is coming but after that market can make a huge rise also there is an W pattern which tells us this drop is the last one

BAKE update#BAKE made a W harmonic pattern the market made an ABC pattern the C wave is exacly on the fibo demand level which is 0.79 % check out this analysis i made before

BAKE IS EXPLODING !i made an analysis on the coin #BAKE which has a W harmonic pattern and this pattern forced the market to drop to fibo extension levels most important level is 0.62 so it was a perfect place to set our buy positions check this out

#BAKEUSDT shows correction signals📉 SHORT BYBIT:BAKEUSDT.P from $0.2670
🛡 Stop Loss: $0.2834
⏱ 15M Timeframe
✅ Overview:
➡️ BYBIT:BAKEUSDT.P experienced a sharp upward spike, reaching $0.2834, but was followed by a strong decline, indicating profit-taking from major players.
➡️ POC (Point of Control) at $0.2837 shows a high-liquidity area where most trading volume occurred, suggesting a possible resistance zone.
➡️ The $0.2670 level currently acts as short-term support, but a confirmed breakdown could trigger further downside.
➡️ The chart structure signals a potential correction after this steep rally, making short positions at these levels attractive.
⚡ Plan:
➡️ Enter short after confirming a breakdown below $0.2670.
➡️ Risk management through Stop-Loss at $0.2834, placed above the liquidity zone.
Targets:
💎 TP 1: $0.2585
🔥 TP 2: $0.2452
⚡ TP 3: $0.2310
🚀 BYBIT:BAKEUSDT.P shows correction signals — expecting further downside!
📢 BYBIT:BAKEUSDT.P saw a vertical spike, but the lack of strong buying interest at higher levels suggests potential profit-taking.
📢 If $0.2670 breaks downward, we could see continued selling pressure towards $0.2310.
📢 However, a breakout above $0.2834 could change the scenario, so risk management is crucial.

BAKEUSDT 1WBAKE ~ 1W
#BAKE If you still have Conviction on this coin,. This is a very good support block to start buying again., Target at least 20%+
