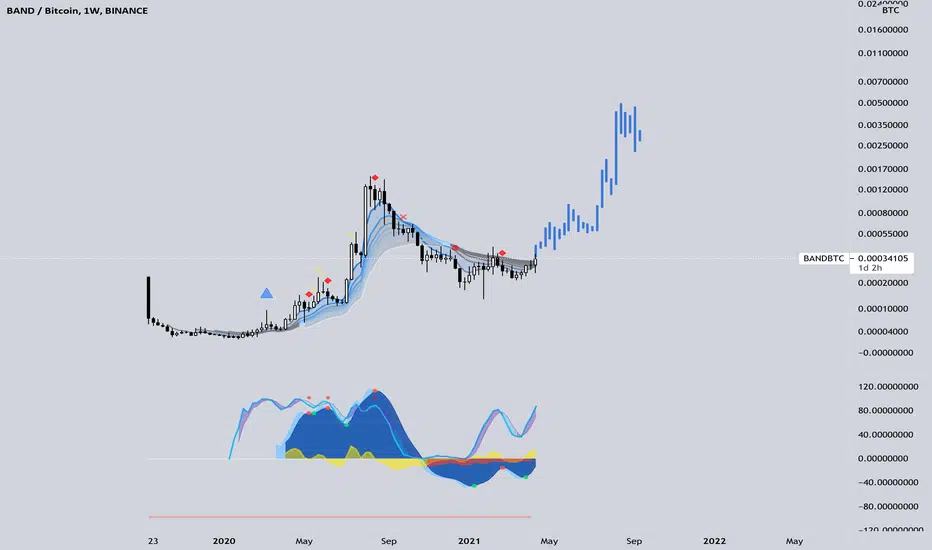
BANDBTCIt may go for MA360 one more time, not sure if it can break
Not financial advice, do your research
BANDBTC trade ideas

BANDBTClong setup
it seems we have high chance to superpass through 32100 s@ weekly resistance
for this purpose Band needs more 1.2 M volume
band have good chance for long term holding i am waiting for break weekly resistance


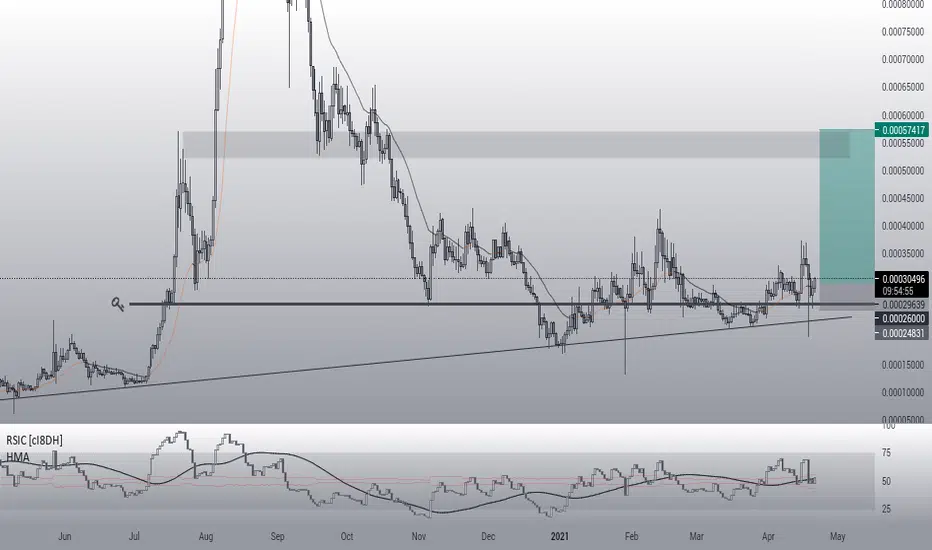
BAND/BTC - BULLISH ACCUMULATION Hey guys!
Altcoin season is in full swing and currently we see patterns braking out everywhere, especially in the large and mid cap alts. As the altcoin season continues and money moves from BTC --> Large Caps --> Mid Caps --> Low Caps --> BTC, you want to start taking looks into low caps that are about to form promising patterns. BAND is one of them.
Pro:
Looking at the macro trend, we can see that BAND/BTC is currently sitting in a nice reload zone around the 0,786 Fib.
It's forming higher lows for 5 months now and shows a clear resistance around 41.000 Sats, which forms an ascending triangle pattern.
Contra
This can also be viewed as a bearish pennant with more downside potential. But since its alt season and the money flow will reach the low caps soon, I lean more towards the bullish side.
The wicks concern me a little. That makes it hard to set proper Stop-Losses.
Entry Points
One option is to wait until price action hits the resistance line again at 41.000 Sats. This gives the pattern more validation and you can wait for an entry around the retracement at number 2. Here I would set a buy order at around 31.500 - 30.000 sats which equals the price level between the the 0.50 and 0.618 Fib.
Another option is to wait until the brake out and retest of the resitance line around 41.000 Sats.
Exit Points
In the bullish case I would look for profit taking around 100.000 sats which is around the 0.618 Fib measured from point A-B. Depending on your entry point this can be a 150% - 240% move to the upside, with a minimum risk reward ratio of 3:1.
In a bearish case I would see if it brakes the upwards sloping support line. My last exit point would be around 20.000 which would establish a new lower low and invalidates the pattern.
Enjoy!

BANDBTC 2D, Big iH&S, E2E tradebig iH$S on the 2D, with a thicc boi kumo. Edge-to-Edge trade looks like the play. 2x trade target.

Band Protocol one of stacking coin for 2021Band Protocol is a cross-chain data oracle platform that is able to take real-world data and supply it to on-chain applications, while also connecting APIs to smart-contracts to facilitate the exchange of information between on-chain and off-chain data sources.
Rank #98
Token
On 62,158 watchlists
Band Protocol Price (BAND)
$11.15
12.30%
0.0003322 BTC
0.008469 ETH


BAND - long termOpportunity on BAND BTC
Reasons,
Consolidating above key level (POC support),
strong trendline,
Holding above Ema 21/50
Entry zone - 30390/27550
Invalidation point if a daily candle fully close below key level / trendline


$BAND will enable you to delete your LinkedIn this year.Chart says it all, everything lining up perfectly.
BANDBTC - The next one to move! Not financial advice but someone sharing his trading diary! - Make your own plans and you will do fine in the long run.
First Link, and now is Band 's turn. That break of .5 speedfan makes me bullish.
Altough BANDBTC is getting rejected from some important levels of confluence, it still shows strength. In case it generously offers us with a dip between 316 -265, it would be a good buy. I am waiting for a trend reversal., or maybe a range formation or a dump => all three scenarios planned and drilled.
I am setting the alarm, are you ?
#band #altcoin #bandbtc #tradingidea

BANDTook it 3 days for re-test of ~25000 support and bounce. Now breaking out ~31500 resistance. Nearest target ~34500. Next will be ~38000. From lowest wick 36-50% profit incoming.

$BAND* This is an awesome long term hodl project.
* Just announced google cloud integration partnership today.
* We have a weekly R/S flip around 29400 sats.
* Bullish MACD cross.
* Double bottom.
* Bullish StochRSI cross on daily.

Band Protocol ($BAND)BANDUSDT formed a triangle with horizontal resistance, which we will break up.
BANDBTC we are at the bottom where there was accumulation, then the upward movement
Best regards EXCAVO


Crypto|BAND/BTC|LongLong BAND/BTC
Activation of the transaction only when the blue zone is fixed/broken.
The author recommends the use of anchoring fixed the blue zone, this variation is less risky.
If there is increased volatility in the market and the price is held for more than 2-3 minutes behind the activation zone after the breakdown, then the activation of the idea occurs at the prices behind the activation zone.
The idea is to work out the resistance level .
* Possible closing of a trade before reaching the take/stop zone. The author can close the deal for subjective reasons, this does not completely cancel the idea and is not a call to the same action, you can continue working out the idea according to your data, but without the support of the author.
+ Maybe right now we will go even lower, then it's okay, the idea is not activated and simply canceled.
+ ! - zone highlighted by the ellipse is a zone of increased resistance, in this area there is a possible reversal for a correction, please take this factor into account in this transaction.
The "forecast" tool is used for more noticeable display of % (for the place of the usual % scale) of the price change, I do not put the date and time of the transaction, only %.
Blue zones - activation zones.
Green zones - take zones.
The red zone - stop zone.
Working out the stop when the price returns to the level after activation + fixing in the red zone.
Orange arrow - the direction of take.
Black arrow - neutral scenario without activating the trade.
The red arrow - the direction of the stop.
SUM PNL: This parameter displays the total % of all closed ideas of the "new" format (according to the author) for this sector at the time of publication of the idea. The calculation is very "clumsy" just the sum of the profits of all the ideas, based on this indicator, you can more accurately assess the risks when working with my ideas of this sector. I present you the construction of the idea, you can use it yourself as you like based on your subjective view and risks, the calculation of the PNL indicator is carried out only on transactions that the author closed on TV in manual mode or by take.
P.S Please use RM (risk management) and MM (money management) if you decide to use my ideas, there will always be unprofitable ideas, this will definitely happen, the goal of the system is that there will be more profitable ideas at a distance.

Band longReverse head and shoulders
Macd weak long signal
Rsi and macd divergences
Good fundamental news


BANDBTCWe are in sub wave 3 of minor wave 1 of major wave 3.
Wave count seems valid but want to see full sub wave 3 for confirmation.
Will see.

