BANDBTC trade ideas

BANDUSD$BAND will outperform LINK and it's gaining more market share. Currently it stands at 3% of $LINK MC.

BANDBTC - Long - Potential 20.31%BANDBTC - Long - Potential 20.31%
Entry- 35938
TP1- 37910
TP2- 43097
SL- 31570
- Trigger - Pullback
- BTC Price & Dominance Stabilising
- RR - 1.7
- Trailing Buy - 1%
- Trailing Profit - 1%
- Trailing Stop-Loss - no

BANDBTC is creating a bullflag 🦐BANDBTC is creating a bullflag below the weekly resistance. IF the price will have a breakout and flip the weekly resistance into new support, According to Plancton's strategy (check our Academy), we can set a nice order
–––––
Follow the Shrimp 🦐
Keep in mind.
🟣 Purple structure -> Monthly structure.
🔴 Red structure -> Weekly structure.
🔵 Blue structure -> Daily structure.
🟡 Yellow structure -> 4h structure.
⚫️ Black structure -> <4h structure.
Here is the Plancton0618 technical analysis, please comment below if you have any question.
The ENTRY in the market will be taken only if the condition of the Plancton0618 strategy will trigger.

Crypto|BAND/BTC|LongLong BAND/BTC
Activation of the transaction only when the blue zone is fixed/broken.
The idea is to work out the resistance level .
* Possible closing of a trade before reaching the take/stop zone. The author can close the deal for subjective reasons, this does not completely cancel the idea and is not a call to the same action, you can continue working out the idea according to your data, but without the support of the author.
+ Maybe right now we will go even lower, then it's okay, the idea is not activated and simply canceled.
+ ! - zone highlighted by the ellipse is a zone of increased resistance, in this area there is a possible reversal for a correction, please take this factor into account in this transaction.
The "forecast" tool is used for more noticeable display of % (for the place of the usual % scale) of the price change, I do not put the date and time of the transaction, only %.
Blue zones - activation zones.
Green zones - take zones.
The red zone - stop zone.
Working out the stop when the price returns to the level after activation + fixing in the red zone.
Orange arrow - the direction of take.
Blue arrow - neutral scenario without activating the trade.
The red arrow - the direction of the stop.
SUM PNL: This parameter displays the total % of all closed ideas of the "new" format (according to the author) for this sector at the time of publication of the idea. The calculation is very "clumsy" just the sum of the profits of all the ideas, based on this indicator, you can more accurately assess the risks when working with my ideas of this sector. I present you the construction of the idea, you can use it yourself as you like based on your subjective view and risks, the calculation of the PNL indicator is carried out only on transactions that the author closed on TV in manual mode or by take.
P.S Please use RM (risk management) and MM (money management) if you decide to use my ideas, there will always be unprofitable ideas, this will definitely happen, the goal of the system is that there will be more profitable ideas at a distance.

$BAND, Crossing over ~32k sats w/ a potential R/S Flip$BAND
Crossing over ~32k sats w/ a potential R/S Flip on the daily...
If manages to keeps pushing up (looks good), then 42k as 1st target on the way up (~25%)
UCTS Buy signal on the daily.. (usually strong)
Let see how it goes 😏
#BAND
BAND/BTC (Harmonic)We see a gartly and prise cross up moving200 1 hour in full frame
Also in the 1-day timeframe based on the USDT currency pair, it is above the Moving 200

BAND roadmapBAND fipped the important horizontal level at 0.00028
I am long as long we stay above on the weekly
I bought the breakout and will add on a retest if we get another one.
My targets are 0.0005 and 0.0009

BANDBTC major Breakout bandbtc broke resistance
Upside targets
55111
70400
minir resitance at 43555
This is Sencrypto0 can find everywhere, T-T-Y

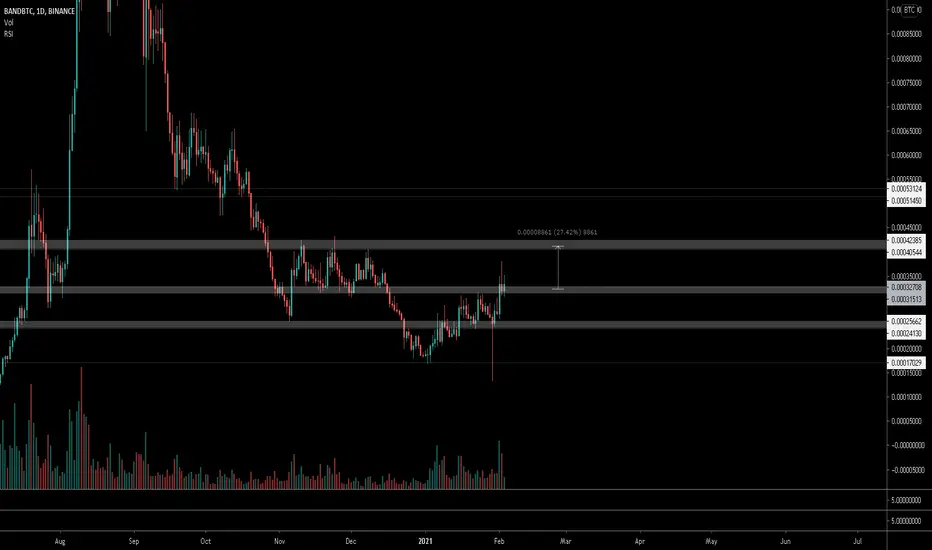
Band resistance and profit taking areasIf resistance at 0.00036 gets broken next areas to watch are (0.00044, 0.00059). I aim to do some profit taking 0.00059 and 0.0009.

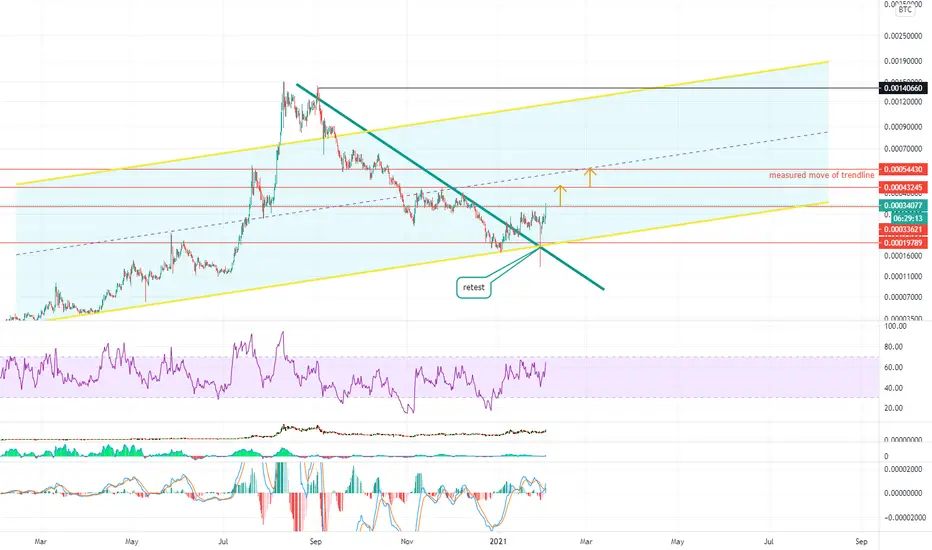
BANDBTC on it's way upVery simple TA, broke out of descending trendline, moving up to the next ranges. Retested the trendline and the channel support with a wicked scam wick which I imagine whipped out a lot of longs.

🔥BAND/BTC🔥 [detailled analysis of special Alt] - CryptoBROBand is sill in accumulation phase (The real trend has not started yet]
i have marked out the most important level from where price should see pivotal reactions.
For now price is consolidaiton below pivotal resistance. daily close (weekly better) above this lvl would confirm a bullish trend imho.
Based on Price Action alone we have a higher low and a higher high as soon this resistance zoned gets flippe dinto support.

BAND/BTC testing median line of channel BAND/BTC looks to have formed a bull flag with a high volume surge followed by a channel formation with decreasing volume. Currently testing the median of this channel, ideally want to see a break upwards of this channel with high volume and continuation.


BANDBTC XABCD formationThere is a XABCD formation in progress, 1-2 days for formation to give fruit.
Trade Setup
Buy : 0.0002975
TP1 : 0,0003268
TP2 : 0.0003489
SL : 0.00027583
Note : BTC is highly volatile be careful
New to chart analysis , control before using the trade setup

BANDBTC - Long - Potential 19.27%BANDBTC - Long - Potential 19.27%
Entry- 30455
TP1- 32203
TP2- 36323
SL- 27583
- Key Notes - High Risk at the moment - Raise S/L at TP1
- RR - 2.08
- Trailing Buy - 0.5%
- Trailing Profit - 1%
- Trailing Stop-Loss - no

BAND on previous Resistance/Support flip levelsBAND/BTC pair bounced on a previous R/S level which was made during its last bull run.
The daily RSI has higher lows and daily MACD is also moving towards bullish side.
Since altcoins are pumping with Ethereum leading the way, the oracle tokens (Link, Band, RLC etc) may also see some upside.
Note:
This is not financial advise. Please do your own research.

BAND/BTC - sleeping giant2017 like altseason should be coming this year and BAND/BTC has beautiful daily chart. After HUGE 5-wavish uptrend cycle, that ends in August 2020, price retrace 90% to the downside and I think we are slowly making next long term BOTTOM.
We have nice bullish divergence on daily RSI, price could easily go little lower.
If you want to buy BAND, you have to withstand potential another -70% drop of the price, on the other hand I am seeing pretty bullish signs on lower timeframes, so as I said the BOTTOM could be already set.

BAND / BTC Bullish DivergeneBAND / BTC is showing Bullish Divergence on 1D chart.
Enter now and remember about stop loss.
Targets: 0.00034131, 0.00045131
SL: 0.00016131

BANDBTC is testing daily resistance 🦐$BAND.X the price is testing daily resistance and descending trendline. IF the price will have a breakout and turn the current resistance into new support, According to Plancton's strategy (check our Academy), we can set a nice order
–––––
Follow the Shrimp 🦐
Keep in mind.
🟣 Purple structure -> Monthly structure.
🔴 Red structure -> Weekly structure.
🔵 Blue structure -> Daily structure.
🟡 Yellow structure -> 4h structure.
⚫️ Black structure -> <4h structure.
Here is the Plancton0618 technical analysis, please comment below if you have any question.
The ENTRY in the market will be taken only if the condition of the Plancton0618 strategy will trigger.


