BANDBTC - UPDATE: Following Papa LINK?I took a look at BANDBT C a little while ago, we had some interesting moves today.
Market in general was pumping, BAND had some good movement.
Let's have quick recap, plus some things I'm seeing.
We're in a downward channel since the highs just before the dump.
We had hit what seemed to be the first solid support in a while. Though no real historic claim to that.
BAND tends to follow LINK. They are both security protocols, I think a lot of people conflate the two.
EMA 100 was bounced back to nicely today.
MACD looking like a healthy cross with some greens sprouting. Ripe for action.
Stoch is building, but not quite at overbought yet.
decreasing sell volume the last few red days.
There's a decent chance she'll swing back down to support, if LINK or BTC decides to drop rapidly for example. But if LINK holds strong above $10 I think we can confidently say BAND will keep moving, maybe after a little correction down.
Closest indicator to it retesting would be the Stoch is getting high.
Invest at your own risk here, I'm just speculating.
TP 's:
#1- 0.00075
#2- 0.0009
SL : Just below prior support. If she breaks it'll be down to the next historic support likely.
--
“Test fast, fail fast, adjust fast.” — Tom Peters
--
I'm a guy that you don't know posting his ideas on the internet for the sake of improving as a human being. If you take this as financial advice, that's on you.
If you like my analysis, then leave a like and feel free to follow for more free content. Feedback, criticism and crude humor are welcome :)
BANDBTC trade ideas

Time to get the BANDBTC back together? BANDBTC feels like the neglected step child of crypto, constantly playing second fiddle to LINK.
After a couple days decline BAND posted it's first strong candle. This coincides with it breaking below it's MA 100.
It's possible we might see a little bump from BAND here. Still risky to say as this support level has no historic data to draw from.
RSI has crossed and looks strong. MACD still questionable, though the daily MACD doesn't seem to be a good indicator of movement historically for BAND.
Overall, I'm predicting further declines, though short term gains could be in order with the current chart. If the market recovers this week and the stocks don't keep going down, this further decline may be invalid.
BUYING IN?
If I'm buying in right now, I'm doing one of two things: 1) looking for a modest 15-30% gain and setting a stop loss tight to the recent low of .0005230. This is a high risk move, if I'm making this, it's with a relatively small amount of capital, 2-5%, with the intention that if it goes south I will make up the losses off the bigger drop later. or 2) looking for a modest 15-30% gain but with a much smaller amount of capital, with the intention that if it goes south I will DCA at a lower price for an eventual bounce.
Realistically, proper balance of risk would be seeing how the market plays out after the weekend. Low volume on the markets right now, so can't really trust the movement until we see more data. If things take off this week, you won't miss THAT much profit by waiting a bit to confirm.
Safe trading :)
I'm a simple guy that you don't know posting his ideas on the internet for the sake of improving as a human being. If you take this as financial advice, that's on you.
Likes, feedback, criticism and crude humor are always welcome :)


wow! BAND and 22% profit is ready ! ;-)you can have short position for band and btc and take a 22% profit for a short position.


Closing in on Entry-Zone BANDBTCBAND has almost hit a 51 % correction form it previous highs, similar to the previous correction.
Seen as a swing-trade opportunity, do not expect to break the major resistance 0.00134xx anytime soon, so take profits in between.

BANDBTC IdeaBand, ready for its next leg up. Expecting this to go touch the upper diagonal before either breaking out or retesting the lower band, which could help form the right shoulder for the inverse head and shoulder.

Band Trading Analisis Hello Traders,
Band is the newest fashion crypto currencie and possibly it will give us very good trading opportunities in the future. However, it seems that is correcting from its last upward movement.
Base on its upward lines and on the Fibonacci levels, we recommend you pay attention to our buy zone levels drafted at out chart for the next buy opportunity.
Please push the like button and follow us.

Bought the Band DipPicked Up a few alts on this little dip.
Will be nice swings if crypto decided to adopt the "Better than V-shaped recover" attitude.


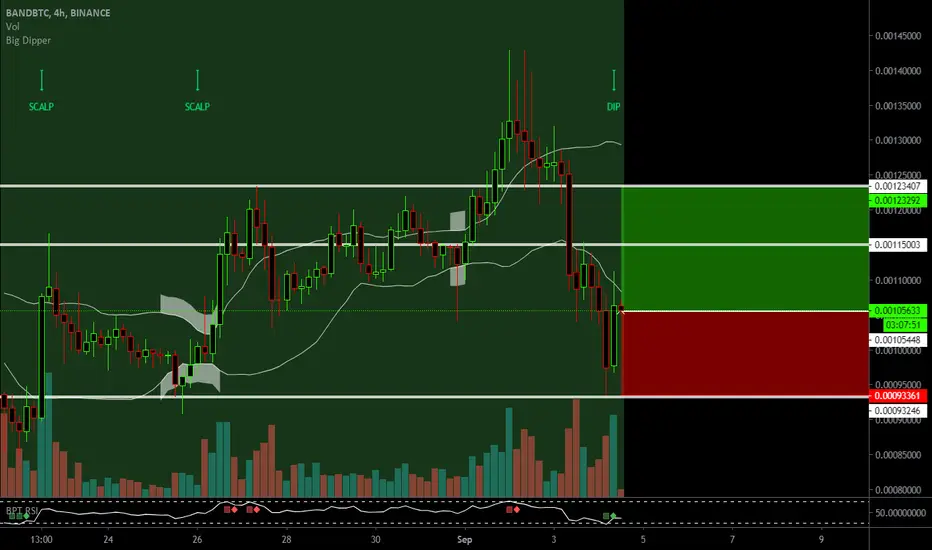
BANDBTC- Long - Potential 16.92%BANDBTC- Long - Potential 16.92%
Entry - 105448
TP1- 115003
TP2 - 123407
SL- 93246
Please comment with thoughts and how you get on.
If you like the idea, then hit like on the idea & support with a follow.
Be Careful Out There!

BAND/BTC (Bearish Double Top?)BINANCE: BANDBTC
-A failed breakout and Bearish double top is painting today
-We can also see a break of trendline support
-If BAND closes below this support area, this might signal a strong downtrend
-The potential downside target is the recent swing Low at 84944 sat area
-An area where potential strong demand might re-enter the market


$Band Triggers a BUY!Band Protocol Has just trigger a buy on the daily trading Plan
3rd September 2020 0:00UTC
Although it triggers a buy now expect downward pressure intraday as 4 hour showing downward momentum
All Rules are met
Just to recap the rules are:
Trigger:
Close above the 20 day Moving average while in an upward direction
Entry Rules:
Stochastic RSI in an upward direction but cannot have either SLOW/FAST in overbought area
MACD in Bullish projection

BandBtc - BAND Protocol - Starting Wave 5Strong RSI, MACD Cross imminent, Strong Volume. LETS DO THIS
Target 100% +

BAND Going UpBAND showing a lot of strength, recovering after the coinbase run-up. RSI trending up, but volume has not stepped in, so good likelihood it gets rejected here, before bouncing back up.
Expecting this to follow link.

BAND-BTCBand look good at the fib 61 golden area A rising wedge is built Be careful with this altcoin if the BTC drop he will go down.


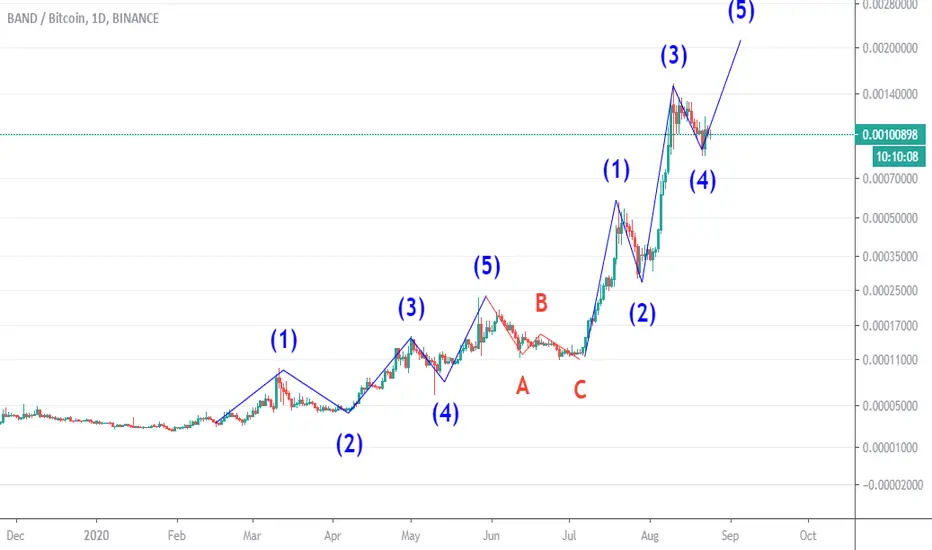
Elliot count on BANDHello, traders.
How far does the BAND can go? We believe that this asset is in on a long-term bullish trend.
We can finish the corrective wave 4 for this asset for the next upcoming days and, we can form another leg up with wave 5.
But be careful, this asset is way oversold on the weekly charts and we can start a corrective movement.
Push the like button and follow us on tradingview.