Band Protocol AB=CD Harmonic PatternYears of accumulation are about to pay off big time.
IBC szn
100x gem
BANDUSD trade ideas


BAND/USD by CryptoTradersWWThis coin grabbed my interest. BAND is currently bouncing to its historical support level. I've noted how many times this support has been validated.
Before we see momentum from BAND, we need to see BAND break over the resistance level at $6-$6.20. If we break through this level, the price may rise to $10.17-$10.86.
<———————————————>
Follow us on our socials for more!
Thanks and happy trading :)

(BANDUSD) LIGHT UP A NEWPORT WE COULD BE BOUNCING OFF SUPPORT!BANDUSD has been chilling around the $5.00 range which is acting as support currently
WILL SHE BOUNCE!
Key Levels:
All Time High - $22.00
Support - $5.00
Resistance - $11.50
TARGETS:
1. $11.50
2. $22.00
We need to see some type of push towards the upside to actually see a continuation towards the upside
I Don't care how long we're at $5.00 I believe we will see buyers swoop in very soon, if not we will break down below $5.00 making this INVALID
HAPPY TRADING!

Look, an undervalued tech giantThere's a nice Gann fan that should be respected with the RSI trend as supporting evidence.
Information infrastructure has always been crucial to business.
Interoperability will be crucial to blockchains.
Combine these two, and you have Band Protocol.
Learn about Band, HODL, and win.

Trading with Fractals: BAND AnalysisIn this chart I break down how I use converging price trends as well as fractal patterns to set up a trade. Here, we have spotted a potential fractal price repetition on BAND, and have an amazing entry. We can use both the fractal movements of the past, as well as converging price lines, to make our price predictions. The BAND chart tells us price is likely to make a strong move upwards in the near future, targeting $21 sometime after Christmas.

BAND fractalHere's an interesting fractal on BAND thats showing a potential rally ahead for this undervalued token

Bullish Gartley Entry on BANDUSDNot many signals on the oscillators suggesting a reversal here but i like the Price Level we are at, I like the Volume, and I like the Harmonic so i think it's worth taking a look at.

BANDUSD - Charting on the fly - Trade strategy - Price Targets In this video:
* We do another Charting-on-the-fly session
* I look at past price history and chart patterns
* We assess the benefit and accuracy of analytics
* We look at current price actions
* We map current price patterns
* We target price and map levels

rubber-band 🏹"I'm just a pulled back arrow getting ready to be launched into the world".
band looks to have completed a 5 wave impulse in this local region, and retraced nicely into the local golden zone.
counting this as a standard 1-2,
looking for $13.11 as a wave 3 target, where i will exit my position entirely.
🏹

Brand huge bull coming!I was gonna post this when it was at $5 but it already double but this is only confirming that some huge buyers are seeing potential in this coin. Looking very BULLISH. Looking for ATH We may see this coin hitting $40 dollars or more. Why there is not really too many of these coin available. If we see brand break under $7 it will be bought back since its still cheap. There is alot of people trying to get their hands on band. Market cap is low. simple 4x and possible 10x. Brand is on most large exchange. Follow for more free analysis. ~~CrptoWhale100billion~~

Rise of DeFi is near Let me be clear on one thing, we are in the Bull market and Altseason is happening. It is only a matter of time which one pops first.
As you can see some of the big names in DeFi are consolidating for a long time.
I believe all these four will need to complete another fill Fib Retracement as It has the potential, Volume, and Liquidity.
If we look at their rise on summer DeFI we can guess it might happen just before BTC reach its all-time high. Guessing the ATH of BTC is another subject but I see a huge opportunity in Giant projects in DeFi that have been quite for some time.


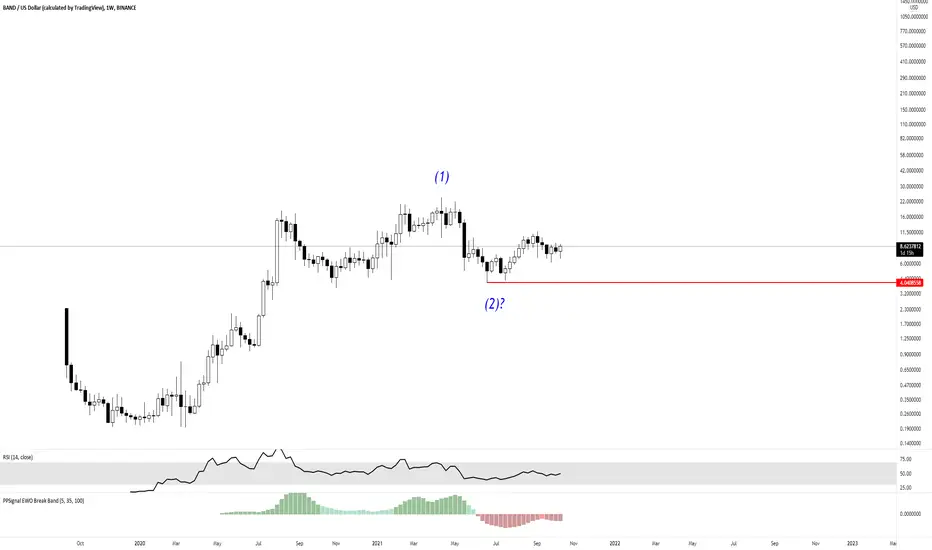
Bands going on tour!Weekly chart shows us likely moving in a rising logarithmic price channel while attempting a break out of a bullish weekly RSI wedge. Initial breakout in 2020 was 6000%+- and from where we stand now it can potentially be 4500-5500% depending on the time needed to reach the top of the ascending channel. Band itself is currently the second largest and most recognized oracle project after LINK while actually capturing more daily oracle data requests then LINK. Its currently 1/40th LINKS market cap and 1/70th LINKS ATH. I figure there cannot just be one oracle as that is an unacceptable centralized point of failure that could cripple an entire economic ecosystem so projects will likely integrate at least two so they can remain running if their major oracle ran into problems.
This means a hand full of oracle projects will round this out and BAND being the second biggest and most recognized after LINK is set to try and take this position.

Time To Get On The Bandwagon.Yes BTC is almost at new highs and there is probably a lot of fear from $ to enter this market atm especially with alts, However the charts look very good for some alts time to start scaling into some positions.
Band 3600% growth potential (weekly chart)Band is a very undervalued coin in my opinion. It is an Oracle like chainlink and is their main competitor while its market cap is currently 41x smaller then that of chainlink. It is also accumulating in a very similar way that chainlink did when chainlink was back in the pennys and once again when chainlink was in the low $1-$4 range.
Currently Band has been consolidating for 425 days since its original 4000% breakout and on the weekly chart as we see here its RSI has been under tight resistance that entire time and now it is looking like it will finally break that resistance and pop out. If it runs to the top of the channel we are likely seeing $280 range BAND this winter if cryptos extended bull run can hang on long enough for it to get there.
This isnt trading advice, just sharing my thoughts on what I think is one of the very undervalued coins that is primed for a huge movement.

Band Protocol is my top pickOn top of this exponential growth, stake your band for 10-17% to get a nice compounding effect.
BAND >>>

Possible Head & Shoulders? My instincts tell me that we need at least 1 more dip nearer to the lower red or black support lines, but here are some options on price-action.
The yellow lines in the red circle might follow the blue arrow=Bullish
Purple lines are extremely bearish.

DIAPARAGING FLAG TA- CAUTIONCurrently we have differing TA signals from the consolidation period after the flash drop. The initial TA had a negative slope indicating a bullish outcome and the current TA, which includes the bullish resulting candles, now has a positive slope which indicates downward candles are coming. Proceed with caution and keep on the lookout for this on all the charts. Im seeing it a LOT but Im not going to post every one of them. GL! DYODD. NFA.

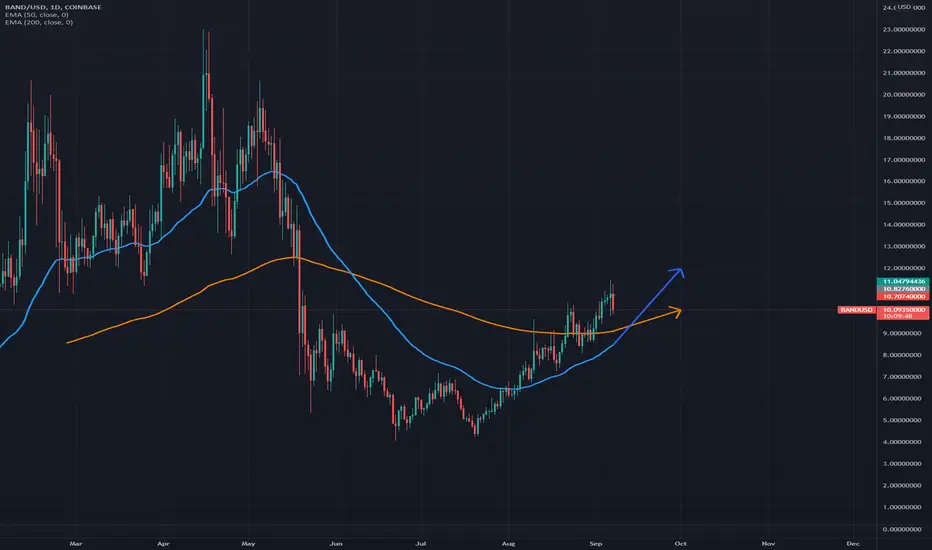
BANDUSD EMA trend continuation implies a steady climb.Hey all!
Just woke up this morning and took a peek at COINBASE:BANDUSD . Plotting the 50- and 200-day moving averages shows that the price is primed to climb significantly. I think we'll see a price at or above $12.00 by the end of September. So anyone looking for a reliable 16-20% growth over the upcoming month, now is the time to put that into BANDUSD in my opinion. If you disagree, let me know in the comments!
David

BANDUSD downward trendBANDUSD on a downward trend today heading towards a previous low support and resistance level

BAND Advance Continuation pt. 2BAND/USD Continuation
Accumulated Gains Since Preliminary Entry (6.51): 47.52%
Prognosis: Band experienced a surge of demand propelling a 4 hr candle from range midpoint all the way through TR-R up to the .272 Fibonacci before wicking back to the 1.0%. Eyeing another target zone climb IMO.
Summary: Had you entered Band with me at the preliminary and not exited, but only took profit through the advances you would've netted a 47.52% return in 19 days. Not too shabby!
*Do you like big wins and big money? Do you have strong hands and patience?
I'm a full-time Wyckoff VSA crypto swing trader (since 2017) and I regularly seek out the most lucrative swings available on all the major exchanges.
All my charts are clean, straightforward, and easy to follow. No junk, no needless indicators, just solid volume spread analysis ( VSA ) and 'take-the-money-and-run' Fibonacci target zones.
My win rates are between 80-85%. Follow me on TradingView and see for yourself.
I review over 300 coins & tokens daily and handpick all the runners myself (no bot signals).
** Not financial advice. Please trade at your own risk.
