BAT BTC So far, 11% profitWell, as we signaled, 11% profit so far Up to the specified trend line can easily go to the river and after that we will definitely have a correction
When it is corrected, we will announce it again. Follow us
BATBTC trade ideas

BAT/BTC Local work. Channel. Diamond figure. Ascending triangleBAT / BTC trading idea for local work.
There is a downward local channel whose resistance is broken.
The formed reversal pattern of a diamon d is similarly broken through.
There is a breakdown of the ascending triangle and a retest of its mirror level.
If the price manages to consolidate, the local uptrend will continue.
If the trend develops, lateral movement will continue to form in the horizontal channel indicated on the chart with support in the region of 0.00002 satoshi.


Approaching a failure of the head and shoulders pattern BATBTCBasic attention token is bullish again! The basic attention token to bitcoin chart is approaching the height of the right shoulder on the recent head and shoulders pattern. If it breaks this, the new target will be 0.00002832 BTC. (Note my previous charts with the downward target had slightly overestimated the height of the head above the neckline. I use the more accurate measurement here).


BAT/BTC You see what i see?!BAT/ BTC looks very ready for a move :) Red Box is important zone which needs to be broken, then this box will act as new support for the price.
Higher Timeframes also looking strong!
Enjoy :)

Horizontal Triangle Pattern (IF THIS DOESN'T PUMP, NOTHING WILL)We saw earlier XTZ pumped and dumped, TRX did same and BAT will also do the same.
Keep an eye on it.

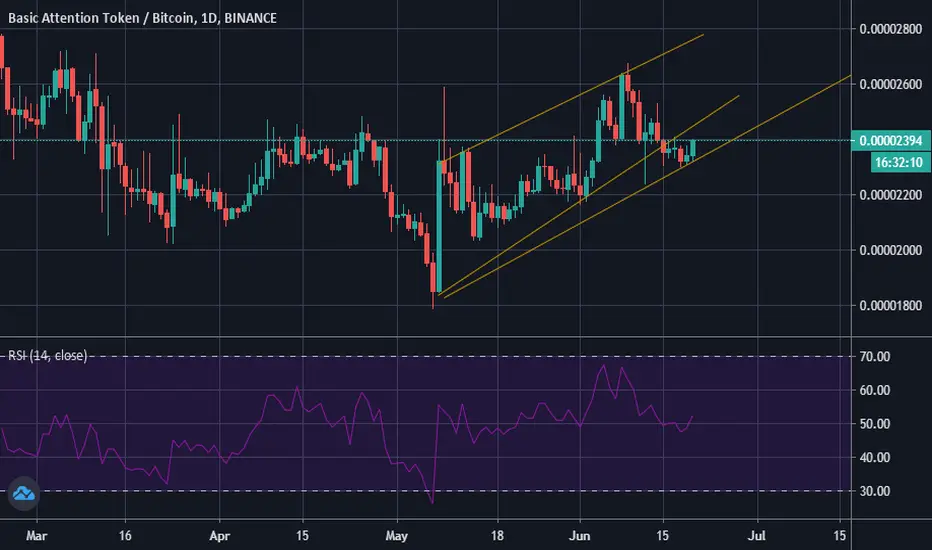
BAT BTC LONG IDEAIn the daily time frame, Cendall is very good
The RSI indicator in the daily time frame is very suitable for purchase and breaks line 50 upwards
There are two trend lines, one above the candelabra and the other below them
If they fail, which is above the candlestick, a good profit can be made

BATBTC LONG IDEAIn the daily time frame, Cendall is very well formed And the RSI indicator has taken the form of an ascent In the trend line, it is specified that one is below the candlestick and the other is above the candlestick If they fail, which is above the candlestick, a good profit can be made
Basic Attention Token BATBTC - Long Term strategyHello Traders!
I have planned a long term strategy for BAT.
We have a contracting triangle, and we might be completing the E-wave (according to Elliot wave triangles), and is exactly at point E , where I will buy to make maximum profits. The area to buy is indicated with the green rectangle.
Another safer strategy, is to buy exactly at the break out of the contracting triangle.
If everything goes as planned, we might be looking at 200% profits.
I think BAT has a lot of use cases, and is a solid project.
Please let me know what you think, and as always this is not financial advise do your on research.

Basic Attention Token (BAT) | Patience Is Key!Some people are losing patience with Basic Attention Token (BATBTC)... But remember, patience is key!
This is the setup we have now where prices moved above MA200 but quickly fell below...
Even though there was a rejection at this level, EMA50/100 is still working as support.
From this level, prices can easily jump (green arrow)... But even if prices drop, we remain bullish after the drop...
Patience is the key to win/succeed.
Namaste.

BATBTC | Structural Support | Apex | Low Volume Todays Chart – BATBTC – trading in a multi-month triangle formation nearing its apex.
Points to consider:
- Support and resistance converging (apex)
- Macro swing low failure
- Low volume
- RSI breaking below 50
BATBTC needs to hold local support for a break and of local resistance.
However, failing to hold local support; a break to structural support is plausible.
Swing low failure (higher low) on the daily is indicative of a macro trend shift. S/R flip st structural resistance will solidify trend reversal.
Volume is below average, an indication that an influx is imminent coinciding with the probable breakout.
RSI is breaking below 50 showing weakness in the market indicating a probable retrace to structural support
Overall, in my opinion, BATBTC has some work to do and needs setup.
A long trade will be validated on a re-test of structural support (conservative entry) or a break and re-test of local resistance (aggressive entry).
What are your thoughts? Let me know in the comments below!
Be sure to leave a like and follow me for daily chart updates.
As always, focus on you - and the money will too!

Head and Shoulders for BATLet’s see Head and Shoulders and Trend Line Touch detection at the same chart for BAT
Which direction?
I don’t know but no need to take risk, forget it. It’s only good example to understand technical analysis

BATBTC Head and Shoulders PatternBATBTC is forming a head and shoulders pattern. Expect BAT to be bearish in the near future relative to the bitcoin and therefore the crypto market in general. I don’t see a head and shoulders, however, in the BATUSD chart, so BAT may still be a good buy relative to fiat. The Brave web browser recently received some negative coverage (to read about it Google: “Brave affiliate link controversy”) and I suspect that may contribute to a downtrend in the near future. In the long term I believe that is something Brave and BAT will put in the rearview mirror, and I do expect BAT to be one of the coins that most benefits from the bullish crypto cycle that we are now entering.

BAT - On the move...#BAT Retraced to the demand zone where buyers stepped in and pushed price up with an impulsive more. After some consolidation price should now ready to breakout on LTF with another impulsive move... If your not in alrea BINANCE:BATBTC dy could be a nice spot to hop in..
15M
Please take a look, like, comment...
Thanks

BAT is ready to Explode! BUY SIGNALGuys PAY ATTENTION!
Been accumulating for a while and is ready to explode! If you are selling it, i ask you what are you doing in crypto? Soon this coin will be at $1+ ....until $8 to $10... Are you calling me ambitious? We will talk by then.
NOT A FINANCIAL ADVICE, JUST MY REVIEW ;)
PLEASE INVEST AT YOUR OWN RISK


#batbtc
##Batbtc long term idea,
Sustain above 2410
Target should be 3439 mid term
more target will share when price reach 3439
CMP is 2507
DYOR before buying any stock
Chart made by technicalstrategycommunity

QS BAT/BTC quick scalp opportunityNo time for BIG explanation if this have to be actuall.
I just see this toppy here and reversal possible.
-------------
Disclaimer:
I´m not registered or licensed in any jurisdiction whatsoever to provide investing advice or anything of an advisory or consultancy nature, and therefore I´m unqualified to give investment recommendations. Always do your own research and consult with a licensed investment professional before investing. This communication is never to be used as the basis of making investment decisions, and it is for entertainment purposes only.

BAT/BTC UpdateSo my previous chart on BAT got invalidated due to lack of bearish momentum. So, i made a new analysis on BATBTC.
- As we see here, BAT broke out of the channel and flipped it to support.
- We can expect the price to go up to the 1.272-1.618 fibonacci extension. That would be our first take profit region.
- If the price extends beyond that point we can look to tak our next profit at 2.24 extension. All of which is marked in the chart.
Will update when required. Follow me for regular content on Crypto and Equity based charts.
-Kautilya.K


$BAT, Crossing over ~2600 sats level..$BAT
Crossing over ~2600 sats level & trying to flip it into support as 12H EMA50/200 are showing a golden cross
Making a HH w/ increasing volume could also lead to confirmation of continuation to the upside..
Next resistance/target should be around 2900sats (~12%)
$BAT

