bat should have your attention herePotential to leave its whole range and make new highs with this volume if rest of market stays bullish
BATBTC trade ideas

BAT Mooning SoonBAT reaching ATH again with strong buy.
I think it's a very interesting place and
we need to watching where to sell it :P

BAT inverse H&S formingIf we close above the trend line we could be seeing some more bullish action out of BINANCE:BATBTC !


Keeps pushing trying to reach ATH resistance one more time.$BAT Keeps pushing trying to reach ATH resistance one more time.
Over 50% since UCTS called the trade from the falling wedge breakout.
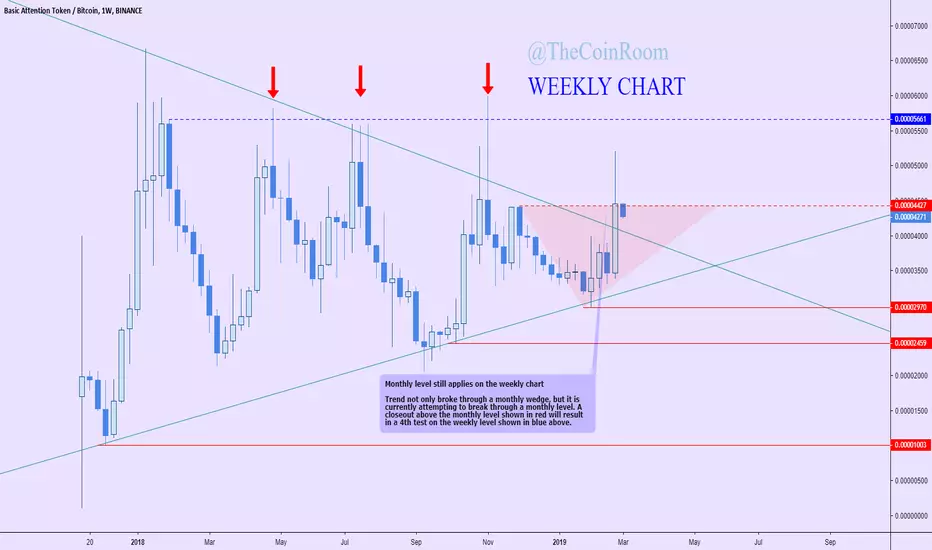
Also,look at the weekly chart.#BAT its a constant iteration from bottom to top (fourth time that happened now, this one is the biggest in volume!)
Btw, Hidden RSI divergences by the UCTS on the weekly seems to signal the start of a new bull trend.


BATBTC - Wait for confirmBAT has big resistance at this zone.
Wait for confirm
We will follow it and update for you!


BAT/BTC STRONG SIGNALS OF TOP REVERSAL!Hey everyone, today I'm going to make my analysis on BAT and explain my point of view, so let's begin!
When we climbed, we were reaching a previous resistance (the bearish engulfing bar at 2 march 12-16h), if we watch closely, we had a long legged doji, which usually signals a top(depending on where its formed) (it's a bit subjective, may not be a doji, but the idea still maintains) , formed also a bearish harami, and now it's forming a bearish engulfing bar or a bearish harami, in the same area of resistance. From the candle of 8 march 4h, we can also conclude, that based on the close (broke through resistance and closed below it) , which is also a bearish signal. Strong signals that the market is turning.
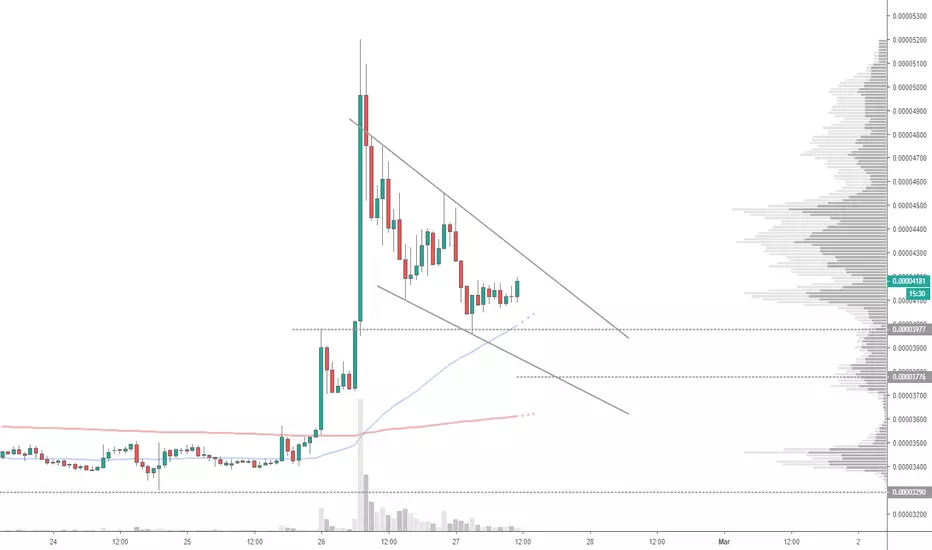
According to my Fibonacci Analysis, I'm expecting a drop to the golden pocket (between 61.8 and 65) (4646-4670) which will serve as a temporary support, and will probably pump from there to 4924 (38.2 fib resistance , this is just a supposition if it indeed does pump in this temporary support).
If you guys watch closely, that fib of the short trade, has the 1.272 target right in my buy zone, which is an area where multiple fibonacci levels almost interlap, making this zone really powerful. This buy zone consist of 1 golden pocket, a 78.6 fib support level, and the 1.272 possible target (if the pump above occurs).
Buy zone: 4440-4486
When is the trade ready?
1) If now it forms the bearish engulfing bar or a bearish harami.
2) If it doesn't go above 5125.
You know what they say: If the public is very bullish, it means institutional are selling! Be prepared.
If you want to share your ideas , comment down below and like if you enjoyed this analysis.
Disclaimer: I'm not a financial adviser , i'm not responsible for any losses due to following my chart analysis!


BATBTCSee chart. Idea. This is my viewpoint and my opinion. I am not giving advice but only sharing what I see.


50% on the last 20days... Amazing over 50% run in the last 20 days for $BAT.
For some reason I couldn't catch it on time, but the UCTS did =).
Currently RSI is reaching high overbought levels..
Remember to take profits, we can experience a pullback soon #BAT

BAT - ActionBAT is nearing resistance with good volume. I wanna see a bounce from the resistance to a higher support level to remain bullish.
Buy & sell positions in our crypto signal scanner (comment).

EW ANALYSIS: BATBTC Ready To Jump?!Hello traders!
Today we will talk about Basic Attention Token against the BTC. (BATBTC)
Well, cryptocurrencies look more and more interesting in 2019 after that long and big correction in 2018. So, one of those cryptocurrencies which can be showing a clear pattern and some nice bullish evidences is BATBTC.
What we see is a completed big (A)-(B)-(C) correction from January till September in 2018, from where we can clearly see a five-wave rally into the first wave of a bullish cycle till November of 2018, where price dropped again in an A-B-C correction of a lower degree.
And, as you can see, in February of 2019, we have seen a nice bounce, exactly from important 78,6% Fibonacci retracement and 0.000030 psychological support level.
We believe that BATBTC has formed a nice bullish setup here that can be pushed into an explosive third wave towards 0.000093 - 0.00011 area! But, to confirm our wave count, we need a break above 0.000060 bullish confirmation level before it drops back below 0.000030 invalidation level!
Trade well!
Disclosure: Please be informed that information we provide is NOT a trading recommendation or investment advice. All of our work is for educational purposes only.

BATBTC [Daily] Selling spikes towards 5500/6000This time something from the short side. Looking to sell spikes twds 5500/6000 - we are within the wide range and as long as daily close below 6000 shorts are safe. First target around 3500, second around 2000

BATBTC Ichimoku signs real nice1. Breaking up the cloud hard
2. Momentum nice
3. Lagging line well above cloud
4. Upcoming cloud bullish
5. Support ~35

BAT getting ready for another leg upKeeping an eye on $BAT.
Ideally it will stay in this bull flag for a bit longer, confirm the resistance and then go for another leg up.
I'll enter on the breakout, if indicators won't persuade me otherwise.
BAT - Early Entry Point of Repeating FractalLooking at BAT's daily chart, the price has found support along the pink trend and is starting the early phases of a pattern it has repeated twice thus far. This looks like a good entry point. If the price reaches the same area as the previous two fractals, we're looking at almost a 2x gain.


Watching BATBTC Value Area Low for a Potential Reversal12hour Bearish TK Cross, but its above the cloud so its a weak cross, but because price is below all lines and the cloud it is quite bearish.
3hour Red Cloud resistance ahead of price. We are starting to see a small relief bounce, but not convincing just yet.
1D Significant levels at 3287 (closest support) 3625 (closest resistance) and 3943 (next major resistance)
1D Price is resting around POC, slightly below it. Value Area Low is 3077 this can act as major support for price when tested, keep an eye on this level. Value Area High is at 5183 this can act as major resistance once price breaks above POC.
Overall, there is no confirmation for a bullish reversal, but if the Value Area Low and closest support are held we can see a great buying opportunity form.
