Possible floor on BAT/USDPossible floor en BAT/USD. Three reasons:
1. Possible triple bottom.
2. Close to channel support.
3. Possible bullish fundamentals on crypto space.
BATUSD trade ideas


BATUSD COMMENTSThis looks more of a stable market, there was a bearish movement during the 20th to the 21st but the price bars quickly measured up to the EMAs in a matter of 2days. The Stop Loss is placed closer to the EMA (200) movement. This market's next movement cannot easily be predicted as there is no particular pattern shown by the trend. The Target Price is placed at the last higest price reached at 1.91:1 Risk/Reward ratio gto be at a safer Trading position.


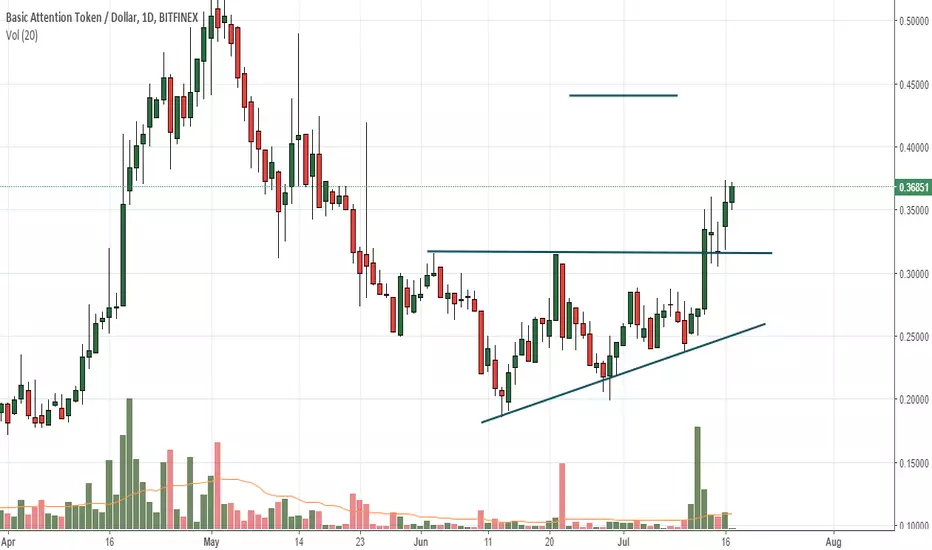
BATUSD Commentary-6 Week ascending triangle
-Break above 50SMA with volume and breakout of pattern within same day
-Pattern retest with upside continuation
-Measured move up to 0.44
Crypto markets have peaked my interest of late and am exploring the applicability of my classical charting approach to crypto markets.
I am in the process of setting up Binfinex account and will add crypto to my weekly scans hereafter.
Wow, did Coinbase mean to tweet this... ??? !!!Just got on my phone a tweet.
They deleted the tweet, but it said the following:
Coinbase started a thread:
Today we are announcing that we're exploring the addition of the following assets to Coinbase:
Cardano (ADA), Basic Attention Token (BAT), Stellar Lumens (XLM), Zcash (ZEC), and 0x (ZRX). blos.coinbase.com...
Wow!!! If this is for real... $$$

BATUSD Awaiting Confirmation of SupportBITFINEX:BATUSD
After a long dive, it is now slowly reversing, confirmation of support will be evident over the weekend. Stay tuned.
I own my own cryptocurrency tamadcoin.io

BAT on alertBAT is on priority alert. It has now made it's way to No 50 on the coin market cap list. I really like this project. Might take a position in the demo account.


BAT on BAT: what the hell is going on??As the proud user of the Brave browser I was looking for a place where it made sense to get some BAT. Then I saw a virtually perfect bearish BAT pattern... holeee shit :D
In the video i plot the pattern, discuss the pattern and then move on to what seems to be the beginnings of a Butterfly pattern.... what that essentially means is should this pattern work, price could make a C in the Butterfly which will allow me to get some BAT and trade it up to the 1.272 or 1.681 extension.
I will likely make a separate video on this should price head to where I think it might.
Have a good one!

"BATUSD" - FIRST COUNTNot every day that we can start fresh with an instrument, with not so much data and history.
So let's look at BAT (Basic Attention Token) based on Ethereum blockchain from the chart point of view.
Well, first it looks like there is plenty of room to the downside but we reached the 61.8%-78.4% extension zone of red label degree and while I know that equal leg area of highest degree would come at 0.004920, I can many cycles ending on 18/03/2018, let's make the case for a base here.
First, RSI trendline broke (would like a better confirmation though) in 4h time frame, indicating that a cycle has ended. What cycle? well, I see 2: cycle from 03/03/2018 high for the most obvious and also 18/02/2018 high.
From 0.1540 low, BATUSD has bounced in a 3 waves that ended at 0.2646 and that is still a correction. So now, we need to check the structure of the pullback. I do not think it will break immediately down but market does it wants. So, while above 0.1540 we should see more upside to correct the cycle from 0.4797 high in a corrective manner - I do not need to see motives everywhere to have a trend-.
I will not propose trades in daily here at I do not pick tops and bottoms (investing would be different though), but I think that there is potential in lower time frame. Follow me on my patreon for 1h time frame but I will continue updating here on daily view.
So would you be buying this token?

Looks promising during these times...This one looks promising. Check volume as of lately and RSI. Considering the current affairs in BTC world, outperforming...

BASIC ATTENTION TOKEN BY DANIEL BRUNO, CMTSUPER SENSITIVE TO CHANGES IN BTC
BULL MARKET ON HOURLY CHART AS PRICE STAYS ABOVE THE 1X1 ON BOTH THE LOW AND HIGH POINTS
UNTIL CRYPTOS DECOUPLE FROM BTC OR BTC RISES, GAINS WILL BE DIFFICULT
DANIEL BRUNO, CMT

BAT/USD is bullish. Target $1.00 USDI think we are clearly in a Cup&Handle long formation.
Target by march: $1 USD
Time will tell.

BAT IN USDDANIEL BRUNO, CHARTERED MARKET TECHNICIAN
INTERESTING HOW THE GANN LINED OVERLAP FROM THE BAT/BTC CHART, I DIDNT EVEN HAVE TO DRAW THEM
NOTE THAT THE CHANGES IN RESISTANCE ALIGN WITH GANN LINES
BAT IS GOING TO BREAK OUT IN BTC AND USD

BASIC ATTENTION TOKEN BATDANIEL BRUNO
RESISTANCE POINTS FORM A PARABOLIC EQUATION I.E. PRIME NUMBERS
LOOKING FOR BREAKOUT BY JAN 27 WITH TARGET 0.9 OR 1/1 SLOPE

BAT eye on $2.07 (Prediction #38)BAT eye on $2.07 (Prediction #38)
Trade Date 23 Jan 2018
Expected Date (will be announced)
Target : Pending
Result Date (will be announced)
