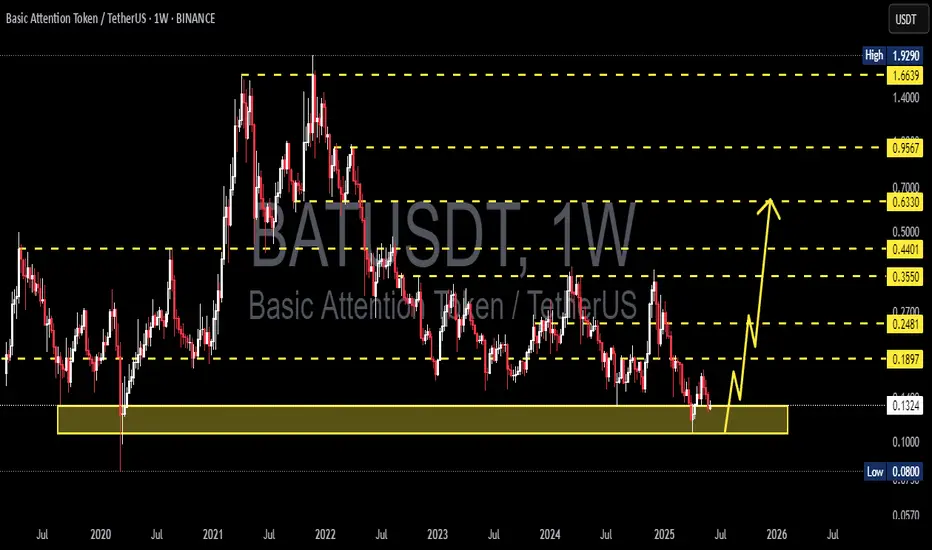
BAT/USDT Golden Zone: Massive Rebound Potential from Historical 🔶 1. Strong Support Zone (Highlighted in Yellow):
A key demand zone lies between $0.080 – $0.1212.
This area has acted as strong support multiple times since 2020, showing signs of institutional accumulation or whale interest.
🔼 2. Bullish Reversal Scenario:
A recent bounce from this golden support zone suggests a potential bullish reversal.
The projected path (yellow arrows) illustrates a step-by-step rally toward multiple resistance levels.
Potential Upside Targets:
🔹 $0.1648 (Initial minor resistance)
🔹 $0.2098 (Previous consolidation zone)
🔹 $0.3551 (2023 distribution zone)
🔹 $0.4368 (Major pre-breakdown resistance)
🔹 $0.6275 (Medium-term bullish target)
🔹 $0.9412 – $1.6487 (Long-term resistance levels)
📉 3. Risk Management & Invalidations:
A weekly close below $0.1212 may trigger a move toward the $0.090 – $0.080 historical low zone.
A breakdown below that would invalidate the bullish outlook and call for a reassessment.
📆 4. Timeframe & Additional Signals:
This is a weekly timeframe chart, ideal for swing or long-term traders.
While volume confirmation is not yet strong, the early formation of a higher-low suggests a possible trend reversal.
✅ Conclusion:
BAT/USDT is currently trading in a high-probability reversal zone with strong historical support. If this zone holds, it could trigger a significant multi-level bullish rally. A good opportunity for patient traders with proper risk management.
BATUSDT trade ideas

BATUSDT 1W AnalysisBAT ~ 1W Analysis
#BAT This trade is very high risk
This is the lowest support block for now. Buy with a short term target of at least 20%+ from here.
BATUSDT 1D Analysis BAT ~ 1D Analysis
#BAT Buy gradually from here if you still have confidence in this coin with a short term target of at least 15%+ from here.

BAT Long hereBreakout & on the support zone.
Buy with short -term target of at least 10%+ from here.

BATUSDT 1D AnalysisBAT ~ 1D Analysis
#BAT Buy when re -testing this support block with a short -term target of at least 10%+ from here.

batusdt next move?🚀 BAT Coin Opportunity Alert
If BAT touches the 0.134 USD level — don’t miss the opportunity to enter! 📈
Even if BAT doesn’t hit 0.134,
✅ You can still enter if Bitcoin (BTC) drops to 90K, as the setup will remain strong.
Stay ready, manage your risk, and take advantage of the move!
BAT ANALYSIS🚀#BAT Analysis :
🔮As we can see in the chart of #BAT that there is a formation of "Falling Wedge Pattern". In a daily timeframe #BAT broke out the pattern. Expecting a bullish move in few days if #BAT retest the levels
⚡️What to do ?
👀Keep an eye on #BAT price action. We can trade according to the chart and make some profits⚡️⚡️
#BAT #Cryptocurrency #TechnicalAnalysis #DYOR

Basic Attention Token, An Old FriendLet's take the market bottom as the low that was set in June 2023, what do you see?
One single signal can reveal the bottom is that true?
One single signal can tell you everything that is going on with a chart, or not.
It is more about your experience, what you know about the market and the market cycle.
The main bottom for the 2022 bear market for Basic Attention Token (BATUSDT) happened in December 2022, after it goes sideways but, let's take June 2023 as the market bottom for the purpose of this chart.
#1 on the chart is a stop-loss hunt event. It leads to a bullish wave.
#2 on the chart is the same; a reversal comes next.
The bullish signal is in because #2 is already gone. The action went below long-term support (June 2023 low) is now trading back above it. Three weeks green, bull confirmed; yes we win! Yes, I win!
So this is easy don't you agree?
What's the potential for growth?
An easy target will give us some 350%. A strong target will give us 795%. Strong is not the best. We can end up with better target specially if we consider how the market in the past behaved.
Are you with me?
What do you see?
Do you agree?
The comments are the feedback, interact with me; what do you see?
Do you agree that this chart is green and set to grow?
If you agree boost, if you disagree boost and follow.
Thanks a lot for your support.
A strong rise can take more than a year to develop. With a low in August 2024, a high can happen in August 2025. Sounds early, looks early, feels early but can happen.
Taking the lowest point since the March 2020 bottom, April 2025, an entire year of bullish action would put an All-Time High in April 2026. This sounds good but, can it be true?
Too good to be true or too hard to believe?
If the bull market can be late to start, it can also end late.
Let's hope the bullish action goes beyond 2025 into mid-2026, that would be the best. The longer it takes, more time to adapt, plan and to secure wins and profits.
Thanks you for reading.
Namaste.

BAT is getting close to the buyers' zone (3D)After multiple drops, it seems that BAT is getting close to a strong support level. In this zone, it is possible to buy gradually in spot.
The targets are indicated on the chart.
The closure of a daily candle below the invalidation level will invalidate this analysis.
Do not enter the position without capital management and stop setting
Comment if you have any questions
thank you

BAT bullish plan - untill March 2026using time based fib on most of the altcoins showing that we will have 2 waves bull cycle.
first wave end September-October 2025
second wave end in March 2026
then 3+ years of bear market
BAT first wave 1.35$ by October 2025
then 2-3 months of correction and consolidation
last wave to 2.6$
**not financial advice, newbie charting**

BATUSDT 1WBAT ~ 1W Analysis
#BAT Buy gradually from here with a short -term target of at least 20%+. This is the lowest support block for now.

$BAT/USDT Trading IdeaBAT is also sitting at its lowest point. Can we see another dead cat bounce for a potential 140-150% rally up to that juicy resistance around $0.40?

BATUSDT longhi traders
Let's check BATUSDT on 1W time frame.
It's been in a range for a long time.
The price is still pretty close to the bottom of the range which is a low-risk area so entering long is justified.
Target for long is at the top of the range.
Good luck

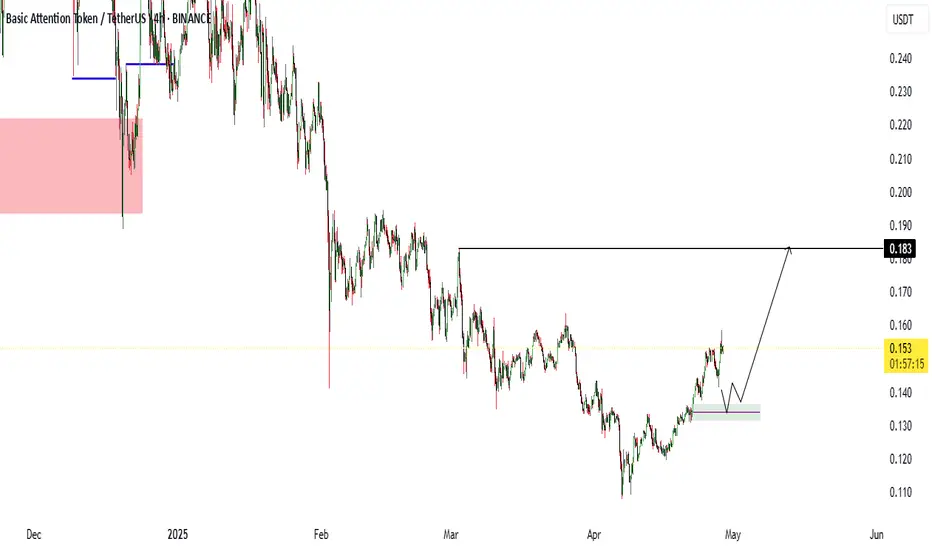
BAT ANALYSIS🔮#BAT Analysis :
📈📈 #BAT is making perfect Double Bottom Pattern. We can see a good pump if #BAT breakout the major resistance zone with good volume and sustains the higher price after breakout 🚀🚀
📊 Current Price: $0.1675
⏳ Target Price: $0.1800
⁉️ What to do?
- We can trade according to the chart and make some profits in #BAT. Keep your eyes on the chart, observe trading volume and stay accustom to market moves.💲💲
#BAT #Cryptocurrency #Pump #DYOR #Breakout

BAT Repeating Patterns Before a Potential 900% SurgeBINANCE:BATUSDT retesting the neckline of head & shoulder top, it surged 900% last time after retesting, potential buy point now?
🔴 Read my signature & publications for more info you don’t want to miss.
🔥 for more future "guesses" like this!

BATUSDT 1WBAT ~ 1W
#BAT If you still have a Conviction on this Coin, buy gradually from here with a minimum target of 20%+

BAT/USDTKey Level Zone: 0.2340 - 0.2360
HMT v5 detected. The setup looks promising, supported by a previous upward/downward trend with increasing volume and momentum, presenting an excellent reward-to-risk opportunity.
HMT (High Momentum Trending):
HMT is based on trend, momentum, volume, and market structure across multiple timeframes. It highlights setups with strong potential for upward movement and higher rewards.
Whenever I spot a signal for my own trading, I’ll share it. Please note that conducting a comprehensive analysis on a single timeframe chart can be quite challenging and sometimes confusing. I appreciate your understanding of the effort involved.
Important Note :
Role of Key Levels:
- These zones are critical for analyzing price trends. If the key level zone holds, the price may continue trending in the expected direction. However, momentum may increase or decrease based on subsequent patterns.
- Breakouts: If the key level zone breaks, it signals a stop-out. For reversal traders, this presents an opportunity to consider switching direction, as the price often retests these zones, which may act as strong support-turned-resistance (or vice versa).
My Trading Rules
Risk Management
- Maximum risk per trade: 2.5%.
- Leverage: 5x.
Exit Strategy
Profit-Taking:
- Sell at least 70% on the 3rd wave up (LTF Wave 5).
- Typically, sell 50% during a high-volume spike.
- Adjust stop-loss to breakeven once the trade achieves a 1.5:1 reward-to-risk ratio.
- If the market shows signs of losing momentum or divergence, ill will exit at breakeven.
The market is highly dynamic and constantly changing. HMT signals and target profit (TP) levels are based on the current price and movement, but market conditions can shift instantly, so it is crucial to remain adaptable and follow the market's movement.
If you find this signal/analysis meaningful, kindly like and share it.
Thank you for your support~
Sharing this with love!
HMT v2.0:
- Major update to the Momentum indicator
- Reduced false signals from inaccurate momentum detection
- New screener with improved accuracy and fewer signals
HMT v3.0:
- Added liquidity factor to enhance trend continuation
- Improved potential for momentum-based plays
- Increased winning probability by reducing entries during peaks
HMT v3.1:
- Enhanced entry confirmation for improved reward-to-risk ratios
HMT v4.0:
- Incorporated buying and selling pressure in lower timeframes to enhance the probability of trending moves while optimizing entry timing and scaling
HMT v4.1:
- Enhanced take-profit (TP) target by incorporating market structure analysis
HMT v5 :
Date: 23/01/2025
- Refined wave analysis for trending conditions
- Incorporated lower timeframe (LTF) momentum to strengthen trend reliability
- Re-aligned and re-balanced entry conditions for improved accuracy

$BAT/USDT Breakdown$BAT/USDT Breakdown
BAT broke the trendline and faced rejection at $0.30 resistance.
There is a potential drop to $0.12, or 53%.
Watch for volatility!

BATUSDT: Blue Box Opportunity Ahead?BATUSDT: Blue Box Opportunity Ahead? 💹
The blue box below could be an ideal entry zone, but only if market conditions align. As always, patience and precision are key, don’t jump in without confirmation.
How to approach this:
Blue Box: A potentially strong demand area worth monitoring closely.
LTF Confirmation: Wait for low time frame (LTF) structure breaks before executing trades.
Smart trading wins the day! Manage your risk, watch the charts, and stay ready. Boost, comment, and follow for more expert insights! 🚀
Let me tell you, this is something special. These insights, these setups—they’re not just good; they’re game-changers. I've spent years refining my approach, and the results speak for themselves. People are always asking, "How do you spot these opportunities?" It’s simple: experience, clarity, and a focus on high-probability moves.
Want to know how I use heatmaps, cumulative volume delta, and volume footprint techniques to find demand zones with precision? I’m happy to share—just send me a message. No cost, no catch. I believe in helping people make smarter decisions.
Here are some of my recent analyses. Each one highlights key opportunities:
🚀 GMTUSDT: %35 FAST REJECTION FROM THE RED BOX
🎯 ZENUSDT.P: Patience & Profitability | %230 Reaction from the Sniper Entry
🐶 DOGEUSDT.P: Next Move
🎨 RENDERUSDT.P: Opportunity of the Month
💎 ETHUSDT.P: Where to Retrace
🟢 BNBUSDT.P: Potential Surge
📊 BTC Dominance: Reaction Zone
🌊 WAVESUSDT.P: Demand Zone Potential
🟣 UNIUSDT.P: Long-Term Trade
🔵 XRPUSDT.P: Entry Zones
🔗 LINKUSDT.P: Follow The River
📈 BTCUSDT.P: Two Key Demand Zones
🟩 POLUSDT: Bullish Momentum
🌟 PENDLEUSDT.P: Where Opportunity Meets Precision
🔥 BTCUSDT.P: Liquidation of Highly Leveraged Longs
🌊 SOLUSDT.P: SOL's Dip - Your Opportunity
🐸 1000PEPEUSDT.P: Prime Bounce Zone Unlocked
🚀 ETHUSDT.P: Set to Explode - Don't Miss This Game Changer
🤖 IQUSDT: Smart Plan
⚡️ PONDUSDT: A Trade Not Taken Is Better Than a Losing One
💼 STMXUSDT: 2 Buying Areas
🐢 TURBOUSDT: Buy Zones and Buyer Presence
🌍 ICPUSDT.P: Massive Upside Potential | Check the Trade Update For Seeing Results
🟠 IDEXUSDT: Spot Buy Area | %26 Profit if You Trade with MSB
📌 USUALUSDT: Buyers Are Active + %70 Profit in Total
🌟 FORTHUSDT: Sniper Entry +%26 Reaction
🐳 QKCUSDT: Sniper Entry +%57 Reaction
📊 BTC.D: Retest of Key Area Highly Likely
This list? It’s just a small piece of what I’ve been working on. There’s so much more. Go check my profile, see the results for yourself. My goal is simple: provide value and help you win. If you’ve got questions, I’ve got answers. Let’s get to work!

BAT can ascend further!BINANCE:BATUSDT
BAT is in an ascending Triangle Right now! we know that the price will increase after the break out and confirmation happens!
the price should increase and reach the resistance shown on the picture!

BATUSDT 1WBAT Update ~ 1W
#BAT So far it still maintains its bullish structure. Buy gradually within this support block,. minimum target 20%+

Price rengeBAT/USDT Chart:
Trend: Uptrend Price above moving average (yellow line).
Support: Green zone
Around 0.2317.
Resistance: Red zone Around 0.3778.
Possible Strategy:
Buy: Breaked EMA snd firs resistance
Sell: If price fails to break resistance
Note: Always consider market new and overall trends.

$BAT Prediction on weekly frameHello Traders,
I have been watching Basic Attention Token for a while. So far it has been a bit underperformer. However on the weekly time frame , incrementally increasing volume along with technical values signaling for a possible rally!
Technical points Weekly chart
* Rsi is 52 perfectly sitting in the neutral zone ,starting to curve up
* 3 major indicators flashing (RSI,OBV,VWMACD)
* 11 Moving averages out of 14 producing strong buy signal
* Oscillators producing buy signal
* Upside potential 5x greater than downside
* Grayscale investors very interested in this product!
* 385mil USD mid-market cap coin .All of the Coins are already in circulation . No more unlocks or mining.
* Great product that producing high revenue.(Check Brave browser! My personal opinion is their product better than $2.4trillion usd company Google's browser)
* Offered by the Big exchanges Binance, Coinbase etc.
* Great team. You can also view every individual that works there by their name. Nothing is secret!
Possible Targets are outlined on the chart! I am personally expecting big rally. We could possibly see $1 or more at some point. Please do your own research! And don't get stuck by the shorter time frames!
Make sure to have a Great Christmas and new year!
