BATUSDT trade ideas


BATUSDT - Long - Potential 14.41%BATUSDT - Long - Potential 14.41%
Entry- 2094
TP1- 2218
TP2- 2396
SL- 1939
- BTC - breaking new highs always chance of big sell off now, be careful
- RR - 1.95
- Trailing Buy - 0.5%
- Trailing Profit - 1%
- Trailing Stop-Loss - No


batusdt basic attention tokensafter watching bat for awhile it looks like its accumulating and poising for a small breakout up to .22 at this point it will be at the neckline for a head and shoulders on the 5m and 15 the ema is crossing bullish and the money flow is resetting showing a surge in cashflow. all the indicators are pointing upward id say its a good time to buy in and maximize profits

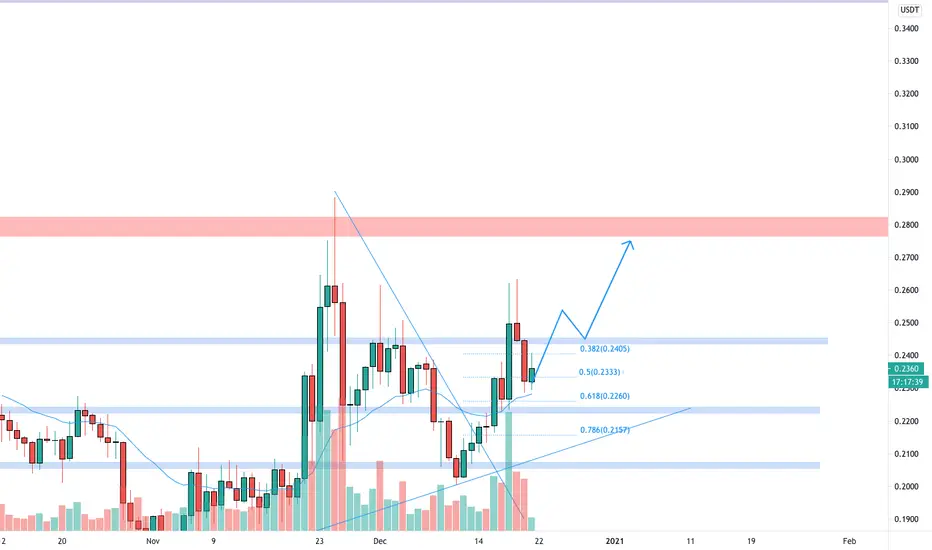
BAT/USDT 1 hour chart bull flagWe got a possible bullflag about to come to completion on the 1 hour chart. Levels are clearly marked on the fib and a breakout level entry is well marked. Keep an eye on BTC at this time. If you agree throw me a like and follow me for more unique concepts, ideas, and setups that keep you in the gains.

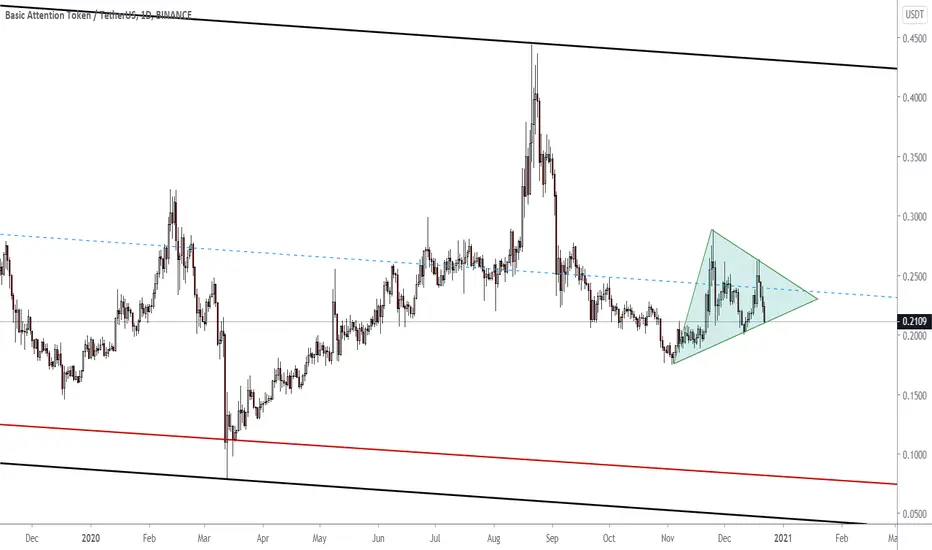
BATUSDTWe analysis in the major trend for someone who wants to hold this coin.
As you see it makes an downtrend and price is in the middle of it.
Now we can find an triangle pattern too. For short or long we have to wait for break the pattern first.
Follow and like us if you liked our posts.
batusdtBINANCE:BATUSDT
Hello my good friends
Well, I am at your service with technical analysis of bat currency
Well, the friends of the blue and red regions are the Fibonacci prz regions
Abtime is daily and red is weekly.
And the price is moving in the uptrend and channel then you can trade as long as the price is up and prz is moving.
Note: This is only a personal analysis and you can analyze it better and easier for yourself according to my words.

BATUSDT is testing 0.5 Fibonacci level 🦐BATUSDT is testing 0.5 Fibonacci level after breakout. IF the price will have a breakout from daily resistance According to Plancton's strategy (check our Academy), we can set a nice order
–––––
Follow the Shrimp 🦐
Keep in mind.
🟣 Purple structure -> Monthly structure.
🔴 Red structure -> Weekly structure.
🔵 Blue structure -> Daily structure.
🟡 Yellow structure -> 4h structure.
⚫️ Black structure -> <4h structure.
Here is the Plancton0618 technical analysis, please comment below if you have any question.
The ENTRY in the market will be taken only if the condition of the Plancton0618 strategy will trigger.
BAT/USDTTime to hodl them Brave Browser tokens, cashing them out for some McDonald Giftcards at 0.60


BATUSDT STARTS ITS UPWARDS TRENDIt is clear that bat token will move upward after the recent breakout from previous downward trend

BATUSDT is trying to have a breakout 🦐BATUSDT is trying to have a breakout from the descending daily trendline. IF the price will have a breakout and turn the current resistance into new support, According to Plancton's strategy (check our Academy), we can set a nice order
–––––
Follow the Shrimp 🦐
Keep in mind.
🟣 Purple structure -> Monthly structure.
🔴 Red structure -> Weekly structure.
🔵 Blue structure -> Daily structure.
🟡 Yellow structure -> 4h structure.
⚫️ Black structure -> <4h structure.
Here is the Plancton0618 technical analysis, please comment below if you have any question.
The ENTRY in the market will be taken only if the condition of the Plancton0618 strategy will trigger.

BAT : Long TradeHello Dear Traders,
After very good accumulation BAT is breaking upside. looking strong bullish
Entry and exits posted in chart


BATUSDT completed Gartley move | Upto 35% move expectedOn daily chart, the price action of Basic Attention Token has formed Gartley pattern and reached in potential reversal zone.
Buying And Sell Targets:
The buying and sell targets as per Fibonacci sequence of Gartley pattern should be:
Potential reversal or buying zone: $ 0.2184 to $ 0.1994
Fibonacci projection or sell zone: $0.2333 to $0.2694
Stop Loss:
The potential reversal zone area that is up to $ 0.1994 can be used as stop loss in case of complete candlestick closes below this level.
Possible profit and loss ratio:
As per above targets this trade has a profit possibility of 35% and as per the above-mentioned stop loss, the loss possibility is 8.7%.
Note: Above idea is for educational purpose only. It is advised to diversify and strictly follow the stop loss, and don't get stuck with trade.


BATUSDT moving close to breakout!BATUSDT is currently moving inside symmetrical triangle and is at the point of breaking out where volume took an upswing. I would buy in the green box where my first sell target is around 27 cents.

BAT/USDT Fundamental & technical AnalysisWhat Is a 🌟Basic Attention (BAT) 🌟Token?
BAT is short for Basic Attention Token; it is a digital advertising token which is built on the Ethereum blockchain. The purpose of the BAT token is to create an ad exchange marketplace which will connect the advertisers, publishers, and users in a decentralized manner.
The Basic Attention Token (BAT) was created by the co-founder of Mozilla and Firefox, Brendan Eich, in an effort to improve the security, fairness, and efficiency of digital advertising through the use of blockchain technology. It is the native token of the Brave web browser and is built on top of Ethereum. BAT's white paper is dated January 7, 2018. As of 2020, the project is still being developed, although a beta version of the Brave browser is available for download.
As blockchain and digital currencies continue to proliferate, companies have sought new ways to apply this innovative technology to older problems and issues, such as web browsing and web-based advertising.
BAT Token Value
According to its white paper, the Basic Attention Token launch aimed to raise a total of $24 million USD. According to Coincodex, "The Basic Attention Token reached its highest price on January 9, 2018, when it was trading at its all-time high of $ 0.999568. It has a circulating supply of 1.36 billion BAT with a total supply of 1.50 billion BAT."
The exchange rate for BAT is set at 6,400 BAT per ETH, meaning that as the price of Ethereum climbs or falls, the price of BAT will be adjusted proportionally as well.
-------------------------------------------------------------------------------------
❇️Quick Technical analysis
currently by rising of the ethereum marketcap , this coin also faced a sharp rise, and now we can consider this coin as a good investment opportunity technically,it's trading within bullish run and possibly looking to grow more by more . Looking on last weekly candle shows that ,it proceed the trend after a short breather.
And considering the volumes of Huge purchases that have been made in the price range of $ 0.18 to $ 0.27, the possibility of heavy correction is low.
-------------------------------------------------------------------------------------
👉This analysis is my personal opinion and you are responsible for your own trades or invests.
❤️with Best Regards and successful trades.
