Apple - The next major push higher!🍎Apple ( NASDAQ:AAPL ) will head for new highs:
🔎Analysis summary :
Apple has been underperforming markets for a couple of months lately. However technicals still remain very bullish, indicating an inherent and substantial move higher soon. All we need now is bullish confirmation and proper risk management and this setup looks very decent.
📝Levels to watch:
$200, $300
🙏🏻#LONGTERMVISION
Philip - Swing Trader
AAPDB trade ideas

AAAPL: Updated Outlook and Best Level to BUY/HOLD 70% gains________________________________________
Apple Outlook: July 2025–Q1 2026
After peaking near $200 in late May, Apple (AAPL) remains under correction territory despite pockets of resilience, closing July around $193. The current correction is projected to persist until Q1 2026, as global macro and policy headwinds weigh on the broader tech sector. Technicals suggest AAPL could find its cycle low between Q3 and Q4 2025, potentially setting the stage for a renewed bull run into late 2026. Pullback until 170/175 USD. 📉
Catalysts Shaping Apple’s Stock Price in 2025–26
1. AI Integration and Apple Intelligence
Strength: 9/10
The roll-out of on-device Apple Intelligence features—including an upgraded Siri, ChatGPT integrations, and generative AI tools—continues to build anticipation for a major iPhone upgrade supercycle. Initial adoption has been strong, but broader impact will hinge on Q4 developer and enterprise feedback. 🤖
2. Services Segment Growth
Strength: 8.5/10
Apple’s Services business (App Store, iCloud, Apple Music, AI-powered subscriptions) is projected to post double-digit growth into Q4 2025, with consensus revenue estimates at $25–27B for the quarter. Analysts see upside from new AI-driven service bundles, which could add $5–8B in annualized revenue by 2026. 💡
3. Gross Margin Expansion & Cost Efficiencies
Strength: 8/10
Apple’s gross margin is forecast to improve by up to 60 basis points in Q4 2025 as the product mix tilts toward higher-margin services, and as component costs ease. Operational efficiencies from supply-chain automation may further cushion profit margins amid macro uncertainty. 📊
4. iPhone 17 Product Cycle
Strength: 7.5/10
The iPhone 17 lineup—rumored to include advanced polymer batteries and potential foldable form factors—is expected to launch Q4 2025, giving Apple a competitive hardware edge versus Android rivals. Early channel checks point to pent-up demand, though upgrade rates may lag previous cycles due to consumer caution. 📱
5. Vision Pro & Hardware Diversification
Strength: 7/10
Next-gen Vision Pro headsets and new AR/VR devices, boosted by Apple Intelligence, are expected to drive incremental growth in Q4 2025. However, high price points and limited mainstream adoption keep near-term impact contained. 🥽
6. Share Buybacks & Dividend Policy
Strength: 7/10
Apple’s $110B share buyback authorization and steady dividend growth provide valuation support, but recent market volatility has prompted a more cautious pace of repurchases. Yield-seeking investors are watching closely for any pivot in capital return policy if macro pressures persist. 💵
7. Supply Chain & Trade Policy Risks
Strength: 6.5/10
Escalating U.S.–China trade tensions—including the risk of expanded tariffs or tech export bans—remain a top concern. Apple is accelerating its assembly shift toward India and Vietnam to diversify risk, but any new policy shocks in Q4 could hit margins and unit volumes. 🌏
8. Regulatory & Antitrust Pressures
Strength: 6/10
The EU’s Digital Markets Act and potential U.S. antitrust probes could force Apple to further open up its iOS ecosystem by year-end, potentially capping Services revenue growth and adding compliance costs. ⚖️
9. Macro & Interest-Rate Environment
Strength: 5/10
With the Fed signaling “higher for longer” rates through mid-2026, tech sector valuations remain under pressure. Analysts see this limiting multiple expansion even if EPS growth resumes in late 2025. 📈
10. Smartphone Market Competition
Strength: 5/10
Aggressive pricing and innovation from Samsung and Chinese OEMs are intensifying competitive pressures, especially in emerging markets. Apple’s share gains are likely to slow until the macro environment improves and new hardware cycles fully materialize. 🥊
________________________________________
Analyst Projections for Q4 2025:
• Consensus Revenue: $108–112B (up ~4% YoY)
• EPS Estimate: $2.30–$2.42
• Gross Margin: 45–46%
• iPhone Unit Growth: 2–3%
• Services Revenue: $25–27B
Morgan Stanley and JP Morgan maintain “Overweight” ratings, but expect rangebound performance until macro and trade uncertainty clears. Most price targets for Q4 2025 hover between $195–$215, with upside potential post-correction into 2026. 📊
________________________________________
Analyst / Firm Date Rating Price Target (USD)
Barclays 06/24/2025 – 173 ()
Jefferies (E. Lee) 07/01/2025 Hold (Upgraded) 188.32
UBS (D. Vogt) 07/03/2025 – 210.00
J.P. Morgan (S. Chatterjee) 06/26/2025 Overweight 230.00
Morgan Stanley (E. Woodring) 03/12/2025 Overweight 252.00
Evercore ISI 01/31/2025 – 260.00
Redburn Partners 01/31/2025 – 230.00
D.A. Davidson (G. Luria) 05/02/2025 – 250.00
TradingView Consensus (avg) – Consensus 228.98
TipRanks Consensus (avg over 3mo) – Consensus 226.36

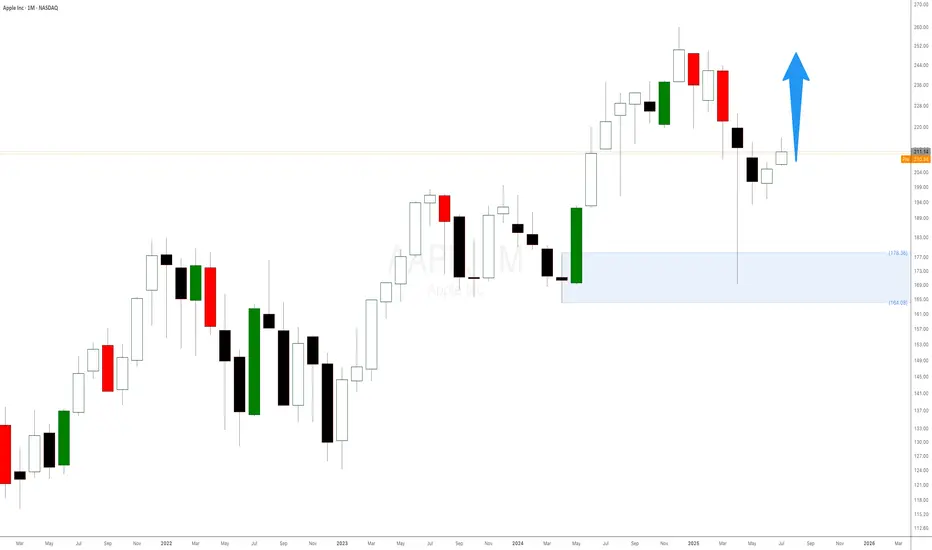
Apple Stock Is Surging! Here’s What Most People MissWhen it comes to trading, we don’t care about the latest news headlines or whether some analyst has upgraded or downgraded Apple stock. We focus on one thing and one thing only: the undeniable forces of supply and demand imbalances on higher timeframes.
Right now, Apple’s monthly chart is a textbook example of how waiting for a strong demand imbalance pays off. That $178 monthly level is no random number. It’s the exact origin of a massive bullish impulse that happened in June 2024 — the kind of move that only happens when smart money and big institutions step in, creating an imbalance that pushes the price away rapidly.
📈 It’s Not About Fundamentals. It’s About Imbalances.
Most retail traders waste time chasing news, earnings, or rumours about iPhone sales. But if you think about it, all those factors are already priced in once a strong imbalance is formed. Institutions don’t wait for tomorrow’s news — they plan their positions weeks or months ahead, and those footprints are visible right on your chart.
The $178 level indicates a significant drop in supply and a surge in demand large enough to propel Apple higher, marked by consecutive large bullish candlesticks. That’s our signal — nothing more, nothing less.
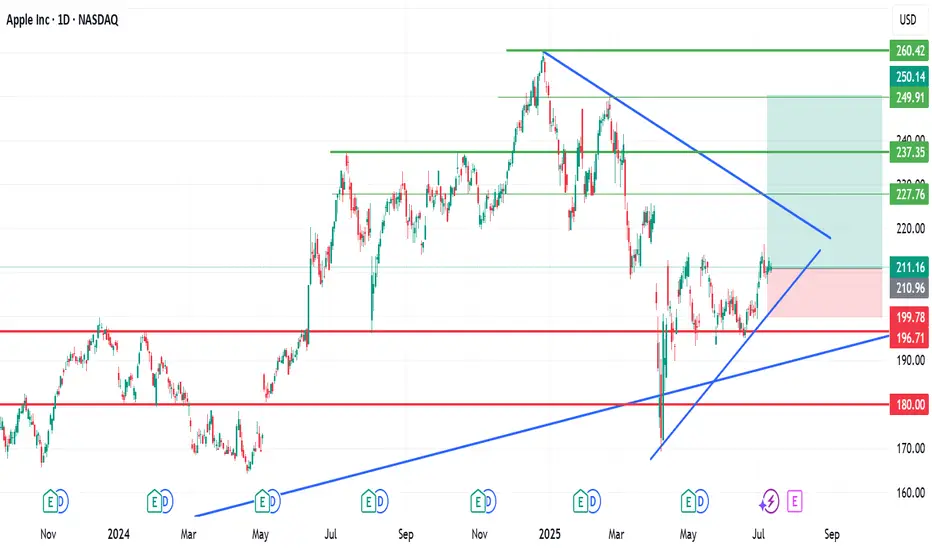
Time to buy? Too much negative press. Buy in Fear- Updated 7/7Apple has faced prolonged downward pressure from bearish investors. Despite its best efforts and some dips, the stock has steadily maintained a baseline price of 200 USD. The flag pattern required some adjustments along its path to break out, primarily due to geopolitical issues and economic variables. Ultimately, Apple broke out to the upside in the week of June 30th, as predicted in my earlier posts. This breakout resulted from end-of-Q2/H1 sell pressure, delivering a 7.56% gain or 15 USD. This is a very bullish sign for Apple, and with the tailwinds forming for September product releases, we can expect further gains as traders return and volume increases.
If Apple follows its historical profit trajectory (see pink line), we could see a new all-time high (ATH) in the region of 270 USD in September. The green resistance and support levels are highlighted, and I may use these to adjust my position, considering whether to short or go long once confirmation is established on the daily timeframe.
Apple has significantly underperformed compared to the other Magnificent 7 stocks, but I don’t believe it’s a company you should bet against in the current climate. With a slow rollout of AI and recent statements from Apple, they may not always be first to market, but they generally execute well. The remarks regarding Sony, Samsung, and Netflix by Apple were very revealing and demonstrate a solid long-term strategy. However, there may be some bumps along the way as they work toward their goals, potentially involving acquisitions.
The fear spread in the media is similar to the FUD (fear, uncertainty, doubt) often associated with Bitcoin, and this is typically a good time to buy. Remember the saying: if retail investors miss the boat, it’s gone, but if institutions miss it, they often bring the boat back.
While this is not financial advice, based on the green weekly candle, it's hard not to pay attention, and Apple may now have a very positive year ahead! Especially with the weakening dollar and reports stating that this will benefit them greatly.
My large long position is still intact, and my target price will depend on how we manage supports and resistances. I am looking to take profits at over 260 USD.

Time to buy? Too much negative press. Buy in Fear- Updated 13/7Apple has faced prolonged downward pressure from bearish investors. Despite its best efforts and some dips, the stock has steadily maintained a baseline price of 200 USD. The flag pattern required some adjustments along its path to break out, primarily due to geopolitical issues and economic variables. Ultimately, Apple broke out to the upside in the week of June 30th, as predicted in my earlier posts. This breakout resulted from end-of-Q2/H1 sell pressure, delivering a 7.56% gain or 15 USD. This is a very bullish sign for Apple, and with the tailwinds forming for September product releases, we can expect further gains as traders return and volume increases.
If Apple follows its historical profit trajectory (see pink line), we could see a new all-time high (ATH) in the region of 270 USD in September. The green resistance and support levels are highlighted, and I may use these to adjust my position, considering whether to short or go long once confirmation is established on the daily timeframe.
Apple has significantly underperformed compared to the other Magnificent 7 stocks, but I don’t believe it’s a company you should bet against in the current climate. With a slow rollout of AI and recent statements from Apple, they may not always be first to market, but they generally execute well. The remarks regarding Sony, Samsung, and Netflix by Apple were very revealing and demonstrate a solid long-term strategy. However, there may be some bumps along the way as they work toward their goals, potentially involving acquisitions.
The fear spread in the media is similar to the FUD (fear, uncertainty, doubt) often associated with Bitcoin, and this is typically a good time to buy. Remember the saying: if retail investors miss the boat, it’s gone, but if institutions miss it, they often bring the boat back.
While this is not financial advice, based on the green weekly candle, it's hard not to pay attention, and Apple may now have a very positive year ahead! Especially with the weakening dollar and reports stating that this will benefit them greatly.
Apple has continued to trend along its predicted trajectory, and with the exception of economic headwinds driving the price down, this trend is expected to continue. Strong support has been observed at 210 USD, with further support at $208.50, providing solid technical support for potential upside while reducing the risk of a downturn below $208. However, a short correction could occur if overall market confidence is shaken due to new policies. Nevertheless, Apple has demonstrated resilience to new tariffs, and its underperformance compared to other tech giants indicates plenty of upside potential. The target price remains set at over $260.
My large long position is still intact, and my target price will depend on how we manage supports and resistances. I am looking to take profits at over 260 USD.

$AAPL: Multi-Cycles At PlayResearch Notes
Documenting New Interconnections
Wave properties:
3rd frame of reference
Multi-Cycles
Fibs of broader cycle
Using coordinates of the recent established cycles for predictive/guiding properties:

$AAPL: Breaking Down Broader Cycle via FibsPublishing separately a specific interconnection type mentioned in idea below:
Testing this particular way of mapping the multi-scale cycles:

AAPL: The Rally Might Not Be OverWhile many tech giants have already reached new all-time highs, Apple is still lagging behind — NASDAQ:AAPL hasn’t yet broken out. This may represent both a risk and an opportunity for latecomers.
Investor caution remains due to potential tariffs on Apple products from China, with the decision now postponed until August.
This uncertainty may be holding the price back, but could also lead to a strong accumulation phase if no negative headlines emerge in the near term.
Technicals:
• A breakout above $215 could open the way toward $249 (previous high).
• Support at $197 remains strong.
• Stochastic is in overbought, but MACD confirms bullish momentum.
NASDAQ:AAPL may start catching up with the broader market — especially if tariff fears subside. Watch closely for a confirmed breakout above $215.

$AAPL | Smart Money Concepts Weekly DSS Update Apple ( NASDAQ:AAPL ) is approaching a critical decision zone on the weekly SMC structure, where liquidity, volume, and macro pressure converge.
🔎 Key Observations (WaverVanir DSS):
🔺 Premium Zone (240–260) acting as a weak high with multiple CHoCH & BOS confirmations
🔻 Major equilibrium level at ~$181 aligns with EMA 200 & potential downside sweep
📈 Projected upside target: $301.52, contingent on reclaiming premium zone
📉 Breakdown watch: If $211 fails, next liquidity pockets sit between $181 and $120
⚙️ Volume Profile shows divergence—price rally on declining volume = possible distribution pattern.
🌐 Catalysts to Monitor:
Q3 earnings (E icon on chart)
China iPhone demand
US macro (Fed policy, CPI, yield curve shifts)
🧠 DSS Probability Bias:
Neutral to Slight Bullish (17/25 score)
→ Expect volatility with directional bias forming post-premium test.
📊 Trade Management:
Wait for confirmation above $260 for continuation
Or short-term bearish setups if price stalls below EMA cluster (~$213)
🧠 Posted by WaverVanir DSS | Quant x Macro x Liquidity Driven
#AAPL #SmartMoney #TradingView #MarketStructure #VolumeProfile #LiquidityZones #QuantAnalysis #WaverVanir #AppleStock #MacroTrading #OptionsFlow #TradingSignals #RiskManagement

AAPL needs to break above 213 to start an upward moveAAPL needs to break above 213 to start an upward move
From our previous analysis, the price increased by almost +8% from 200 to 216.
The resistance zone, which was also our first target, stopped the price near 213.50, but again the bullish volume seems to be high and there is a good chance that AAPL will continue to rise further.
A clear move above 212.5 should push AAPL higher to 224.50; 240 and 257.
You may find more details in the chart!
Thank you and Good Luck!
PS: Please support with a like or comment if you find this analysis useful for your trading day
Previous analysis:

AAPL – Long Bias SetupWhy I’m Watching the Long Side:
✅ Clean Bounce from $190 Zone
That \$190–195 level has held multiple times since April. Last two dips got scooped with solid demand = solid base forming.
✅ Break of Recent Lower Highs
Stock finally pushed through prior resistance around $205–208. Structure shift. Possible start of a trend reversal.
✅ Buy Signal Triggered (Green "4")
Chart printed a buy signal near lows with follow-through = momentum may be shifting.
✅ Holding Above Short-Term Moving Level
Price is now holding above the short-term EMA (teal line), showing trend momentum flipping bullish.
✅ Vol Picking Up
Volume on the green days has increased, signaling interest from bigger players.
---
Trade Plan:
• Entry Zone: \$208–211
• TP1: $220 (near previous supply)
• TP2: $230 (gap fill zone)
• TP3: $250
• SL: Just below $204 = exit
---
⚠️ Caution:
Still under red resistance band ($220). Needs real strength to reclaim it.
Watch how price reacts there – could stall or squeeze.
📅 Next earnings 3 weeks out. Could build up into it.
---
💬 Setup looks constructive. Playing the reversal with tight risk. Not chasing, just reacting. Trade your plan.

AAPL BUY 1st target $223AAPL is forming a wedge and been lagging for 2 years. I was expecting $182 but we never saw that level, after weeks of $200 range consolidation it's clear this is basing, first target of resistance is $223 then we could be off to the races. I would expect to see this as soon as next week provided #donthecon can stop bullying American companies long enough to focus on important things

How Sell Side Institutions Move Price: BuybacksThere are Buy Side Institutions, aka Dark Pools, and there are Sell Side Institutions, the Money Center Banks and Giant Financial Services companies. These two groups dominate the market activity and move price in entirely different ways and for entirely different reasons.
Sell Side Institutions are short-term TRADERS. They are not allowed, nor do they wish, to hold stocks for the long term. The Sell Side trades stocks and has the most experienced, most talented, and most sophisticated floor traders in the world.
Buy Side Dark Pools have floor traders as well but they are strictly long-term investment companies managing the 401ks, pension funds, ETF long-term investments on behalf of the Middle Class of America and, in some instances, other nations.
Sell Side Institutions may buy a stock and hold for a few weeks or months but strictly for the short-term profits.
The Sell Side are also the Banks of Record who do the BUYBACKS on behalf of the Corporation which has made the decision by the Corporation's Board of Directors to do a buyback program, which tend to last many months or longer. Corporations do not have stock traders on staff. So the Bank of Record does the actual buying of the shares of stock.
The reasons for doing a Buyback:
To lower the outstanding shares which can create some momentum runs during high buying demand from retail groups and other investors.
Buybacks are intended to move price UPWARD in runs. The price range is established by the corporation. The runs are created by the Bank of Record.
Buybacks also increase dividend yields for long term investors, including pension fund investors.
NASDAQ:AAPL has a mega buyback that was approved in May but has just started now.
Buybacks can be a great strategy for trading stocks this year as many corporations will be doing buybacks due to the reduction of their taxes and more benefits to corporations.
Now is the time to start watching for buyback runs.

I am bullish on Apple (AAPL)I am bullish on Apple (AAPL)
Looking at my cahrt, you will seen my thoughts.
$237, $237 and $260 are my medium and long-term buy targets.
Trade with care as pullbacks are possible along the journey nortward.
Like, follow, share and comment
AAPL can we hit 260?
Appears we are making a correction down to the levels of 208 then if that does not hold 205 with a possible drive up to the 260.
Question is are we going drive deeper with the correction ?
Be Careful folks this is a wild one
Trade Smarter Live Better
Kris/Mindbloome Exchange

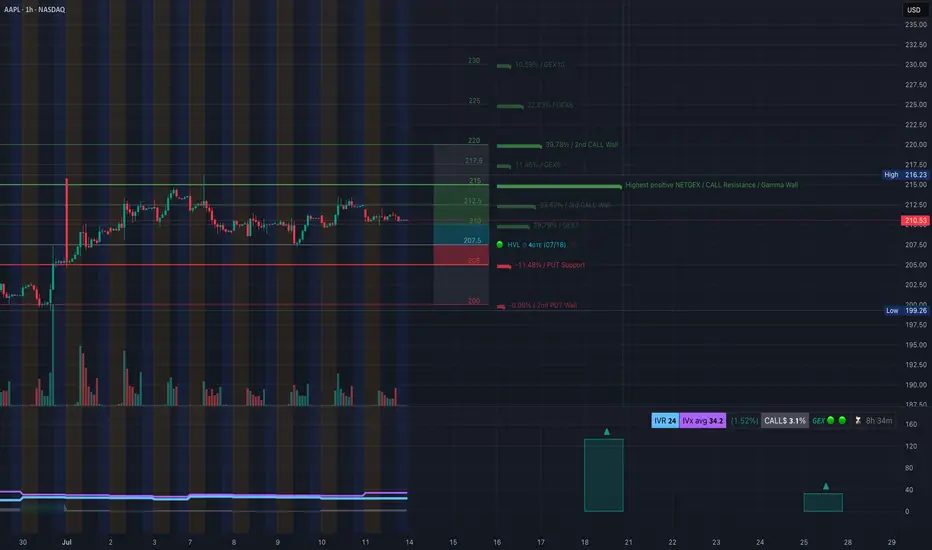
AAPL at a Pivotal Zone! TA for July 14AAPL at a Pivotal Zone! GEX & Price Action Align for Major Move 📉📈
🧠 GEX Sentiment (Options-Based Insight)
* Current Price: $210.53
* GEX Zone Traps:
* Below Price:
* 🟥 Put Support at $205 (-11.48%)
* 🔻 PUT Wall at $200 (-9.06%) — strong floor
* Above Price:
* 🟩 CALL Walls at:
* $212.5 → 29.79% GEX7
* $215 → 38.62% GEX6 (3rd largest resistance)
* $217.5 → 11.45% GEX9
* $220 → 39.78% GEX2 (heavy resistance zone)
* 🟩 Max GEX Cluster: $215–$220
* 🔺GEX10 spike at $230 → unlikely unless squeeze
* IVR/IVX:
* IVR: 24 (low volatility environment)
* IVX: 34.2 → Soft volatility bounce
* Call/Put Flow:
* Calls: 3.1% favored
* GEX trend: 🌕🌕🌕 (Neutral-to-Bullish if over $212.5)
📦 Interpretation:
Gamma compression is strong near $212.5–$215. If AAPL stays above $210.5 and reclaims $212.5, options market opens up space toward $217.5–$220. Below $207.5 = risk of drop toward $205 then $200 PUT wall.
🕹️ Option Trade Ideas Based on GEX
Bullish Strategy (IF Breaks $212.5):
* Trade: Buy AAPL 215c or 217.5c (Jul 19 or 26 expiry)
* Trigger: Hold above $212.5
* Target: $217.5–$220
* Stop: Break below $209.8
Bearish Strategy (IF Breaks $207.5):
* Trade: Buy AAPL 205p or 200p (Jul 19 or 26 expiry)
* Trigger: Loss of $207.5 with momentum
* Target: $205 → $200
* Stop: Reclaim of $210.5
🔍 1-Hour Chart Analysis (Price Action)
* Structure: Sideways consolidation between $207.5–$213.5
* Key Levels:
* Demand: $205–$207.5 (Buyers defended)
* CHoCH (Change of Character) confirmed near $209.8
* Resistance: $213.48 (rejected multiple times)
* Trendline: Rising wedge forming under liquidity sweep zone
* Liquidity Pools: Resting above $215 and below $205
* FVG/OB Zones: Thin FVG at $209.8–210.5 and mid OB around $207
📈 Scenario 1 (Bullish):
* If price bounces off $210 again and breaks $212.5 with volume, watch for sweep of $215–$217.5
* Watch for re-entry above CHoCH/BOS confluence near $211.5
📉 Scenario 2 (Bearish):
* If we break $207.5 and fail to reclaim $210.5 → liquidity vacuum opens toward $205 and $200
✅ My Thoughts & Suggestions
* Direction Bias: Neutral > Bullish if $212.5 is claimed, otherwise range-bound.
* Best Risk/Reward: Wait for $212.5 breakout confirmation OR $207.5 breakdown.
* Scalpers: Use $210.5–212.5 as chop zone — fade edges.
* Swing Traders: Only enter on clear breakouts with stop discipline.
🔒 Disclaimer:
This analysis is for educational purposes only and does not constitute financial advice. Always do your own research and manage your risk before trading.
Quick View: $AAPL- Great Crossover on the Daily chart with the ema9 and 21 that are moving above the ema50
- Consolidation area on the Hourly.

Aapl long ideaNASDAQ:AAPL is on trendline support from March 2020 and has made a nice reversal. It looks good for a swing trade through August or September.

AAPL - Another Possible BreakoutsHello Everyone,
Apple AAPL is the another possible breakouts in my list.
Good entry point could be 205-206 , Re-test point.
228-230 is target price for me , which is approx %10 above from 205-206.
I tried to draw possible price action on Graphs.
Same as I mentioned in GOOG , Apple is Apple and you can get it in every price point for long term.
But short term you can watch the these price points that i mentioned to get some gain.
This is just my thinking and it is not invesment suggestion , please do not make any decision with my anaylsis.
Have a lovely Sunday and good start a Week

AAPL Options Sentiment (GEX) – Gamma Exposure Analysis* Gamma Wall / Call Resistance is forming between 213.55 – 216.23, aligning with major GEX levels (GEX7/8) and 2nd/3rd Call Walls. That area is a potential profit-taking zone or rejection spot for bulls if tested again.
* High Volume Level (HVL) at 202.5 is marked with strong support (from the green tag), meaning sellers must break below that level with force for a bearish continuation.
* Below that, we have layered PUT support walls at 200 and 195, reinforcing 198–202 as a major demand zone.
* Current IVR: 27.6, IVx avg: 31.4 — fairly low, suggesting neutral-to-slightly-bearish premium pricing.
* PUTs 3% weighted dominance also implies defensive positioning, but not aggressively bearish.
🔍 Options Insight:
If price stays under 213 and fails to reclaim 212.55–213.55 zone, the bias is toward a grind back toward 205–202.5.
Watch for volatility around July 11 expiration — if 202.5 fails, 200 strike puts may surge.
📈 Potential Options Trade Setup:
* Bearish setup (if rejection confirmed below 213):
* Entry: Near 212.5
* Target: 202.5
* PUT: July 12 or 19 $205P or $202.5P
* Bullish recovery scenario:
* Entry: Above 213.55 with strength
* Target: 216+
* CALL: July 12 $215C for short-term squeeze play
AAPL 1-Hour Chart – Price Action & Structure
* Break of Structure (BOS) occurred above 212.55 but was not sustained.
* Price is now pulling back from the mid-supply zone (purple box) and is attempting to hold above 209 support.
* Trendline support broken, and now retesting from below — suggesting a weakening trend unless 213 is reclaimed quickly.
* Major support at 199.26 aligns with a previous CHoCH zone, forming a clean demand zone.
* Volume is fading slightly on this decline, but there’s no strong absorption yet.
🧠 Intraday Bias Suggestion:
If AAPL can't reclaim 212.5–213 on bounce, the market may pull toward the HVL zone (205–202.5).
However, if we get a reclaim of 213.5 with volume, the trendline flip becomes bullish again — target 215–216.
Summary Recommendations
* For Options Traders:
* Favor PUT debit spreads or single directional PUTs if price stays below 212.5.
* Avoid naked CALLs until a break above 213.5 confirms strength.
* IV is low — good time to buy premium, not sell it.
* For Stock Traders (Intraday or Swing):
* Consider shorting pops into 213 with stop above 215.
* Look for long entries near 202.5–200 with tight stops if structure holds.
This analysis is for educational purposes only and does not constitute financial advice. Always do your own research and manage risk carefully.

Apple UpdateThe way this pattern has been moving is very indicative of a B wave. It has been complex and very choppy. Needless to say, I have removed the lower target box from the chart and believe we should be headed to the upper larger target box from here. It appears, to my eyes, that price is within the micro-wave 3 of (c) of B. Once B completes, price should be headed to the $150-$110 area to complete minor wave C. This won't happen overnight but will take time. Be patient as these things can take a while.

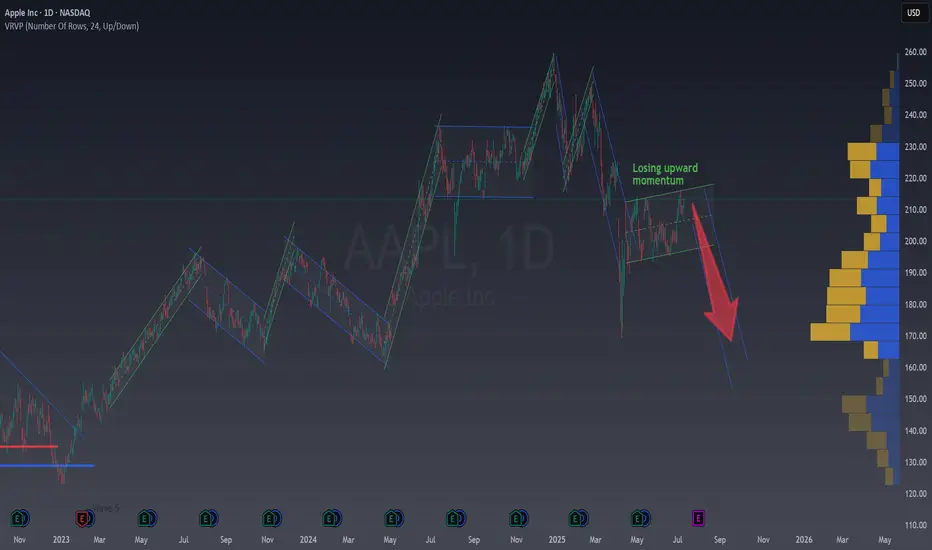
Apple in 2025: Why the Bulls Are Losing SteamApple’s stock has clearly lost its bullish momentum this year, and the chart you shared sums it up perfectly.
Let’s break down what’s happening and why investors are shifting focus to companies like Nvidia and Microsoft.
Chart Says :
Weak Rebounds (green), Bearish Pressure (blue channels are now more agresive)
Downtrend Channels: The chart shows Apple forming lower highs and lower lows, bouncing inside downward channels (not real channels, but are very ilustrative of how the price is moving trendy or not in each direction).
Each recovery (green) is weaker than the last, and the most recent upward move is still capped by resistance.
Bearish Patterns : The price action is dominated by failed breakouts and new descending channels, signaling that sellers are in control.
Volume & Participation: There’s no strong buying volume to support a real reversal. This makes any rally fragile and prone to quick pullbacks.
Why Is the Market Doubting Apple?
Slowing Growth : Apple’s revenue growth has stalled, especially in China, where sales dropped 13% year-over-year. The latest iPhone launch was underwhelming, and services aren't growing fast enough to offset weak hardware sales.
Falling Behind in AI: While Nvidia and Microsoft are leading the AI revolution, Apple is seen as late to the party. Their recent AI announcements disappointed investors looking for bold innovation.
External Pressures: New tariffs and global tensions are hitting Apple harder than its peers, since more than 60% of its sales are international.
Analyst Downgrades: Several analysts have lowered their price targets and ratings, reflecting concerns about Apple’s future growth. We've recently seen someanalyst showing prices under $200.
Key Takeaway
Apple is struggling to regain its former strength. The chart shows persistent bearishness, and the fundamentals back it up: slow growth, weak innovation, and external risks. Meanwhile, Nvidia and Microsoft are capturing investor attention with explosive growth and leadership in AI.
Until Apple delivers a real catalyst, the path of least resistance remains down or sideways, not up.
Do you think apple can surprise with some new AI innovation unexpected for all of us?
Breaking out!The price breaks through the purple resistance and is preparing to start an upward movement.
A compression triangle formation is taking shape, with the lows resting on the underlying purple trendline.
At $203.3, the weekly 100-period simple moving average (SMA100, green line) is located. A close above this level would be an important confirmation of the bullish reversal.
