Apple: More Room to RunWe still allow more room for Apple’s magenta wave (B) to extend upward before wave (C) takes over, pulling the stock toward the low of green wave . Thereafter, green wave should start (above $168) and initiate the next advance, lifting the stock toward resistance at $260.10. A break below $168, however, would activate our alternative scenario, in which blue wave alt.(IV) targets a deeper low (32% probability).
📈 Over 190 precise analyses, clear entry points, and defined Target Zones - that's what we do.
AAPDB trade ideas

$AAPL Long Setup – Range Breakout Potential with Tight RiskApple ( NASDAQ:AAPL ) is finally showing signs of strength after a prolonged sideways range. Price is attempting to break above the Ichimoku Cloud on the daily chart while MACD is starting to curve upward—indicating a potential shift in momentum. After holding the $190–$200 zone as support for months, this move above $200 could trigger a short-term breakout toward the $220–$226 levels.
The current setup has a clean structure with a 4.27 risk/reward ratio:
Entry: $200.30
Stop: $195.07 (below recent range lows)
Target: $222.61 (prior high + pivot cluster)
If this move holds, it could mark the start of a trend reversal in Apple following months of chop. Solid setup for a 2–4 week swing trade or as part of a core position rebuild.
Let me know if you're playing this one or waiting for confirmation above $208.

Light at the end of the Tunnel for AAPLI have been tracking this pattern that NASDAQ:AAPL started forming in April for some time now.
This is a classic symmetrical triangle formation with significant consolidation in the last trading sessions. This patterns typically lead to a breakout in either direction, and since price is near the apex, a breakout is imminent within 1–3 trading sessions.
Current Price: $201.60 (slightly above the key $201 support/resistance zone).
Key Support: $198.62 (recent higher low).
Major Support: $189.10 (multi-month low).
Resistance Zone: $202.30 (pre-market), then $210.45 (EMA 200/50 convergence).
EMA 50/200 Cross: Both EMAs are converging at ~$210.45, which has become a significant resistance ceiling.
Typically, this is bearish when price is below both 50 and 200 EMA. However, the MACD and RSI indicators both support an imminent bullish move forming with an increase in volume.
With headwinds from antitrust issues in the EU and U.S. I wont be surprised if this breaks out significantly upwards with some positive news acting as the catalyst.
The conservative trader will place a straddle aiming for $210.45 (EMA resistance) upside and but $192–194 (prior demand zone) downside.
The riskier and probably more rewarding bet would be to place a call aiming for the $218-$224 resistance zone after this breaks $202.30


Apple's (AAPL) 2009 Long-Term Trendline BounceTechnicals:
After a daily a-b-c to long-term horizontal trendline support, when we zoom out, we can see Apple's 2009 Long-Term Trendline Bounce.
Monthly Chart:

APPLE: Short Trade with Entry/SL/TP
APPLE
- Classic bearish formation
- Our team expects pullback
SUGGESTED TRADE:
Swing Trade
Short APPLE
Entry - 213.58
Sl - 217.99
Tp - 204.49
Our Risk - 1%
Start protection of your profits from lower levels
Disclosure: I am part of Trade Nation's Influencer program and receive a monthly fee for using their TradingView charts in my analysis.
❤️ Please, support our work with like & comment! ❤️

Update on the markets 7/7/2025SPY is at support after a down day, I expect a bit of a bounce overnight, but maybe not. USOIL is looking better, as Well as GOld. NG not really going anywhere yet. BTC still looks like it will drop.

Apple Is Climbing the Fibonacci Channel Ladder – Step 5 Ahead?On the monthly chart, Apple (AAPL) is steadily moving within a well-defined ascending Fibonacci channel, like climbing a ladder — step by step.
The price is currently testing Step 4 , a zone that has acted as a strong resistance barrier.
Despite the pressure here, the structure still appears bullish, and even a minor pullback might simply be a pause before the next move.
If momentum picks up, we could soon see a breakout toward the next step — targeting 234 at Step 5.
The trend remains technically intact unless the channel is broken, and the overall formation still leans toward continuation.

APPLE Massive Short! SELL!
My dear friends,
Please, find my technical outlook for APPLE below:
The instrument tests an important psychological level 213.58
Bias - Bearish
Technical Indicators: Supper Trend gives a precise Bearish signal, while Pivot Point HL predicts price changes and potential reversals in the market.
Target - 208.03
About Used Indicators:
Super-trend indicator is more useful in trending markets where there are clear uptrends and downtrends in price.
Disclosure: I am part of Trade Nation's Influencer program and receive a monthly fee for using their TradingView charts in my analysis.
———————————
WISH YOU ALL LUCK

AAPL ShortWe can observe that price has recently rallied into a higher timeframe premium zone, which acts as a potential supply area where institutional traders may look to offload positions. The reaction from this zone aligns with the idea that aggressive buying into premium areas can attract counter-order flow.
After this strong impulsive move upward, price tapped into the higher timeframe sell zone and appears to be rejecting it, forming a short-term shift in momentum. The marked arrow suggests a potential short scenario, targeting a reversion to the nearby inefficiency and resting liquidity just below the recent breakout structure.
The green highlighted area shows a logical draw on liquidity where sell-side liquidity may be resting. This is where price is expected to seek out stop orders from late buyers who entered at the top.
Liquidity Perspective:
Notice how previous swing lows and highs provide clear liquidity pools for price to manipulate. Price behavior around these levels often indicates the intention of larger players to grab liquidity before moving in the opposite direction.
Risk Management:
As always, traders should manage risk appropriately by defining clear invalidation levels and never risking more than a small percentage of their capital per trade. Proper risk-to-reward planning ensures sustainability and discipline when executing this strategy.

Compounders: 5 Simple Rules to Build Long-Term WealthImagine this:
…it’s 18 years ago. The very first iPhone has just hit the market.
Meanwhile, Nokia’s legendary “Snake” game, once the height of mobile fun, was starting to feel… dated.
⚡ And you can sense it: something big is coming. You don’t know exactly what, but something is about to shake the system.
So, you invest €1,000 into Apple stock. No fancy moves, no day trading. You don’t check the price every morning, you don’t sell at the first dip. You just hold and go about your life, using their products as always.
----------------------------------
Fast forward to today: the iPhone has evolved quite a bit, and so has your bank account, “a bit”.
That modest €1,000 investment would now be worth roughly €70,000. For context, if you had simply invested in the S&P 500 instead, your total profit would be €3,300.
This is what happens when you hold a real compounder. Apple: +6,942%. S&P 500: +334%. Time doesn’t just pass, it compounds!
Big difference, right?
And the craziest part? You didn’t need a crystal ball. Looking back, everything makes perfect sense.
The real question is:
Can you spot the next one before it becomes obvious?
---------------------------------------
📈 Compounders: The slow, steady, and surprisingly effective path to wealth
A compounder is a company that steadily grows your investment over time, powered by a strong business model and consistent value creation.
These stocks don’t need to chase headlines. They don’t create drama, and they certainly don’t swing wildly every week on the stock exchange. They simply keep building value.
Strong financials, good products, and a clear direction—like a snowball quietly rolling downhill, gathering momentum with every meter.
As Warren Buffett once said:
That’s exactly what compounders allow you to do. While you rest, they keep working.
It’s definitely not a get-rich-quick strategy. It’s more like a slow, somewhat boring, and failry a “safer” route. But in return, it might just give you something far more valuable than fast gains: financial peace of mind, and perhaps even financial freedom.
🔍 So how do you spot one?
Now, let’s be clear: compounders are not bulletproof. Market crashes, disruptive competitors, and economic shocks can still shake them.But when the foundation is solid, these companies tend to stand strong, even in a storm.
Here are five key traits that define a true compounder. From consistent growth to an unshakable competitive edge.
---------------------------------------
📈 1. Steady Growth
What you want to see is a steady upward trend in both revenue and earnings per share (EPS). Not a rollercoaster. A clean, reliable trend.
A strong compounder doesn’t explode one year and crash the next. It grows year after year. It grows calmly, consistently, and predictably…
Microsoft EPS Q Source: TradingView
That’s usually a sign of solid management and sticky customer demand.
Let’s look at a key metric here:
EPS CAGR (5-year) – the compound annual growth rate of earnings per share.
5% = solid → reliable and steady progress
10% = good → suggests a strong business model and real market demand
15%+ = great → this is where the snowball effect really kicks in, fast and orderly
📌 The higher the CAGR, the faster your investment compounds. But it’s not just about speed, it’s about repeatability. If that growth is not random but repeatable and sustainable, you don’t just have a growth stock → you’ve got a true compounder.
⚠️ Always consider the sector: A 15% CAGR might be normal in tech, but in a consumer brand or industrial company, that’s an exceptionally strong result.
---------------------------------------
💡 2. Efficient Capital Allocation
A good compounder doesn’t just grow a lot—it grows wisely.
That means every dollar the company reinvests into its business generates more than a dollar in return.
Think of it like a business where every $1 invested turns into $1.20 or more in profit. The more efficiently it can put capital to work, the faster it compounds over time.
🎯 ROIC (Return on Invested Capital) tells you how effectively a company is using all its invested capital—including both equity and debt.
ROIC shows how much profit the company earns after taxes and costs for every dollar it has invested, regardless of where that money came from.It’s broader than ROE, which only considers shareholder equity.
>10% = solid
>15% = good
>20% = great
🎯 ROE (Return on Equity) measures how well the company generates returns specifically on shareholder money:
>15% = solid
>20% = good
>25% = great
📌 In most cases, ROIC is more important than ROE , since it doesn’t get distorted by how much debt the company is using. But when both numbers are high, you’ve got something that creates a lot of value - a true compounding engine.
Just imagine you give a chef $10 to make a dish. If they can turn that into a $15 meal, their ROIC is 50%. That’s the kind of capital efficiency we want to see in companies too, where every dollar invested pulls serious weight.
---------------------------------------
💰 3. High Profit Margins
Selling stuff isn’t hard. Any company can sell something, even at a loss.
A true compounder doesn’t just generate revenue, it earns real profit from it.
That’s where operating margins come into play. They show how much money is actually left over after covering everything: salaries, logistics, rent, office coffee, stolen toilet paper, and all the other lovely overhead costs.
⚙️ Operating Margin – the percentage of revenue that turns into operating profit:
10% = solid → stable profitability, usually driven by volume or efficiency
20%+ = great → often signals strong pricing power, lean cost structure, or a dominant brand
📌 Why does this matter?
Because the more profit a company retains after expenses, the more it can:
- reinvest in new products or markets
- pay dividends to shareholders
- or buy back shares (which automatically increases your ownership per share)
All of these create real, recurring value for you as an investor—not just once, but year after year.
⚠️ One important note: What qualifies as a “high” margin depends on the industry. A software company might easily run at 30% margins, while a retail chain or car manufacturer might be thrilled with 5%.
So don’t judge the number in isolation. Always consider the type of business—in some sectors, profits come from volume, not margin.
---------------------------------------
🧱 4. Debt Matters
Even if a company is growing fast and making money, it still doesn’t qualify as a true compounder if it’s drowning in debt.
A real compounder moves forward mostly(!) under its own power, not thanks to borrowed money.
Financially strong companies have a healthy buffer, so they’re not in trouble the moment the economy slows down or credit tightens.
📉 Debt-to-Equity (D/E) – how much of the company is financed with debt versus equity:
Under 1 = solid → reasonable leverage
Under 0.5 = great → very strong and conservative balance sheet
📈 Interest Coverage Ratio – how easily the company can pay its interest expenses:
5× = solid
10×+ = great → very safe, meaning debt costs won’t threaten profitability
📌 The lower the debt and the higher the buffer, the lower the risk.A company with a strong balance sheet doesn’t need to refinance debt in a panic or rely on costly tricks to survive downturns.
Think of it like the foundation of a house. Without it, even the most beautiful structure can collapse.
⚠️ Some industries (like real estate or utilities) naturally operate with higher debt levels. But even in those cases, you want to see a business that controls its debt, rather than living “one day at a time.”
---------------------------------------
🏰 5. Durable Competitive Advantage (a.k.a. Moat)
Back in the Middle Ages, a moat was a water-filled trench that protected a castle.Today, in investing, a “moat” is what protects great businesses from competition.
It’s a business that others can’t easily reach or replicate.
💪 When a company has a wide moat, it can:
- Defend its market share even when others try to attack
- Command higher prices—because customers stay loyal
- And if a competitor starts gaining ground, it often has enough capital to... just buy them out
Here are some classic moat types with examples:
- Brand Loyalty – People pay more for something familiarExample: Coca-Cola. There are hundreds of alternatives, but the taste, logo, and brand feel... irreplaceable.
- Network Effects – Every new user strengthens the product or platformExample: Visa, Mastercard. The more they’re used, the harder it is for any new player to break in.
- Technological Edge – The company is simply too far aheadExample: Nvidia, ASML. You can throw money at the problem, but patents and experience aren’t things you copy overnight.
- Ecosystem Lock-in / Habitual Consumption – Customers get “stuck,” and switching feels like a hassleExample: Apple. Once you have the iPhone, AirPods, and MacBook… switching to Android just sounds like a lot of work.Or take Procter & Gamble. If your baby’s used to Pampers, you’re not going back to cloth diapers anytime soon. (To be fair—Huggies might actually be better 😄 That’s Kimberly-Clark, ticker KMB.)
📌 A strong moat allows a company to maintain both profitability and growth for the next 10+ years—because no one else can get close enough to steal it.It’s not fighting tooth and nail for every dollar. It rules its niche quietly and efficiently.
---------------------------------------
Now that we’ve covered what makes a business a compounder, the next question naturally follows:
“Okay, but if it’s such a great company... is it still a great price?”
That’s where valuation comes in.P/E ratio: how to know whether you’re paying a fair price or just a premium for the brand.
---------------------------------------
👉 In my April article, I clearly broke down P/E along with eight other key fundamental metrics: straightforward, real-world explanations designed to help you actually use them…
---------------------------------------
💵 P/E (Price-to-Earnings Ratio)
The P/E ratio tells you how much you’re paying for every $1 of a company’s earnings.
Think of it like this: are you buying solid value for $20… or paying $70 just because the brand sounds familiar?
Now, for compounders, a high P/E (say, 25–40) can actually be fine, IF(!) the company is growing fast and has a strong moat.
Here’s a quick cheat sheet:
* Under 15 → generally cheap (might be a bargain… or a trap)
* 15–25 → fair price for a traditional business
* 25–35 → reasonable if the company is growing consistently
* 35–45 → starting to look expensive, must be justified by fundamentals
* 45+ → expensive, and the market expects big things. One slip-up and the stock could drop fast.
⚠️ A P/E over 40–45 means the market expects strong, sustainable growth.If that growth doesn’t show up, the stock won’t just stumble—it could crash.
But here’s the key: P/E doesn’t work well in isolation. Context is everything.
Before judging the number, always ask:
- What sector is this company in?
- What’s the sector average?
- How fast is the company growing?
- Are the profits stable and sustainable?
---------------------------------------
Real-World Examples:
✅ Visa – P/E around 37The average for financial stocks? Usually 10–15.But Visa grows quickly, is highly profitable, and has an ironclad moat.Is it expensive? Yes. But in this case, justifiably so.
✅ Microsoft – P/E around 35Tech-sector average tends to sit between 25–35.Microsoft has consistent growth, high margins, and clear market leadership.A P/E of 35 is absolutely reasonable—as long as the growth story continues.
🤔 But what if Microsoft trades at P/E 50+?
Then you have to ask:Is earnings growth truly supporting that price?Or are you just paying for the brand... and a bit of FOMO?
-----------------
Leave a comment:
What’s the highest P/E you’ve ever paid, and was it worth it?
-----------------
📘 Compounder Cheat Sheet
Don’t just stare at absolute numbers. Always compare within the sector, consider the company’s growth pace and business model. Ask yourself:
“How much am I paying today for what this company will earn tomorrow?”
---------------------------------------
🧩 Summary
Compounders are like good wine, they get better with time.
Find companies that grow steadily, generate profits, keep debt low, and dominate their niche. Hold tight. Stay patient. Let the snowball roll.
Thanks for reading!
If this article was helpful or resonated with you, feel free to like, comment, or share it with a friend! It motivates me more than you’d think. 🙏
And if you’re new here:
🍷 Like good wine, this channel only gets better with time. Follow and let the ideas compound slowly, steadily, and deliciously.
Cheers
Vaido

Yes AAPL has been trash. Yes AAPL will short term pumpThere is no world in which you can look at this aapl/spy chart and not identify that this isn't a GREAT risk/reward entry. You're telling me AAPL won't at least retest the 200 DMA this year?? You're telling me it's not worth it for a leap long as it's sitting at range lows??
Easiest money play I've seen in a minute.

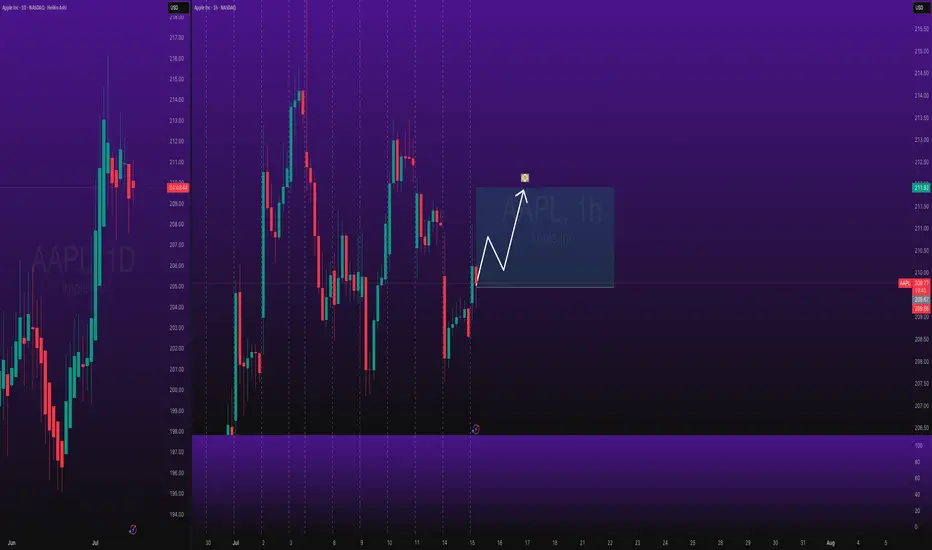
AAPL Gamma Says Buy the Dip! Smart Money Prepping a Move?🧠 GEX Options Insight
Apple is sitting right above the highest positive GEX and gamma support zone at $208–210, backed by strong CALL walls and net positive gamma flows.
* Call walls stacked at 208, 210, and 212.5 – strong signs of bullish pressure.
* Positive NETGEX reinforces 208–210 as a potential bounce zone.
* IVR low at 25.1 suggests cheap options – favoring long CALL entries here.
👉 Trade idea (option strategy):
Buy $210 CALLs for this week or next week, targeting a breakout above 212.5. Risk is minimal if price holds above 205.
📊 Intraday Trading Setup (1H Price Action)
From the second image, we can see AAPL just completed a ChoCH (Change of Character) and is consolidating right above the last BOS (Break of Structure).
* Holding a bullish order block (OB) just under 209.
* Formed a tight consolidation under the 212.5 resistance.
* Momentum still bullish, volume cooling off (healthy).
🧠 My Thoughts
Price is respecting the 208.92–209 zone as a base, with a low-volume pullback. If the market holds, this is a textbook bullish continuation. Keep an eye on:
* Break and hold above 210 → targets 212.5, 215.78
* Break below 208.5 with volume → invalidate, possible dip to 205 or 202.5
✅ Action Plan
* CALL Entry: 208.5–209 zone
* Targets: 212.5, 215.8
* Stop: Below 205
* Confirmation: Break OB + candle close above 210
Disclaimer: This analysis is for educational purposes only. Trade at your own risk.

Stocks SPOT ACCOUNT: APPLE stocks Buy Trade with Take ProfitStocks SPOT ACCOUNT:
MARKETSCOM:APPLE stocks my buy trade with take profit.
This is my SPOT Accounts for Stocks Portfolio.
Trade shows my Buying and Take Profit Level.
Spot account doesn't need SL because its stocks buying account.
Looks good Trade.
Disclaimer: only idea, not advice
AAPL PREPARING FOR A LARGER MOVEAAPL clearly shows a descending channel pattern, marked by two parallel downward-sloping yellow trendlines. Within that broader structure, the price is currently consolidating in a narrow range between two horizontal yellow lines:
Resistance around $210.98
Support around $207.46
🔍 Current Technical Setup
Consolidation Range
AAPL is moving sideways in a tight range between $207.46 and $210.98. This narrow trading zone within a broader descending channel is typical of compression before a breakout.
Descending Channel Context
The channel suggests a longer-term downtrend bias, but the compression at these levels can lead to a breakout in either direction, especially when volume starts to increase.
Support Zone ($207.46)
This level has been tested and held, making it a key line to watch. A breakdown below this support would likely trigger a sharper selloff toward the lower channel boundary, near $203–$204.
Resistance Zone ($210.98)
This level lines up with the upper boundary of the current consolidation and the midline of the descending channel. A breakout above would invalidate the local downtrend and could send price to test the top of the channel (~$214+).
Volume Clues
Volume is relatively low during this sideways movement, which often precedes a high-volume breakout as indecision resolves.
📈 Scenarios to Watch
Bullish Breakout
Above $210.98 and the descending trendline.
Likely target: $214–$216
Confirmation: Volume spike + strong bullish candle
Bearish Breakdown
Below $207.46 support.
Target: $203 or lower, testing channel support.
Confirmation: Increasing red volume + bearish momentum
🧠 Summary
AAPL is in a compressed state, with a tight horizontal range forming inside a broader downward-sloping channel. This often sets the stage for a powerful directional move. Traders should closely monitor breaks of $210.98 or $207.46 to catch the next leg — either a reversal toward higher levels or continuation of the downtrend.

APPLE Set To Fall! SELL!
My dear friends,
APPLE looks like it will make a good move, and here are the details:
The market is trading on 211.08 pivot level.
Bias - Bearish
Technical Indicators: Supper Trend generates a clear short signal while Pivot Point HL is currently determining the overall Bearish trend of the market.
Goal - 206.69
Recommended Stop Loss - 213.91
About Used Indicators:
Pivot points are a great way to identify areas of support and resistance, but they work best when combined with other kinds of technical analysis
Disclosure: I am part of Trade Nation's Influencer program and receive a monthly fee for using their TradingView charts in my analysis.
———————————
WISH YOU ALL LUCK
Crypto in July 2025: A Financial Reset from Macromics GroupThe world of cryptocurrencies in July 2025 is experiencing more than just another growth cycle — it’s undergoing a fundamental transformation of the global financial system. Amid geopolitical instability, tighter control over digital assets, and growing interest from institutional investors, digital currencies are once again in the spotlight. Macromics Group shares its latest analytical insights on the key events and trends.
A New Bull Run: Ethereum 3.0 and Bitcoin Network Upgrade
Since the start of summer 2025, Ethereum has shown strong growth, largely due to the launch of Ethereum 3.0, which reduced transaction fees and made the network more scalable. Bitcoin, in turn, has undergone another major security upgrade, attracting new institutional investors, including funds from Japan and Saudi Arabia.
CBDCs and Regulation: Governments Shift Approach
Central banks are actively rolling out central bank digital currencies (CBDCs). China, India, Brazil, and the EU have expanded pilot programs for their national digital currencies. This has led to increased interest in stablecoins backed by fiat currencies and greater demands for transparency on DeFi platforms.
Macromics Group helps clients navigate these new dynamics, offering up-to-date analytical resources and capital protection strategies across both regulated and unregulated sectors of the crypto market.
NFTs Make a Comeback — In the Corporate World
A new wave of interest in NFTs is emerging, not from artists, but from the corporate sector. Companies are using tokens for intellectual property, document verification, and digital rights management. Macromics Group is investing in startups building infrastructure for business-focused NFTs — a clear sign of the technology’s long-term potential.
AI + Blockchain: A Union of Future Technologies
In 2025, two mega-trends are converging: artificial intelligence and blockchain. AI-powered protocols are automating trading, cybersecurity, and even smart contract audits. Macromics Group is already implementing these technologies into its analytical tools and services.
What’s Next? Macromics Group Forecast
According to our data, the crypto market has entered a phase of "conscious growth" — where technology, regulation, and real-world utility are evolving in harmony. In the coming months, we anticipate increased attention toward:
DePIN projects (decentralized physical infrastructure)
Tokenized real-world assets (real estate, gold)
ESG-focused cryptocurrencies
Conclusion: Don’t Just Invest — Understand
Macromics Group urges investors to go beyond participation — to become informed decision-makers. We provide deep analytics, access to unique tools, and expert support at every stage of crypto investing. July 2025 is the perfect time to rethink your strategy and take a step into the future.
Macromics Group — your expert in the world of digital assets.
AAPL - Weekly HV/IV PerspectiveGood evening —
I wanted to do one more write up with that being on NASDAQ:AAPL as we enter the week with futures just opening.
HV10 (16.58%) is trending -11.56% below IV (28.14%) showing a weekly price gap differential of -$2.89 on the stated implied move to what trending markets are doing. This current IV value entering the week sits 69% within the sliding year spectrum.
Now, with Apple consolidating in range for almost eight weeks after selling off when it reached its 4T milestone in December of 2024, has now begun advancing back upwards in price. The strength here is obvious and the quality of company is well, Apple.
My price targets on the week is first the upper band of stated IV ($220.58) then moving on towards the upper implied range of HV63 ($225.87). I believe the markets are going to push apple higher while balancing the indices out selling off in other areas. This would start to accelerate HV10, as it is now 91.23% coiled to its yearly lows and needs to unwind. Hopefully with a few short-term trending days increasing we find our regression.
Please come back next week and see how our position and volatility progressed forward.

Ethereum Empowers Its Future Zero-Knowledge TechnologyThe Ethereum $2,969 Foundation has unveiled a new roadmap that aims to expand zero-knowledge (ZK) technologies across the network shortly after the ETH price surpassed the $3,000 threshold. This announcement aims to enhance scalability while concurrently reducing transaction fees and bolstering both security and privacy. The foundation has emphasized integrating ZK-based solutions into the primary layer to accelerate the user experience. This development marks a critical period that may prompt Layer 2 projects and entrepreneurs within the ecosystem to reconsider their competitive strategies.
Key Objectives of the Announced Zero-Knowledge Roadmap
Today, the Ethereum Foundation announced through its official channels that the primary goal is to institutionalize the “ZK-based verification” model at every network point. The plan envisions directing energy from intensive smart contracts towards more efficient cryptographic proofs to reduce transaction congestion. This approach aims to make the network accessible to larger audiences with lower-cost and faster approval processes.
The second focal point is to deepen the security layer. A foundation executive stated, “By integrating ZK technology into our network, we are not only enhancing privacy and security but also achieving significant improvements in transaction efficiency.” The objective is to establish a privacy standard rather than just performance. Within this framework, new technical collaborations and developer grants will be highlighted, with the priority being to develop toolsets and training programs that accelerate integration.
Potential Impacts of the Roadmap on the Layer-2 Ecosystem
The new roadmap closely concerns Layer 2 projects, which have long provided scalability with ZK Rollup solutions. Experts emphasize that local ZK integration could narrow the competition advantage of these projects but also lay the groundwork for stronger collaborations. Initiatives may need to update their architectural plans to reinforce compatibility with the main network.
As relevant actors seek different models to cover compliance costs, an environment is emerging that will open doors to new partnerships and grants. This process, paralleling Ethereum’s scalability goal, may direct the developer community within the network towards ZK-centered innovation. On the market side, the interest in ETH seems to be supported by expectations of increased security and privacy.

(Daytring) APPL quickly trade1. Premarket created a support line
2. Sma 200,50 is here
3. Price goes up in the moring just pull back to retest.
=> entry. Take profit whenever i feel good

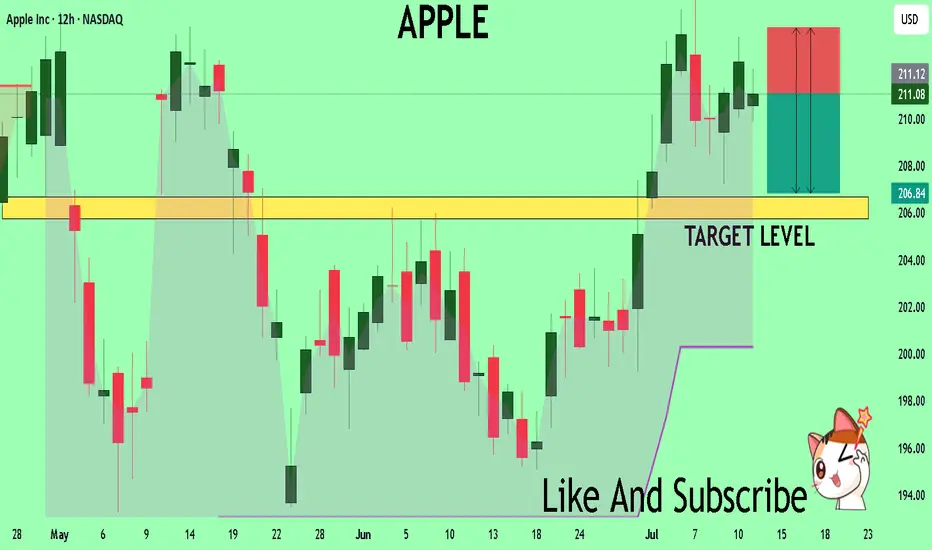
Apple May Dip to $203 FVG Before Resuming UptrendFenzoFx—AAPL (Apple) is bullish, testing the $210.0 resistance while Stochastic warns of an overbought market.
A dip to the bullish FVG at $203.0 is likely before the uptrend resumes.

Apple Stock in 10 years perspective: Stability or New Heights?The future of Apple stock remains a hot topic among investors and analysts. For today’s July, the company’s market capitalization has climbed to $3 trillion, up from $2.9 trillion (a year ago, on May 2024). But can this tech giant continue to deliver significant returns for shareholders over the next decade? Let’s take a quick look on it.
AI’s Take on the Future
Recently, ChatGPT highlighted Apple NASDAQ:AAPL as a top contender among stocks poised to generate substantial wealth by 2035, outranking peers like Microsoft NASDAQ:MSFT , Amazon NASDAQ:AMZN , and Nvidia NASDAQ:NVDA . The prediction has sparked curiosity, but what do real-world experts think?
Analyst Perspectives: Strengths and Challenges
Opinions on Apple’s outlook vary. On one hand, the company boasts a robust financial foundation, steady revenue from subscriptions, and substantial cash reserves. On the other hand, some analysts argue that its current share price is overstretched. Apple’s forward P/E ratio—based on projected earnings for the next 12 months—stands at 27, compared to the S&P 500’s near 22, suggesting investors are paying a premium for future growth.
Additionally, Apple faces mounting competition and regulatory pressures. The key question is whether it can maintain its edge in a fast-evolving tech industry.
Services and Devices
In recent years, Apple has leaned heavily into services like subscriptions and digital platforms, delivering high-margin and recurring revenue. Yet, its core business still hinges on device sales, particularly the well-known iPhone. Without groundbreaking new products, the company risks getting stuck in a cycle of incremental updates, potentially slowing its growth trajectory.
Financial Resilience
Despite these challenges, Apple’s financial metrics remain impressive. Its market cap has risen to $3 trillion, and it continues to generate significant free cash flow. The company also offers modest dividends, making it attractive for those people, who prefer and seek stable returns.
What to Expect from Apple by 2035?
Apple stands as one of the most dependable long-term investments, but we shouldn’t expect the explosive growth, just like it was at their early years. Of course iconic brand, loyal customer base, and adaptability— is a strong side and support its stability. But the high share price, competitive pressures, and reliance on certain hardware components may limit and slow down its upside.
Can Apple make you wealthy by 2035? It depends on your goals, risk tolerance and the size of your investment. For those seeking stability and modest gains, Apple is a solid pick. But if you’re chasing rapid wealth, you might need to look elsewhere for higher-risk opportunities.

Apple: Next Week’s Long Trade Opportunity with Upside PotentialCurrent Price: $213.55
Direction: LONG
Targets:
- T1 = $225
- T2 = $240
Stop Levels:
- S1 = $210
- S2 = $200
**Wisdom of Professional Traders:**
This analysis synthesizes insights from thousands of professional traders and market experts, leveraging collective intelligence to identify high-probability trade setups. The wisdom of crowds principle suggests that aggregated market perspectives from experienced professionals often outperform individual forecasts, reducing cognitive biases and highlighting consensus opportunities in Apple.
**Key Insights:**
Apple continues to lead the technology sector with sustained bullish momentum. Strong seasonal trends averaging 13.4% gains during July and August further underscore its upside potential. AI-driven product developments and its role in mega-cap leadership positions it for ongoing strength, though near-term overextension risks persist.
**Recent Performance:**
Apple gained 6% last week, spotlighting its dominance among mega-cap stocks as a leader of the broader tech rally. While the "Magnificent 7" stocks, including Nvidia and Tesla, showed mixed signals, Apple has preserved relative strength and upward momentum.
**Expert Analysis:**
Portfolio managers have expressed confidence in Apple as part of the "big three" tech stocks, favoring its innovation and operational strategies despite valuation concerns. The mixed sentiment, with mentions of potential put activity, suggests cautious optimism, but its breakout above $213 highlights stronger short-term opportunities.
**News Impact:**
Apple’s AI initiatives, such as outsourcing Siri's development, contribute positively to market sentiment. Additionally, anticipation of earnings season strength in late July adds weight to bullish strategies. As mega-cap stocks maintain leadership, Apple’s pivot into AI-driven innovation reinforces its critical role in technological advancement.
**Trading Recommendation:**
Based on robust performance trends, seasonal advantages, and a supportive macro backdrop, a LONG position on Apple offers strong upside potential with defined risk parameters.
