$AAPL yieaahhhoh dear NASDAQ:AAPL why do you do this to us on earnings week.
Beautiful setup.
1. Setting support on the parallel channel since breakout from back in June.
2. Confluent with the 61% fib retracement measured from same breakout from June.
3. Daily RSI at oversold point.
4. Daily MACD giving us turning hopes.
We want this to get back to the mid point on the trendline, depending on timing we can look at 240 to 250.
All this can get nullified with a bad earnings report and get down to $195 area.
Make or break on earnings. Yieaahhh
AAPLB trade ideas

AAPL Next weak outlook and trade ideaPrice blasted through the Centerline.
The Medianlines framework and rules say, that we should expect a poullback to it.
This would be gift to take another short from there, if we find a trigger.
AAPL's on the my list.

AAPL near its 200 Day SMARecent sell-off in AAPL has pushed the price below 20-Day, 50-Day and 100-Day and near to the 200 Day SMA which is at 216 $. If we look at the Upward channel for the APPL share price when the price fell below 200 Day SMA then it consolidates for a few weeks. With earnings next Thursday watch out for more volatility in the prices. If it closes below 216 then the next stop is 187 $.

aaple long apple recently got sold off from its china sales and now is at a level from august 2024. With earning coming . it will be a great long from here. as it is at a strong support and risk: reward to upside is low

APPL Short Intraday+SwingAPPL Short trade idea, positions already taken off, only leaving a runner. Two positions in two different directions but technical analysis supports both ideas. NASDAQ and ES will play a role on which of these will play out first.

Apple: As Expected…Apple has made progress as part of our primary scenario, gradually edging lower toward our magenta Target Zone between $209.57 and $196.05. In this price range, we anticipate the low of the magenta wave (2) and, subsequently, a reversal to the upside. On the other hand, we consider it 37% (previously 40%) likely that AAPL will stage an immediate breakout above the resistance at $260.10 without first reaching our Target Zone.

AAPL, Long, 8h
entry: Current Market Price
take profit : 230
stop loss: 218
AAPL has rejected a strong key support level at 222.30, showing bullish momentum. A rebound toward the resistance level at 230 is expected.
BUY 🚀
✅ Like and subscribe to never miss a new analysis!

APPLE REBOUND AHEAD|LONG|
✅APPLE is set to retest a
Strong support level below at 220.00$
After trading in a local downtrend from some time
Which makes a bullish rebound a likely scenario
With the target being a local resistance above at 226.35$
LONG🚀
✅Like and subscribe to never miss a new idea!✅

APPLE: Strong buy on oversold technicals.APPLE turned oversold on the 1D technical outlook (RSI = 31.524, MACD = -4.390, ADX = 40.988) as it hit the S1 level and got just $8 away from the 1W MA50. The latter is intact since May 2024 and is the core support level of the 2.5 year Channel Up. Apart from hitting the S1 level, the 1W RSI is entering the S1 Zone and the first bounce after a HH has been a strong buy signal inside this Channel Up (resembles October 23rd 2023 and June 13th 2022 lows). We are bullish (TP = 255.00) expecting an immediate reversal.
Once this breaks, we espect a rally of similar proportions to November (TP = 5.500).
See how our prior idea has worked out:
## If you like our free content follow our profile to get more daily ideas. ##
## Comments and likes are greatly appreciated. ##

Apple, where will it go? 25.01.23Hello, this is Greedy All-Day.
Today’s analysis focuses on APPLE.
Apple’s Current Situation
Chart:
Apple has entered a corrective phase after reaching a high following previous analysis.
While the NASDAQ continues to aim for new highs, Apple is showing signs of correction. Why is this happening?
Looking at the blue box zone, we can see that Apple broke below the ascending trendline on the daily chart, entering the orange supply zone.
Let’s analyze what could happen next and identify the key levels.
A Similar Past Pattern
Chart:
Chart:
Apple’s current chart has similarities to its past performance.
The top chart represents the current trend, while the bottom chart is from July 2021.
In both cases:
An ascending triangle pattern appeared on the daily chart and broke out.
After reaching the target, a correction occurred, marked by a break below the daily trendline.
Historical Perspective
Chart:
In July 2021, Apple retraced below the starting point of the pattern but eventually rebounded after testing support.
If history repeats itself, a similar retracement could occur in the current chart.
Further Correction Expected
Chart:
Based on historical patterns, Apple could experience an additional correction of approximately 12%.
The starting point of the pattern, around $196, marks a potential target for this retracement.
Apple’s Current Position
Chart:
While Apple has shown a slight rebound from the November 4, 2024, low, the rebound around $219 hasn’t been strong enough to suggest a clear recovery.
Given the steep downward slope, there’s a high probability of a continued decline toward the $195 level, which marks the pattern’s starting point.
Buyer’s Perspective
Chart:
For buyers, the best-case scenario is a sideways consolidation followed by a breakout above the resistance trendline.
The blue box resistance at $237.5 is now a major hurdle:
A breakout above $237.5 would provide a positive signal for buyers, encouraging new entries or averaging down existing positions.
Failure to break this level would likely result in further downside, potentially dragging Apple to $195.
For new buyers:
Wait for the price to enter the green box zone for a better entry.
If the price drops into the green box and breaks below it sharply, hold off and wait for further confirmation before entering.
Conclusion
The current sentiment for Apple is bearish, and this may only be the beginning of its correction.
Key Levels to Watch:
$237.5: A breakout would signal a potential trend reversal.
$195: A likely target for further downside in the ongoing correction.
For now, patience and caution are advised, as Apple’s correction may still have room to play out.

$AAPL Bounce Setup: Key Levels to Watch & 2-1-2u Reversal PotentThis is a strong setup for NASDAQ:AAPL to bounce as it held its 200-day EMA again today. Above $225, watch for targets at $227, $228.22, and the bearish gap fill at $230. Keep NASDAQ:AAPL on watch for a potential 2-1-2u reversal here.
However, if it loses support at $219.79, expect a possible retest of $216.39. Keep an eye on these levels, fam.

Swing long appleDaily RSI reached 30
Volume spike previous day
Expecting weekly candle to touch 4 weekly MA
Expecting daily gap fill
Support at yesterday's low
Counter-arguments
No daily bullish divergence spotted

AAPL WOW Nice Bounce off $220AAPL WOW Nice Bounce off $220 AAPL WOW Nice Bounce off $220AAPL WOW Nice Bounce off $220AAPL WOW Nice Bounce off $220AAPL WOW Nice Bounce off $220AAPL WOW Nice Bounce off $220

Apple Stretched Too FarNow that's a heck of a stretch.
Price has reached the U-MLH of the white Pitchfork and is nearing the yellow Center-Line.
What's it mean?
White U-MLH = Upper Extreme
Yellow CL = Price got back to balance, in the context of the yellow path/traction.
All this means, that the Air get's very, very thin!
Waiting for a short Signal with a target back to the white CL (Center-Line).

AAPL is a BUY at $217 and $214AAPL is getting oversold here but not quite a buy yet. I would buy under $219 and add. We have strong support at $217, $214 and $195. It wont see $195 on this stent without a strong bouncey bounce. Once we hit $217 target for snoop bouncey bounce is $231 and $237. Trade against my advice at your own peril

Apple - The Path For 2025 Is Clear!Apple ( NASDAQ:AAPL ) is reversing towards the downside
Click chart above to see the detailed analysis👆🏻
Over the past couple of months Apple rallied more than +50% without showing any weakness on the smaller timeframes. Some profit taking is totally expected and with market structure perfectly aligning, this could develop into a significant correction.
Levels to watch: $250, $200
Keep your long term vision,
Philip (BasicTrading)

Retracement phase till April 2025 and then??? who knows...Offcourse the chart is self explanatory.
on daily timeframe where it touches the 200 SMA.
It means that the long term downtrend is gonna start.
Still a big no.... it has to touch the monthly resistance around 200 area.
Dear Traders, Go away and check for another mind.
as investor I already took my position at 240. Will take more position around 200 price.
Let's analyse it again in April-May 2025.

Apple (AAPL) Breaking Below Bullish Channel?Chart Analysis:
Apple's stock price has broken below a long-standing ascending channel, signaling a potential shift in its bullish structure.
1️⃣ Ascending Channel (Green Shaded Area):
Price has decisively broken below the lower boundary of the channel.
This breakdown suggests increasing bearish pressure, especially as the price approaches key support levels.
2️⃣ Moving Averages:
50-day SMA (blue): Positioned at $239.23, now acting as immediate resistance.
200-day SMA (red): Rising at $217.27, providing potential dynamic support.
3️⃣ Momentum Indicators:
RSI: At 28.27, indicating oversold conditions, which could lead to a short-term bounce.
MACD: Bearish momentum persists, with the MACD line trending below the signal line in negative territory.
What to Watch:
Reactions near the 200-day SMA, as a bounce from this level could halt further declines.
If bearish momentum continues, further downside towards $210-$215 is possible.
A recovery above the 50-day SMA is needed to negate the bearish breakdown and restore confidence in the uptrend.
Apple's break below the ascending channel warrants caution, but oversold conditions and proximity to key support levels could spark short-term volatility.
-MW

Dead cat bounce for AAPLThe three black crows is visible on the weekly interval for NASDAQ:AAPL
We may see a dead cat bounce this week and for price to fade from the bearish weekly fair value gap (238.96). Ultimate target is at 219.47 or close to this level.
There's not a whole of data this week so we may rely on macro events or some earnings data that may induce some volatility to the market.

AAPL: Sell idea: PullbackOn AAPL as you can see on the chart we have a pullback on vwap indicator and also on the resistance line so it's mean that we would have a big probability to have a downtrend.

AAPL Reversal Bull Run (65% ODD)Given the downward speed and fear of the sellers, AAPL could be reversal anytime from now. Buying (DCA) and hold in this level could be profitable. Next target 250$.

APPL - Short Term Bear - Swing Trade ContinuationHere's the details of my trade Short on AAPL....
I previously shorted APPL for a trade from $255 to $244. Unfortunately I did not fully maximise my profit. If you watch the video I explain where I missed a signal that could have allowed me to gain more profit. Nonetheless, I made a profit! So let's celebrate that. The original pattern and trade is still in tact and therefore this video explains the continuation pattern I am currently trading.
Daily Chart:
- QQE Signal Short
- Divergence on the RSI
- Cross down on the MACD
4hr Chart:
- QQE Signal Short
- Strong Divergence on the RSI
- Cross down on the MACD
Fundamental Support:
- PE Ratio overvalued at 40, historic PE ratio range 12-28 excl Covid 2020
- Buffet has cut Berkshire Hathaways stake in Apple by 60%
- 2 consecutive years of flat YoY revenue, with declines in Iphone, Wearables, Ipad, Mac offset by YoY growth in Services
- Flat YoY Revenue in USA, Asia Pac, and Japan, with declines in Greater China
- 2 consecutive years of YoY Net Income decline, EPS benefit from share buybacks of 1B since 2022
- Operating Margin improvement, however primarily driven by product mix (decline of core products and growth of services business)
Previous Developments & News
- Next significant economic data is ADP employment report Wed Jan 8th and Unemployment Rate Fri Jan 10th
- A lower or higher employment figure than forecast could move the market and is a potential risk to the short position if employment figures are positive
- However, inadvertently, higher employment figures will reduce the likelihood of FED rate cuts, offsetting some of the upside potential
This was commentary I put in previously....what ended up happening? The unemployment report on Friday ended up being way above forecast 255k vs 155k forecast. Sending treasury yields higher and the market lower. This is in line with my comment about higher employment figures, although it may sound rosey, it's further reducing the likelihood of the FED reducing rates and increase the possibility of higher inflation. The market does not like that
Target:
- Previous ATH at 236, if it breaks this level than there's opp to move down thru 232, to as low as 221
- Stop: A break above $244
- Possible profit taking at 50 day moving average near $237-$238 range
- Previous declines ranged from 8-15 days to reach short term lows, estimating similar timeframe with a possible break of support line, retest, and further decline
Risks:
- The rollout of Apple Intelligence sparks strong Christmas sales and upgrade cycle for Iphone 16
- Investor optimism for Apple Intelligence drives continued buying in AAPL
- A bounce off support and continued move higher
Overall:
AAPL has rolled out Apple Intelligence in several major markets with some features still coming soon. It would be an understatement to say that the development, features, and rollout have be clumsy at best. Not only has the rollout and announcements been underwhelming, but Apple looks to be playing catchup with technology competitors have already well established in the market.
Apple continues to be a loved brand worldwide, and there's no denying the brand loyalty is still strong, however lagging technology, premium prices on their products, high PE/valuation with flat to declining revenue and profitability. Until Apple can either reclaim it's technological advantage by becoming a leader again in the market, or reposition it's product offering and pricing to drive demand, it's difficult fundamentally see why the stock is worth the PE with so many other companies in market with new innovation and growth potential comparatively.
This isn't to suggest Apple will collapse, but a correction technically and fundamentally is warranted near term with broader economic risks and technological missed expectations that could warrant lower prices.
My Position:
3 Put Options
$235 Strike, Current Price $242
Expiration Friday Jan 17th
Average Price is $1.30 a contract
Investment $400
Target $3.00-$10.00
Stop $.65
Potential Loss -$200
Potential Gain $400-$2600
The reason for the wide target range is because if APPL breaks through the 50 Day MA and the previous ATH, that is very bearish and although it may retest that level, it could create quite a fall and I would look to maximise my trade at that point.

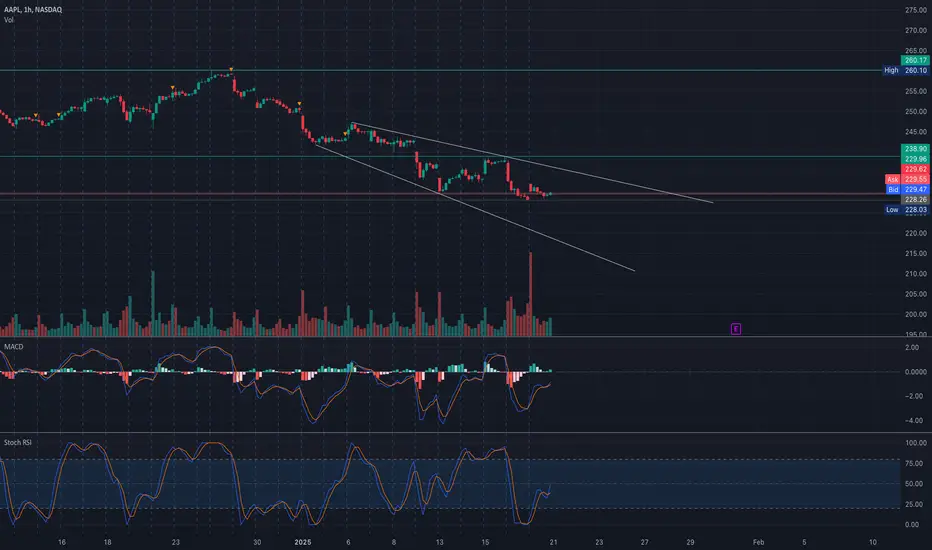
Apple Approaching Key Support! Will AAPL Rebound or Break Down?Analysis:
AAPL is trading within a descending wedge pattern, suggesting consolidation. The price is currently testing a critical support zone near $228, with a breakdown possibly leading to further downside. MACD shows a bearish momentum, while the Stochastic RSI indicates the stock is nearing oversold territory, potentially setting up a bounce.
Key Levels to Watch:
* Resistance: $235, $242, $250
* Support: $227, $225, $220
Trade Scenarios:
1. Bullish Scenario:
* Entry near $228–$227 support.
* Target: $235, $240.
* Stop-loss: Below $225.
2. Bearish Scenario:
* Short entry below $227.
* Target: $225, $220.
* Stop-loss: Above $230.
GEX Option Insights:
* Highest Positive GEX Resistance: $235, aligning with a significant call wall.
* PUT Wall Support: $227 and $225, indicating hedging activity at these levels.
* IVR: 50.2, suggesting moderate volatility.
* Directional Bias: Neutral to bearish unless the price reclaims $235.
Disclaimer:
This analysis is for educational purposes only and does not constitute financial advice. Always do your own research and trade responsibly.
Option Strategies
Bullish Strategy (Rebound from Support):
* Setup:
* Trade: Buy a call spread.
* Strike Prices: Buy the $230 Call and sell the $235 Call.
* Rationale: If AAPL rebounds off the $227–$228 support zone, it may head toward the $235 resistance.
* Expiration: 1–2 weeks out to limit theta decay while capitalizing on a short-term move.
* Risk: Limited to the premium paid.
* Reward: Defined by the difference in strike prices minus the cost.
Bearish Strategy (Breakdown Below Support):
* Setup:
* Trade: Buy a put spread.
* Strike Prices: Buy the $227 Put and sell the $220 Put.
* Rationale: If AAPL breaks below the $227 support, it may test $225 and potentially $220.
* Expiration: 1–2 weeks to capture momentum-driven downside.
* Risk: Limited to the premium paid.
* Reward: Defined by the difference in strike prices minus the cost.
Neutral Strategy (Sideways Movement Near Support):
* Setup:
* Trade: Iron Condor.
* Strikes: Sell the $235 Call and $225 Put, Buy the $240 Call and $220 Put.
* Rationale: If AAPL consolidates between $227 and $235, the iron condor collects premium while maintaining limited risk.
* Expiration: Short-term (e.g., 1 week) to maximize theta decay.
* Risk: Defined and limited by the wings.
* Reward: Premium collected.
Important Notes
* Monitor price action near $227–$228 support and $235 resistance for breakout/breakdown confirmation.
* Adjust stop-loss levels dynamically based on intraday momentum.
* Always size trades appropriately to manage risk.