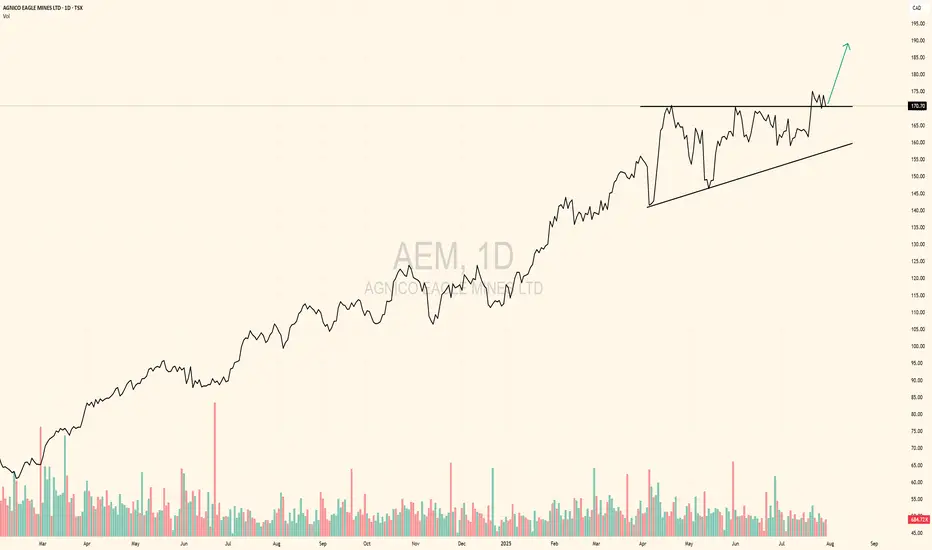
Lettuce hands will buy back at higher pricesAs the market capitulated on gold miners after FOMC, amazing earnings came out after the market closed.
Those sellers will fomo back in at higher prices.
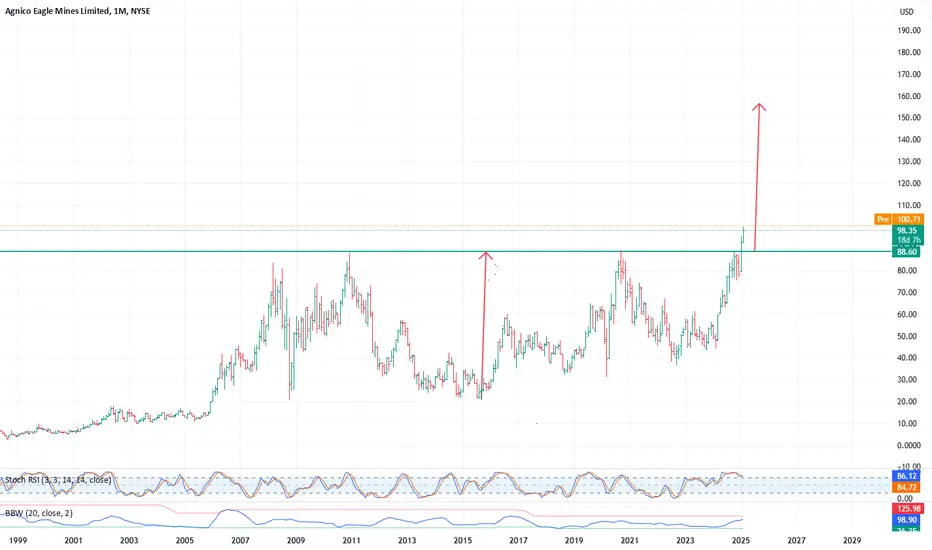
Ascending triangle breakout to commence.
AEMD trade ideas
AEM - Take Some ProfitsPrice is nearing the top of Bollinger Band resistance. The Band Width is decreasing, suggesting that price might regress to the moving average. I good time to sell call options.

Buy Agnico Eagle Mines LimitedShort Term Trading Advice by Naranj Capital
Buy Agnico Eagle Mines Limited
● Buy Range- 108.5 - 112
● Target- 116 - 118
● StopLoss- 104.5
● Potential Return- 4-5%
● Duration- 14-15 Trading Days
Buy Agnico Eagle Mines LimitedShort Term Trading Advice by Naranj Capital
Buy Agnico Eagle Mines Limited
● Buy Range- 116 - 119
● Target- 125 - 126
● StopLoss- 112
● Potential Return- 5-6%
● Duration- 14-15 Trading Days

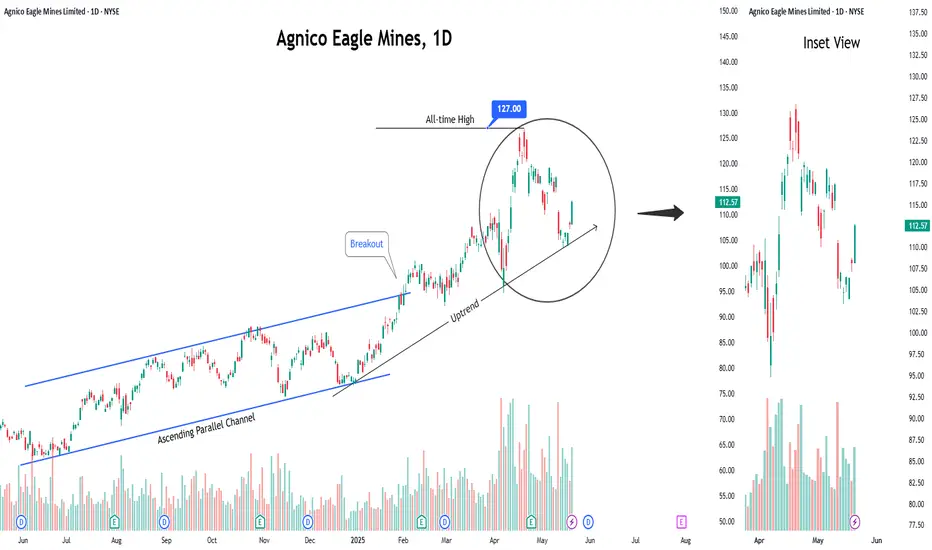
Trade consideration for 4/10/2025 $AEMWhat do you guys think of this trade for Thu 4/10/2025? I like that it shows a steady bullish trend (considering the volatility of today's market).

Strong Momentum and Price Performance $AEMAnalysis of NYSE:AEM Stock Performance
1. Strong Momentum and Price Performance NYSE:AEM exhibits strong momentum characteristics, with the stock price trading above short, medium, and long-term moving averages. Additionally, it has achieved a new 52-week high today, indicating strong bullish sentiment. The RSI (Relative Strength Index) also suggests price strength, reinforcing the stock’s positive momentum.
2. Consistent Outperformance Against the Industry NYSE:AEM has consistently outperformed its industry peers over various timeframes, including 1 week, 3 months, 1 year, and even 10 years. This long-term relative strength makes it an attractive investment within its sector.
3. Growth and Profitability Indicators
The company has shown good quarterly growth in its recent financial results.
Annual profit growth has been higher than the sector’s profit growth.
Net profit growth has been robust, aligning with significant gains in share price.
Revenue has increased consistently every quarter for the past 4 quarters, reflecting strong business expansion.
The company has strong cash-generating ability, with operating cash flow improving over the last two years.
4. Valuation Metrics and Financial Strength
The Price-to-Earnings (PE) ratio is lower than the industry average, suggesting the stock may be undervalued relative to its peers.
The PEG ratio (Price/Earnings to Growth) is lower than the industry PEG, indicating that the stock offers a good balance of price and growth potential.
Book value per share has been improving for the last two years, a positive indicator of financial health.
The company maintains low debt levels, reducing financial risk and ensuring sustainability.
5. Technical and Volume-Based Strength
Stocks near 52-week high with significant volumes indicate continued buying interest.
Volume shockers suggest that the stock has experienced unusual trading activity, which may indicate accumulation by institutional investors.
High momentum scores, with technical indicators above 50, reinforce the stock’s strong trend.
Conclusion NYSE:AEM is a fundamentally strong stock with a combination of growth, profitability, and strong momentum indicators. The stock’s consistent outperformance relative to its industry, low valuation metrics, rising cash flow, and strong financial health make it an attractive investment. Given its technical strength and fundamental resilience, NYSE:AEM appears well-positioned for further upside in the near to medium term.

Hedge against the Bears by buying Agnic Eagle Mines LimitedWatch the video, I basically used technical analysis of MA, RSI and TTM Squuze to determine that the direction is bullish on the daily, weekly, and monthly charts. Then coupled that with a 1.66 R:R ratio according to Gabriel's Kelly-based Risk to Reward Ratio. You can use levearge here such as option since the Implied Volatility is still around the 30% level, for futures you could use 2x etf if there is one I haven't check. Seasonality supports AEM until May 8 so there is a wind to fall back out if it falls with a bullish engulfing candle this Monday.

AemNice time to accumulate near breakout zone. As gold continues to shine, these names should be on the list.
AEM - LONGAEM - For a trade , also like WELL and PAYX , were secondary names on my list .
But all three are acting great these last few days and all longs taken above a prior days high a rule for me. Pretty max long after this for today , I am risking 0.3% right now per and that's 3 trades , will asses into close , good odds I will exit a few , I want to see at least 0.5 R profit to hold and case by case basis.
Daily looking good entry on 5 , gonna start add screenshot on 5M entries for clarity ..
5/6 name , lacking on RS as its less than 90 Rating rn.

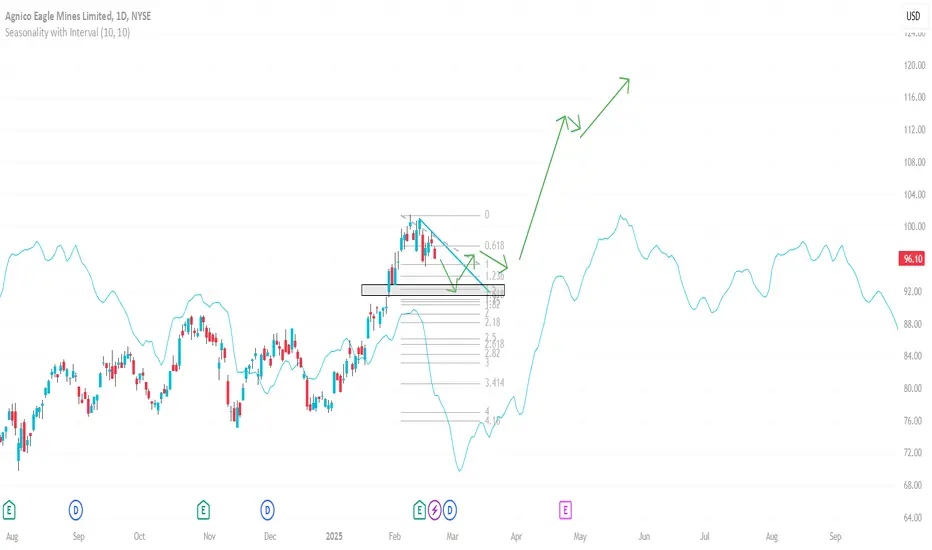
AEM Scenario ( Agnico Eagle Mines Limited )What is the use of a detailed scenario like this anyway? ;-)
Likely it will move in a different way.
But what i see is upside potential with a seasonal bias supporting that view.
Upmove likely to start at the 1.618 extention within this correction we are in right now
(compare to the past corrections)
Have fun!
Leave a like and feel free to comment or chat!
AEM - Head & Shoulder PatternAEM is possibly forming a Head & Shoulder pattern.
Price action is currently under a rising parallel channel that breaks downwards and price eventually breaks parallel channel. If price breaks the parallel channel and $74, it will complete Head & Shoulder pattern.
Once Head & Shoulder pattern is formed, stock price fall is either $ price or percentage difference between Head and neckline. In this case, the projected price fall after completion of Head & Shoulder is likely to be between:
- 63.17 if price drops by 14.50%
- 60.98 if price drops by $12.90
Price is probable to fall by $12.90 to 60.98 because it coincides with:
- Fib retracement level of 0.618 which is a golden ratio
- strong weekly support zone around 61.31
- gap fill is at 59.65

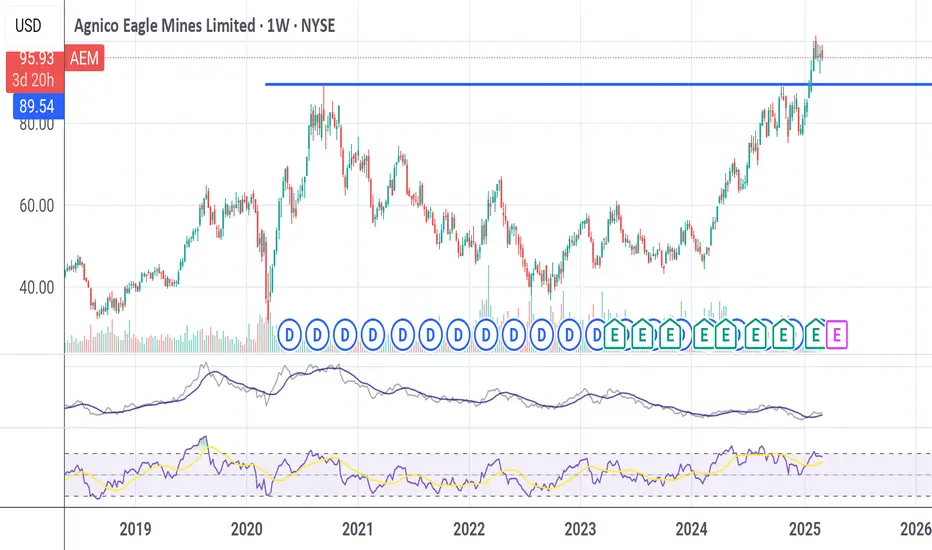
ATH reachedWe have reached the all-time-high again. If we cannot overcome it then a downward correction is due. This is the more that we have risen for 3/4 of a year without any substantial break. To continue the rise the market shall get rid of the weak hands.

breakout and confirmationNice chart.
break out is confirmed.
second level is also confirmed on the breakout.
long term build up of going nowhere.
now watch how hard this breaks higher.

Agnico Eagle Mines Limited (AEM)one weekly chart, the Agnico Eagle Mines Limited witnessed a strong rebound after forming a new higher low at 63.00$. It violated the last peak at 71.51$ during the current week. If it remains above this peak by the end of Friday's session, it will confirm the current uptrend in the medium term, leading to further rises near $76.70 - $80 - $85.50 - $89.25 in the short and medium term.
The stop-loss lies below 68.75$ for short-term investors and below 64.65 - 63 for medium and long-term investors.
the indicators are heading toward the positive side, which confirms the mentioned positive scenario.
The information and publications are not intended to be or constitute any financial, investment, commercial, or other types of advice or recommendations provided.

AEM long### Entry Position, Stop Loss, and Take Profit for Agnico Eagle Mines (AEM) Stocks. Entry Point:
- **Entry Point**: $66.60 - $68.05
- **Reason**: The current price is close to the support level at $66.60, as indicated in the technical analysis. This level is where the price is likely to stop falling and start rising.
#### Stop Loss:
- **Stop Loss**: $61.27
- **Reason**: A stop loss 8% below the entry point ($66.60) to limit losses in case the price moves unfavorably.
#### Take Profit:
- **First Take Profit**: $75.00
- **Reason**: This level corresponds to previous highs and can serve as the first resistance level where the price may stop rising.
- **Second Take Profit**: $80.00
- **Reason**: If the price continues to rise, $80.00 may be the next level to take profits.
### Why It's Worth Buying Now:
1. **Technical Signals**:
- **Return to 10-Week Average**: The price is returning to the 10-week average, which is often a positive signal for buying.
- **Rising Relative Strength (RS) Line**: The RS line is rising and surpassing the short-term downtrend, indicating potential further growth.
2. **Fundamental Indicators**:
- **Earnings Growth**: EPS (earnings per share) is expected to be $3.23 this year, with a projected growth of 11% next year.
- **Strong Position in the Gold Market**: Agnico Eagle Mines is one of the leading gold producers, making it attractive in times of market instability and rising gold prices.
3. **Investment Potential**:
- **Safety During Economic Instability**: Gold and gold mining stocks are often reliable assets during economic instability, adding attractiveness for investors.
### Conclusion
Agnico Eagle Mines (AEM) stocks look attractive for purchase at $66.60 - $68.05 with a stop loss at $61.27 and take profits at $75.00 and $80.00. The current technical situation and the company’s fundamental indicators support the idea of buying.

AEM TRADING IDEASI'm going to long this stocks as it already broke the resistance level and I am expecting it to go higher.

Agnico Eagle Mines: Slowly but surely… 👍Slowly but surely, Agnico is devoting itself to the current downwards pressure. Despite the occasional counter movement, the share should soon reach and break through the support at $31.03. Thus, it should arrive in the yellow zone between $19.10 and $10.08 to complete wave (2) in yellow. As soon as this is done and dusted, Agnico can turn upwards again, climb back above $31.03 and further northwards from there. A 25% chance remains, though, that the share could get dragged above the resistance at $67.14 instead. In that case, we would expect the ascent to continue above $89.16 as well.

AEM Entry, Volume, Target, StopEnter when price clears 59.53
With daily volume greater than 4.42M
Target: 70.00 area
Depending on your risk tolerance: 56.05 gets you 3/1 Risk/Reward but it's almost 8%
This trade idea is not trade advice. This idea is strictly based on my ideas and technical analysis. Not due diligence or fundamental analysis was performed while evaluating this trade idea. Do not take this trade based on my idea, do not follow anyone blindly, do your own analysis and due diligence. I am not a professional trader.

Agnico $70+ Price TargetWeekly Chart is forming a cup and handle.
The Conservative Math (Log Scale Chart):
Cup Floor: 40
Cup Top: 55.5
Cup Height: 15.5
Implied Price Target: 55.50+15.5 = $ 71
If you zoom out you'll notice the price target just so happens to be the top of a prior trading range.

long position on AEMMy strtegy is based on price action with the reading of certain indicators that I like whilerespecting all the values that define the stock maket

long position on AEMMy strategy is based on price action with the reading of certain indicators that I like while respecting all the values that define the stock maket

AEM shortthere is a downtrend parallel channel on this underlying. also last trading day it can not break its 200 MA and sell-off. I think the sell-off could fall until 49.5 in couple days
