Amd - New all time highs will follow!🪠Amd ( NASDAQ:AMD ) rallies even much further:
🔎Analysis summary:
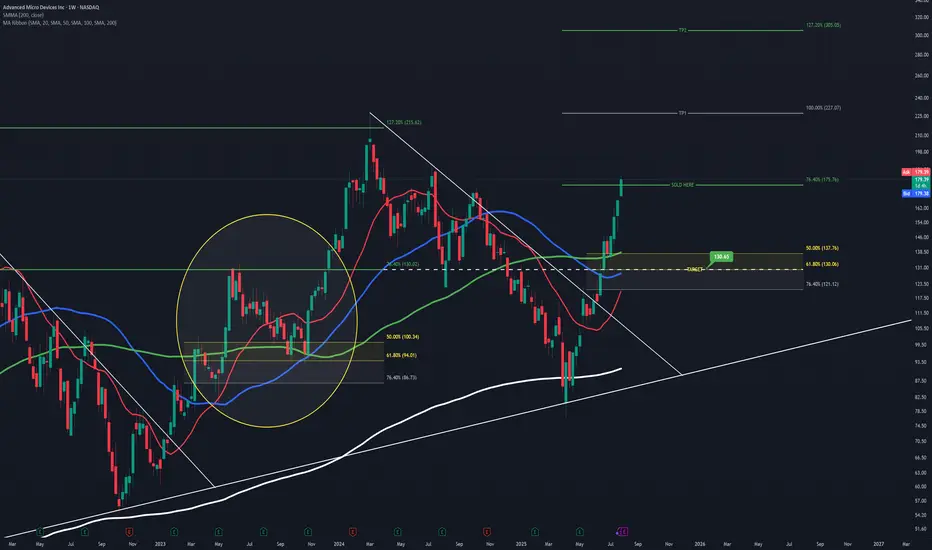
After Amd perfectly retested a major confluence of support a couple of months ago, we saw a textbook reversal. This retest was followed by a rally of more than +100% in a short period of time. But considering all the bullish momentum, Amd is far from creating a top formation.
📝Levels to watch:
$200
SwingTraderPhil
SwingTrading.Simplified. | Investing.Simplified. | #LONGTERMVISION
AMDD trade ideas

AMD Projection and Entry PointThis is speculation just like before, which played out very well so this is me having another shot at it.
Going off of the prior cycle AMD went through and comparing it to the one it's currently in, you can see a lot of similarities.
Learning from it's past and seeing how it likes to react to certain Fib levels, you can see that the 76.40% has been respected as a major level of resistance which resulted in its short retracement back in June '23 , It also acts as a very strong level of support as shown in August '24.
Assuming AMD rejects at the current 76.40% level again, using the prior 76.40% you can see it aligns perfectly with the golden ratio I have setup as my buy entry.
It all lines up too perfectly that in my mind, I'm certain it will play out. But of course it's all speculation, and the markets do as they please.
AMD will soar and POP $200. Analyst bang big on rival productAMD datacenter products are better than during 2023-24. It can now rival NVDA to grab global datacenter and entreprise datacenter market share. Analysts are upgrading to 200-210 target.
Trump recent lifting chip restrictions for export to china, boost AMD and NVDA market reach
AMD recent 800million inventory write off suddenly became instant cash as ban is lifted.
AMD is of the number 2 after NVDA to grab Trump's mega American datacenter plan, in the medium term, long players will see AMD break 200 to 350 easily.
AMD is like the younger NVDA few years back, going to 1 trillion is a set on course.
Are you really for the opportunity to grasp ?

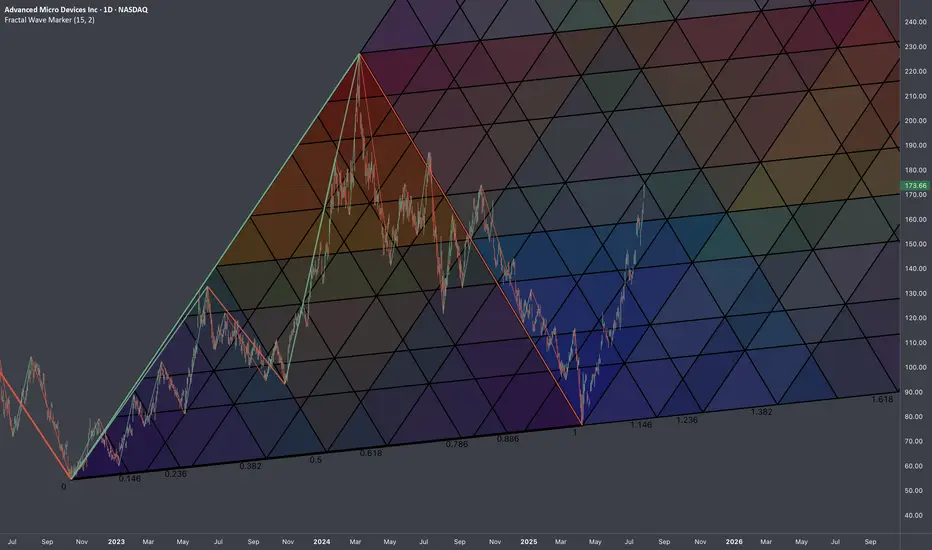
$AMD: Fractal Geometry (Cycle 2022-2025)🏛️ Research Notes
3 Coordinates used for base L-H-L
Fragmented with color spectrum fibs:
Extending structure with same scaling laws:
The chart intended to show objective structure covering unfolding progressions within cycles.
AMD Is Up 100%+ Since April. Here's What Its Chart SaysAdvanced Micro Devices NASDAQ:AMD has been on a roll recently, rising more than 100% in less than four months after losing nearly 60% of its value between a February 2024 intraday peak and an April 2025 session low. What does technical and fundamental analysis say as the chip giant prepares to report Q2 earnings on Tuesday?
Let's take a look:
AMD's Fundamental Analysis
AMD has risen amid several seemingly positive recent catalysts.
First, the Trump administration eased as part of the recent Washington-Beijing temporary trade truce some restrictions on advanced-chip sales to China by AMD and Nvidia.
Published reports also speculate that AMD might raise prices on its Instinct MI350 AI accelerator chips to $25,000 from an earlier $15,000 estimate. The Instinct MI350 is supposedly a realistic rival to Nvidia's high-end Blackwell B200 chips.
Wells Fargo analyst Aaron Rakers (who gets a five-star rating out of a possible five by TipRanks) also recently speculated that AMD will be able to charge around $30,000 for its next generation MI355X chip.
Rakers has a "Buy" rating on AMD and a $185 target price vs. Friday's $171.70 close. (Full disclosure: I am also long AMD.)
The chip giant will release Q2 results after the bell Tuesday, with the Street looking for $0.48 in adjusted earnings per share on about $7.4 billion of revenue.
At first blush, that doesn't compare well to the $0.69 in adjusted EPS that AMD reported in Q2 2024. But investors should understand that the firm is exporting more freely to China again, while demand for its newer products is pushing both prices and AMD's operating margin higher.
Note as well that the $7.4 billion revenue print that analysts expect for the company's latest quarter would represent more than 27% year-over-year growth.
That said, 27 of the 39 sell-side analysts that I can find who follow AMD have revised their earnings estimates lower since the quarter began. Just five have increased their estimates, while seven have left things unchanged.
AMD's Technical Analysis
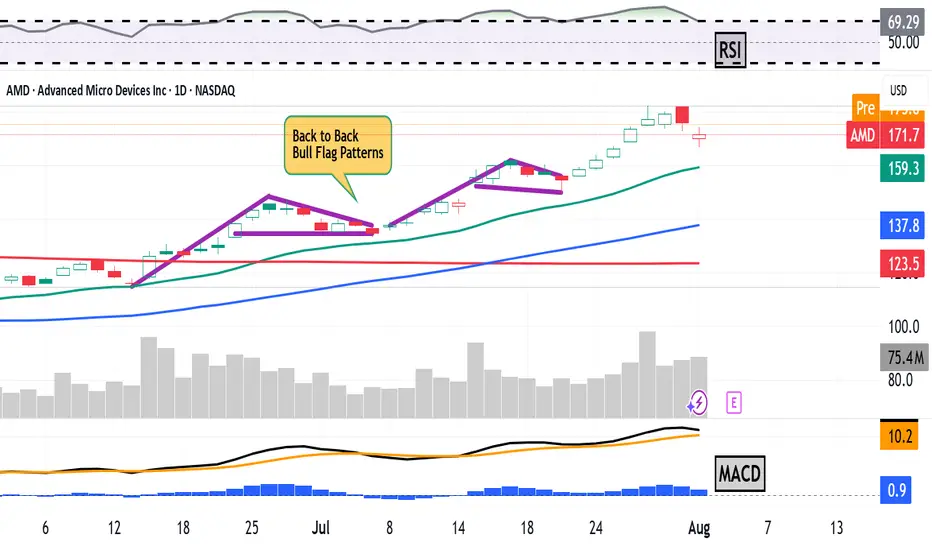
Next, let's look at AMD's chart going back some six months and running through Thursday afternoon:
Readers will see that AMD blasted out of what's called an "inverted head-and-shoulders pattern" of bullish reversal in early June with a $127 pivot (marked with jagged line and red-orange shading in the chart above).
Since then, the stock has developed two consecutive "bull-flag" patterns at the chart's right. These are historically what's known as "patterns of continuance," meaning that after a short consolidation period, a stock continues with its trend -- re-energized by the pause.
The bull-flag patterns put AMD's current upside pivot at $162, suggesting that perhaps as the stock approaches earnings, it could have more in the tank.
Of course, that might depend on how CEO Lisa Su handles this week's earnings call and what kind of forward guidance the firm issues.
Meanwhile, AMD's Relative Strength Index (the gray line at the chart's top) is more than robust. In fact, it's technically overbought and has been for most of July.
Similarly, AMD's daily Moving Average Convergence Divergence indicator (or "MACD," marked with black and gold lines and blue bars at the chart's bottom) is extremely bullish-looking.
The histogram of the stock's 9-day Exponential Moving Average (or "EMA," denoted with blue bars) is well above zero and has been since early July. That's historically bullish.
The 12-day EMA (marked with black line) is also well above AMD's 26-day EMA (the gold line), with both of them above zero. Again, that's a technically bullish sign.
(Moomoo Technologies Inc. Markets Commentator Stephen “Sarge” Guilfoyle was long AMD at the time of writing this column.)
This article discusses technical analysis, other approaches, including fundamental analysis, may offer very different views. The examples provided are for illustrative purposes only and are not intended to be reflective of the results you can expect to achieve. Specific security charts used are for illustrative purposes only and are not a recommendation, offer to sell, or a solicitation of an offer to buy any security. Past investment performance does not indicate or guarantee future success. Returns will vary, and all investments carry risks, including loss of principal. This content is also not a research report and is not intended to serve as the basis for any investment decision. The information contained in this article does not purport to be a complete description of the securities, markets, or developments referred to in this material. Moomoo and its affiliates make no representation or warranty as to the article's adequacy, completeness, accuracy or timeliness for any particular purpose of the above content. Furthermore, there is no guarantee that any statements, estimates, price targets, opinions or forecasts provided herein will prove to be correct.
The Analyst Ratings feature comes from TipRanks, an independent third party. The accuracy, completeness, or reliability cannot be guaranteed and should not be relied upon as a primary basis for any investment decision. The target prices are intended for informational purposes only, not recommendations, and are also not guarantees of future results. show less
Moomoo is a financial information and trading app offered by Moomoo Technologies Inc. In the U.S., investment products and services on Moomoo are offered by Moomoo Financial Inc., Member FINRA/SIPC.
TradingView is an independent third party not affiliated with Moomoo Financial Inc., Moomoo Technologies Inc., or its affiliates. Moomoo Financial Inc. and its affiliates do not endorse, represent or warrant the completeness and accuracy of the data and information available on the TradingView platform and are not responsible for any services provided by the third-party platform.
AMD Shares Decline Despite Strong Earnings ReportAMD Shares Decline Despite Strong Earnings Report
Yesterday, following the close of the stock market, Advanced Micro Devices released a strong quarterly earnings report:
→ Earnings per share came in at $0.48 (roughly in line with forecasts);
→ Revenue reached $7.68 billion (versus expectations of $7.41 billion).
At the same time, CEO Lisa Su stated: “We’re well positioned to deliver significant growth in the second half.”
However, despite the solid performance and optimistic outlook, AMD shares declined in after-hours trading, falling below $165.
The decline in AMD’s share price following a strong report may be attributed to excessively high expectations and the stock's overbought condition ahead of the announcement.
Technical Analysis of the AMD Stock Chart
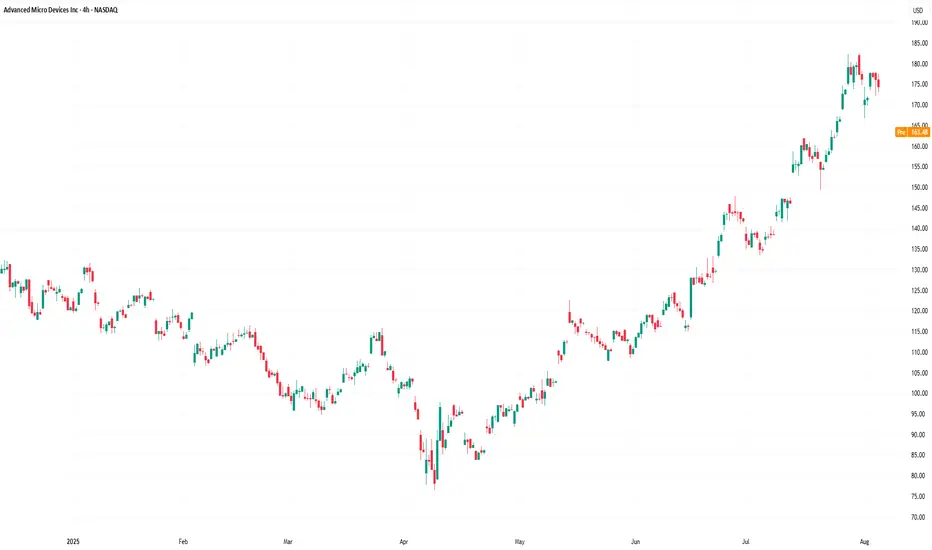
Since April 2025, price fluctuations have formed an ascending channel (highlighted in blue). In July:
→ the price broke above the upper boundary of this channel, moving sharply higher (marked in purple);
→ the RSI indicator remained above the 50 level throughout.
We can assume that investors were following the meteoric rise of Nvidia (NVDA) shares and were betting that the ongoing AI boom would enable AMD to deliver extraordinary results. However, these hopes were not fully realised — the classic case of "buy the rumour, sell the fact".
As a result, AMD shares may open today with a bearish gap. From a technical standpoint, this suggests that the price is returning to the limits of the blue ascending channel, where the midline and lower boundary may act as support levels. The psychological support level at $150 also appears significant.
This move may be interpreted as a correction — and once the excessive optimism accumulated in July dissipates, bulls may attempt to resume the upward trend, supported by fundamentally strong data.
This article represents the opinion of the Companies operating under the FXOpen brand only. It is not to be construed as an offer, solicitation, or recommendation with respect to products and services provided by the Companies operating under the FXOpen brand, nor is it to be considered financial advice.
AMD WEEKLY TRADE SIGNAL (7/31/25)
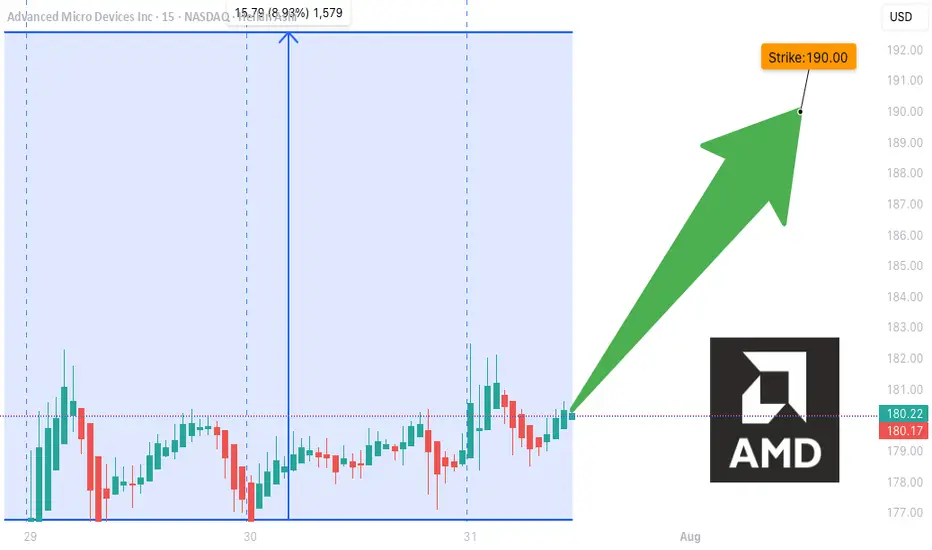
### 🚀 AMD WEEKLY TRADE SIGNAL (7/31/25)
📈 **MARKET SNAPSHOT**
🟢 Daily RSI: **86.0** 🔥
🟢 Weekly RSI: **80.4**
📊 Volume: 🔺 1.5x (Institutional surge)
💬 Call/Put Ratio: **1.90**
🌪 Gamma Risk: **HIGH (1DTE)**
🧠 Sentiment: **Extremely Bullish** across all models
---
💥 **TRADE IDEA**
📍 Ticker: **\ NASDAQ:AMD **
📈 Direction: **CALL (LONG)**
🎯 Strike: **\$190.00**
💵 Entry: **\$0.51**
🎯 Target: **\$0.90** (+75%)
🛑 Stop Loss: **\$0.30**
📆 Expiry: **Aug 1 (Friday)**
📊 Confidence: **85%**
⏰ Entry: Market Open (Time-sensitive!)
---
🧠 **STRATEGY CONTEXT**
✅ Bullish momentum from AI sector hype
✅ Institutional call buying volume spiking
⚠️ 1DTE = High Gamma Risk = TRADE FAST OR DON’T TRADE
⚠️ Manage decay & exit early if momentum stalls
---
📌 Signal Posted: 2025-07-31 @ 12:17 PM ET
\#AMD #OptionsAlert #AITrade #WeeklyOptions #TradingViewViral #1DTE #GammaSqueeze
AMD and NVDA: First week of August My thoughts and opinions!
Hope you find it informative and as always, safe trades!

AMD Short AMD has the potential to fall from the $200 level within the Fair Value Gap (FVG) zone, and based on the Cypher pattern, it is aiming to reach a lower FVG zone as the next target.

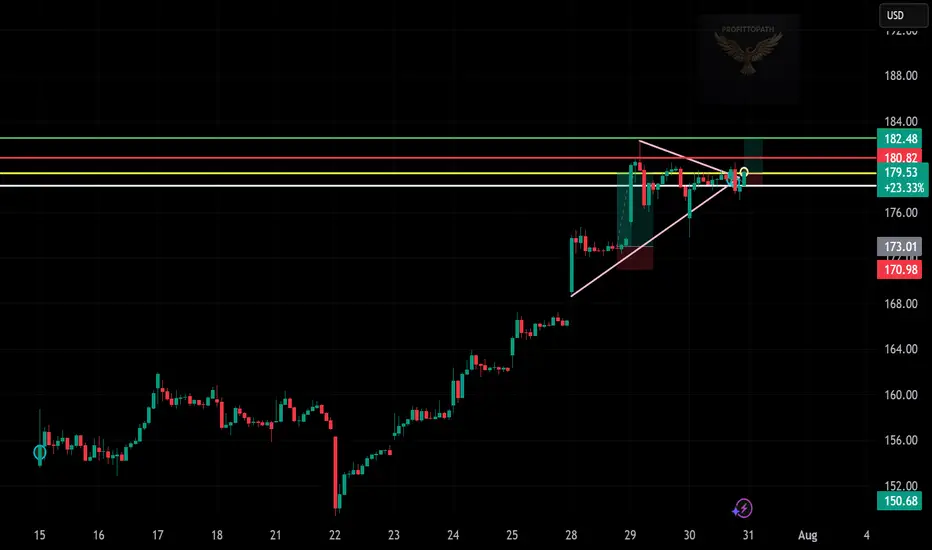
“AMD Breaks Out — Triangle Setup in Action”
📈 Trade Snapshot:
AMD breaks a tight triangle range with momentum. A clean move above $180.82 puts $182.48 in sight.
🎯 Plan:
→ Entry: $179.53
→ SL: ~$173.00
→ Target: $182.48
📌 Clear structure, low-risk entry, breakout confirmed. Let it run.
📋 Hashtags:
#AMD #BreakoutTrade #ChartSetup #TechnicalAnalysis #ProfittoPath #SwingTrade #PriceAction #SmartMoney
AMD eyes on $178: Serious Resistance zone that may give a DIPAMD bouncing back from market wide dump last week.
Approaching a significant resistance at $177.79-178.59
Look for a Dip-to-Fib ideally to green at $163.30-163.61

AMD Don't Miss Out
### 🚀 \ NASDAQ:AMD Bullish Reversal Play — Weekly Options Setup
**🔥 Institutional Flow + RSI Momentum + Volume Surge = Opportunity**
---
📊 **Model Consensus Summary (Grok, Claude, Gemini, Llama, DeepSeek):**
* **🟢 Weekly RSI:** Climbing ⬆️ — confirms trend
* **🔴 Daily RSI:** Slight dip = caution, but **volume overrides**
* **💰 Call/Put Ratio:** 2.00 → **Big Money** loading calls
* **📈 Volume Spike:** 1.7x last week → institutional confirmation
* **🧠 AI Sector Tailwind:** Adds strong narrative fuel
---
### 🎯 Trade Setup – 5D Weekly CALL
| 🧾 Entry | 🎯 Target | 🛑 Stop Loss | 🎲 Risk/Reward | 📅 Expiry |
| -------- | --------------------------- | ------------ | --------------- | ---------- |
| \$4.40 | \$6.75 (TP1) / \$9.00 (TP2) | \$2.60 | 1:1.78 / 1:3.46 | 2025-08-08 |
**📌 Strike:** \$180.00
**🎯 Strategy:** Naked CALL (single-leg)
**⏰ Entry:** Market open
**✅ Confidence:** 75%
**⚠️ Risk Flag:** Short-term volatility from daily RSI dip
**🔍 SL based on 40% drawdown tolerance**
---
### 📣 TL;DR
> **“Smart money is early. Momentum is building. AMD could break out hard.”**
> 🔸 Weekly RSI + Volume + Calls = Setup
> 🔸 Short-dated play for aggressive profits
> 🔸 Tight stop, wide upside
---
### 💡 Tag It:
\#AMD #OptionsTrading #WeeklySetup #TradingSignals #AIStocks #InstitutionalFlow #RSI #CallOptions #MomentumPlay #TradingView #SwingTrade

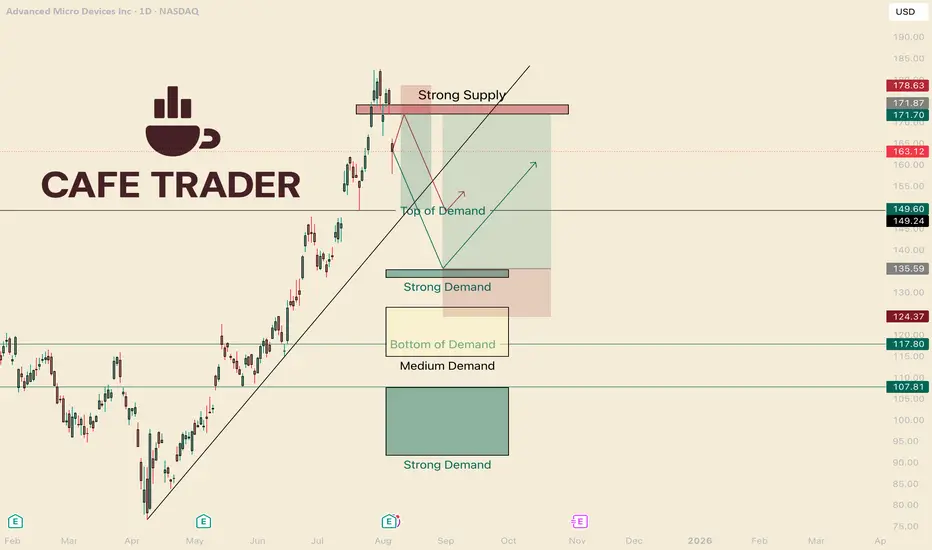
Buy AMD with Confidence. Hello I am the Cafe Trader.
My goal is to help you find great pricing for your long term, and help you finesse your position the markets.
Today we are going to take a closer look at AMD.
As of right now AMD has just peeled off it's highs, gapping down. Is this where buyers are stepping in? Should you buy now? What are some short term plays that can maximize your profits?
CONTEXT
On the Chart I have labeled different levels of Demand. Knowing where the players are (buyers and sellers) can help us be surgical in price and timing.
In my opinion it is best to trade in terms of scenarios. How players react is just as important as Where they react.
For example: Say you are waiting in a long line for coffee. After some time, the line moves very slowly. We can start to ask questions, like "Why is this taking so long? How long will this take?"
"How" is an important question because we would have to examine how fast, or slow, the line is moving. We are in the dark with how big the current players are in the market.
Knowing "How" will help us position ourselves well with the other players. This lines us up for the best pricing, and helps us be able to get out of a position quick if we are wrong.
SHORT TERM
AMD had mixed earnings. This puts pressure on the buyers but they are still in control.
With a new seller inbound It's probable to hit the "Top of Demand" before breaking new highs.
Short Scenario (Red Line)
I think this will touch quick, reject, and then a few days of sideways before the real move down. You can take a Short right in this zone at 172, but if you buy puts, look to get good pricing. If we move up 4% the contracts might be too expensive to swing 3-5 days. I think after the touch, wait two days or so, and then look to get into some options.
Short (shares)
Entry 172
Stop 178.75
TP 150
Short (options)
Entry is after a test of the strong supply, wait a couple days.
Strike price: 160 Strike (or higher)
Premium: 4 to 1 R
$1.50 4-5 days TP $600
$2.50 6-10 days TP $1000
Long Scenario.
If we do not touch the strong supply before going down, This could drop aggressively. Unlike the previous scenario, I am expecting a hot reaction off the strong Demand area.
Long (shares)
Entry 135.50
Stop 124
TP 172
Long (options)
As soon as it touches, same day and next days contracts, 1 - 2 standard deviations outside the money. I think It can get to 140 minimum the same day.
Strike 136-137
Premium: 2.50-3.50 (if you get it cheaper, great!) Really this will depend on if it touches on a Monday, or a Friday lol.
TP 150% - 400%
LONG TERM
These prices should align with your own sentiment and Due Diligence of AMD.
Fair: $149.50 (Top of Demand)
Deal: $133.50 - 135.50 (Strong Demand)
Steal: anything under 108
(2nd Strong Demand)
Don't forget to Boost and follow!
More insight to come, and make sure you check out all my channels.
Much Love and Happy Trading!
@thecafetrader
Half way thereAMD Triangle Convergence Breakout - 1:1 Target Analysis
📈 Technical Setup:
- Triangle convergence pattern successfully broken to the upside
- Clear breakout with strong momentum
- 1:1 risk-reward ratio maintained
🎯 Target Analysis:
- Using ray projection from previous high points
- Target zone identified based on technical structure
- Currently halfway to target level
✅ Progress Update:
- 50% of the move completed
- Maintaining bullish structure
- Next resistance level in focus
Risk management and position sizing remain crucial. This analysis is for educational purposes only.
#AMD #TechnicalAnalysis #TriangleBreakout #StockTrading

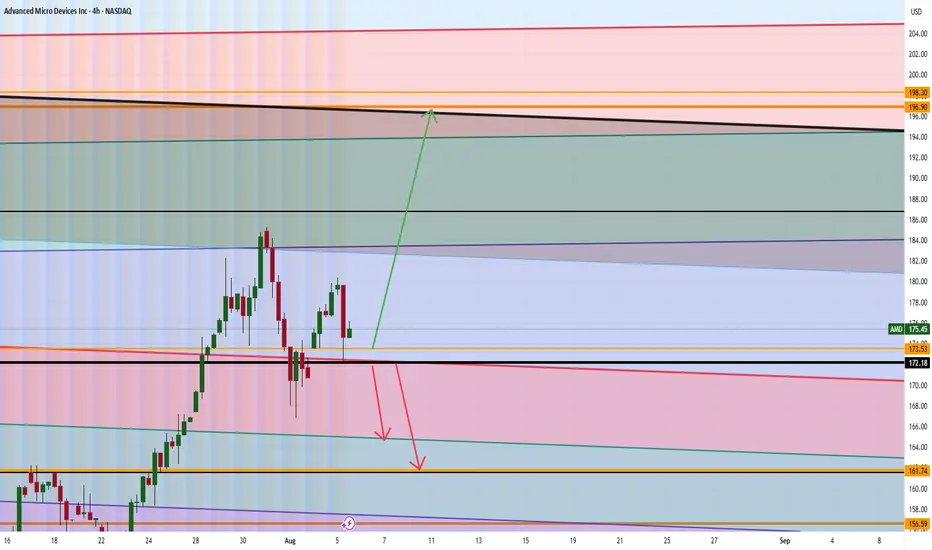
AMD Analysis Are WE GOING TO $199? Good morning trading fam
Currently we a strong bull run for AMD on the Monthly time frame.
Currently if we can hold above 172 then we will see a nice run up to 196-199 territory or higher.
If we break below the 172 we can a quick short down to the orange level we marked out.
Happy Trading
Trade Smarter Live Better
Kris
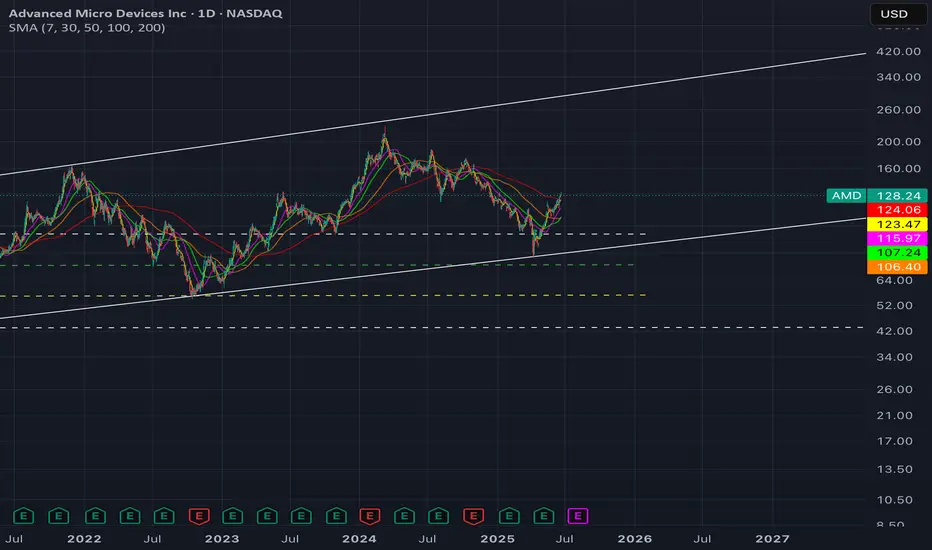
Quick draw upI did quick and simple T/A and in my opinion seems to be the likely outcome. EMA lines are about to cross, it has made a lower low, which has now flipped the Fibonacci and likely to get rejected at the 61.80% - 50% range. The path lines aren't placed specific to the timeframes so ignore that it stretches way into 2025.

AMD Weekly Trade Alert (2025-07-29)
**🔥 AMD Weekly Trade Alert (2025-07-29) 🔥**
💹 *Momentum Confirmed. Calls Loaded. Let’s Ride.*
📈 **Key Bullish Signals**
✔️ Daily RSI: **83.2** (Rising)
✔️ Weekly RSI: **79.9** (Rising)
✔️ Call/Put Ratio: **2.03** 🧨
✔️ Volatility: Low (VIX = 15.2)
⚠️ Volume Weak (0.9x) – But not a dealbreaker.
---
**🎯 TRADE SETUP**
🔹 **Ticker**: \ NASDAQ:AMD
🔹 **Strategy**: Weekly Naked Call
🔹 **Strike**: \$185C
🔹 **Entry**: \$0.66
🔹 **Profit Target**: \$1.32 (100%)
🔹 **Stop Loss**: \$0.33
🔹 **Expiry**: 2025-08-01
🔹 **Size**: 3 Contracts
🔹 **Confidence**: 75%
---
**🧠 WHY THIS WORKS**
🔋 Momentum → STRONG
💰 Institutions are loading up calls
🧘 VIX = calm
⚡ Short gamma risk = fast payoff or cut
---
📢 **Watchlist it. Trade it. Exit fast.**
💬 Comment “🔥AMD” if you’re in.
🔁 Repost if you see \$190 coming.
\#AMD #OptionsTrading #CallOptions #TradingView #WeeklySetup #MomentumPlay #BullishSignal #MarketMomentum
New Highs Will Be DelayedThis is how it's going to be. You can disagree and be against it all you want, but much more consolidation in price will occur first over the long term, before a proper bull run returns.

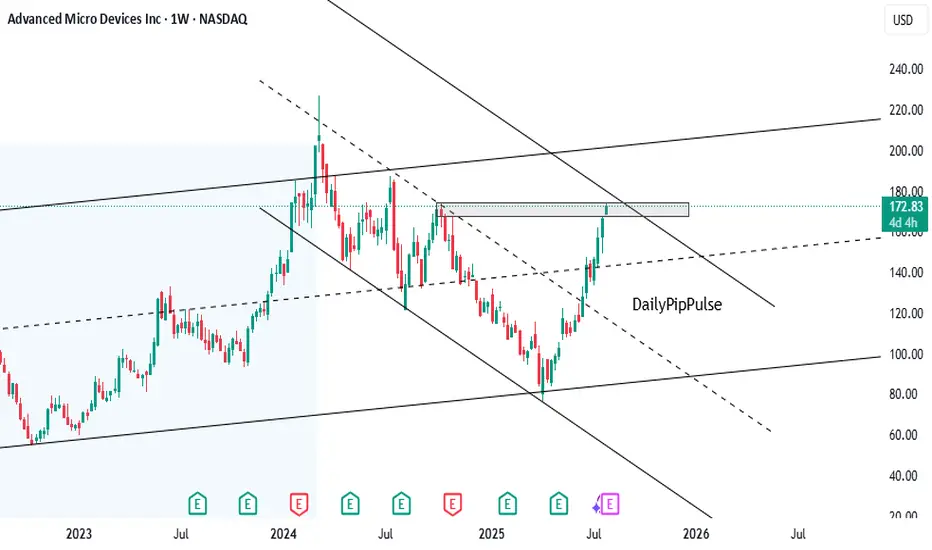
AMDthe weekly price action of Advanced Micro Devices Inc (AMD):The stock is trading near a critical resistance zone marked with a rectangular box just below $180.In the past, this area acted as a rejection point, evident from prior pullbacks when the stock neared these levels.
The chart reflects a larger declining channel. Current price action shows AMD approaching the upper boundary of this channel, which may act as dynamic resistance.
If AMD breaks above the $180 resistance convincingly, there’s potential for the stock to aim for higher targets, such as the next major zone ($240).
Failure to break above $180 may lead to a retest of lower levels, potentially near $140 or the breakout zone ($100-$120).
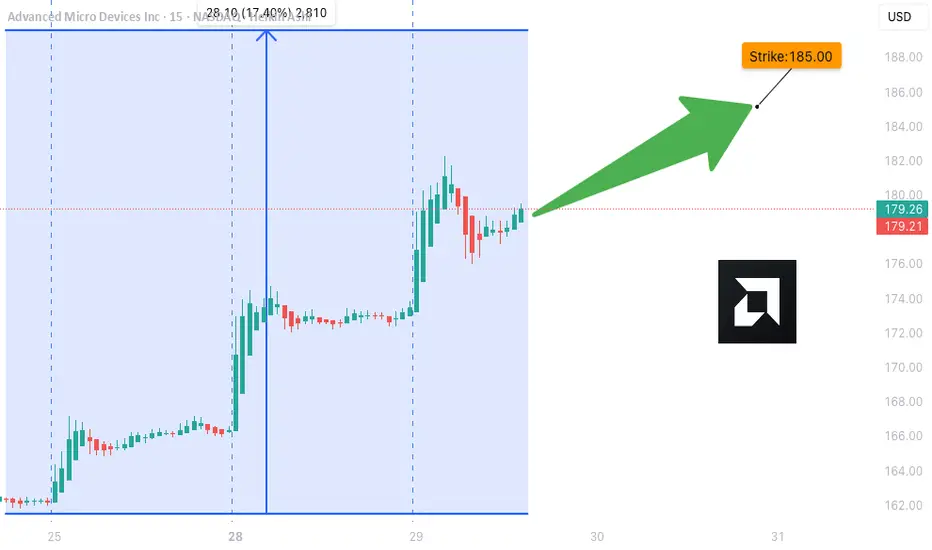
AMD we have made it at 170 USD guys! TSXGANG! 📊 AMD Stock Technical Analysis
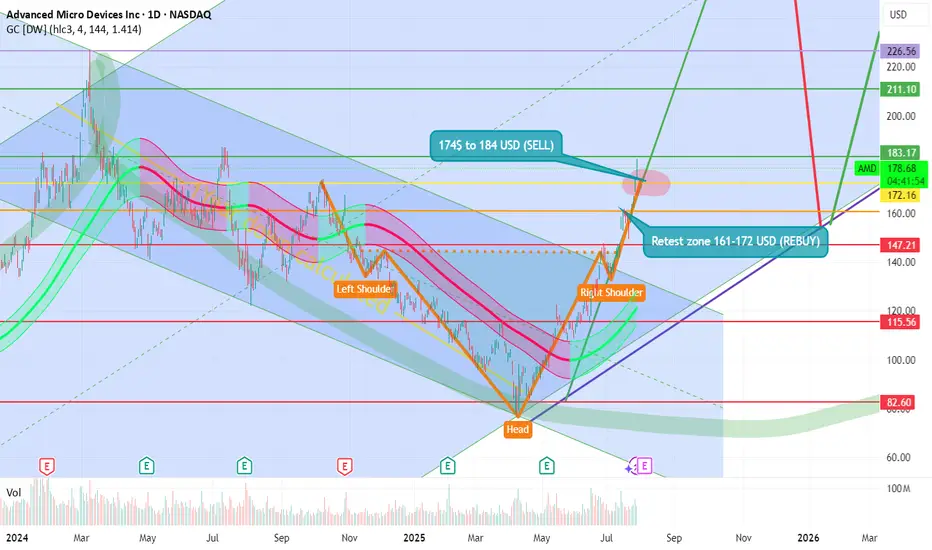
🧠 Head and Shoulders Pattern
- This chart shows a classic head and shoulders formation:
- Left Shoulder: First peak around ~$172
- Head: Highest peak near ~$183
- Right Shoulder: Second peak returning to ~$178
🔎 This pattern often signals a potential reversal in an uptrend—investors might expect selling pressure ahead if confirmed.
📉 Sell Zone 📍
- 💸 Highlighted zone: $174–$184 USD
- 🚨 Considered an overbought region—ideal for profit-taking or short positions
Current price: $178.82 USD 📌 (+$5.16 / +2.97%)
This price lands right in the sell zone, suggesting caution as upside might be limited short-term.
🔄 Retest Zone (Support) 📍
- 🛡️ Marked between $161–$172 USD
- 🤝 A potential buy zone where price could stabilize or rebound
If AMD pulls back, this is where buyers might re-enter the market for long positions.
🧪 Trend Indicators & Sentiment
- 📈 Recent bullish move (+2.97%) shows strength—but could also be testing resistance
- 🔁 Watch for confirmation of either a breakout above $184 or a pullback to retest support
- 🧭 Overall sentiment looks cautiously optimistic but technically fragile near the upper resistance
🧠 Final Thoughts 💬
This chart analysis suggests AMD may be approaching a turning point. Traders should keep an eye on volume, macro tech trends, and market reactions in the coming sessions.
The information and publications are not meant to be, and do not constitute, financial, investment, trading, or other types of advice or recommendations.
Thank you!
Subcribe to TSXGanG! 🧠🎯
$AMD supercycle ; PT $300-350 by 2027- NASDAQ:AMD has likely entered a supercycle and we have entered Agentic AI world where inferencing is the main area of investment.
- Model Training is still important but we have entered a stage where lot of open source models and many proprietary vendors are close to each other when it comes to performance.
- Companies are trying to monetize their investments and one critical thing is model inference i.e making predictions.
- NASDAQ:AMD is poised for the agentic ai boom and therefore next 2 years are golden years for $AMD.
AMD: Potential Mid-Term Reversal from Macro SupportPrice has reached ideal macro support zone: 90-70 within proper proportion and structure for at least a first wave correction to be finished.
Weekly
As long as price is holding above this week lows, odds to me are moving towards continuation of the uptrend in coming weeks (and even years).
1h timeframe:
Thank you for attention and best of luck to your trading!

AMD - Will Buyers Show Up at Longterm VAL???With the markets getting oversold, does AMD, who has been in a long downtrend, finally find buyers at its longterm VAL? This is the area to see if buyers finally show up in my opinion.
