Bullish continuation? NASDAQ:AMZN is looking at a continuation of uptrend after a strong bullish break out of the flag formation. Breakout was relatively healthy as there isn't any parabolic break. We expect prices to continue its strong momentum and break above the key resistance at 233.70.
Long-term MACD remain strong and healthy. Stochastic Oscillator though confirmed the overbought signal earlier on, but selling pressure remain weak based on price action and the %K and % D line may performed a positive crossover soon. 23-period ROC is back above the zero line and confirming the rising momentum. Volume is relatively healthy.
AMZND trade ideas

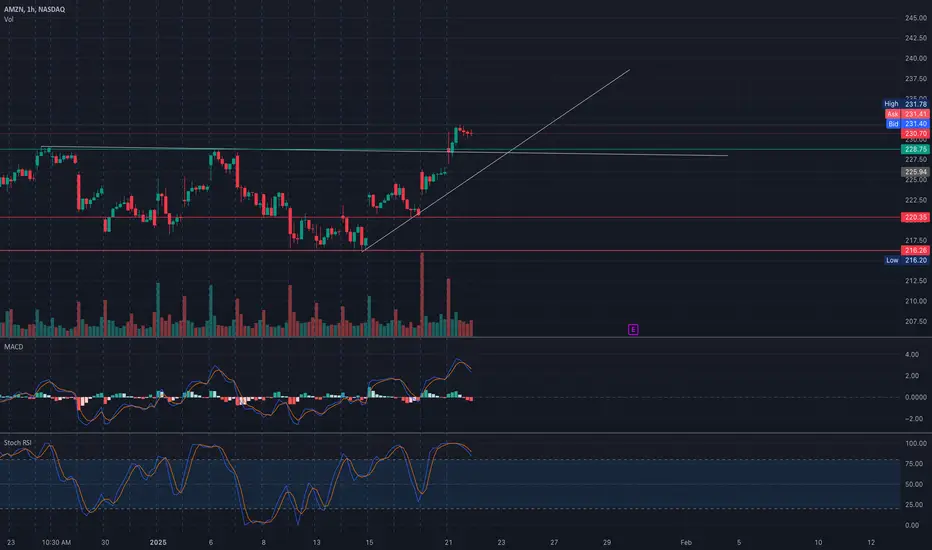
AMZN Approaching Key Levels! Critical Moves Ahead - Jan 22Technical Analysis for Trading
* Trend Overview: AMZN continues its bullish trend, supported by a rising trendline. The price is consolidating near $231.40, testing immediate resistance. Momentum shows strength, but overbought conditions may trigger a short-term pullback.
* Key Levels:
* Resistance: $231.40 (current level) and $235.00 are critical zones for a breakout.
* Support: $228.75 and $225.94 are key levels to watch in case of a retracement.
* Indicators:
* MACD: Bullish, but momentum is tapering off, signaling potential consolidation.
* Stoch RSI: Overbought, which may lead to short-term profit-taking.
* Volume: Consistent buying interest supports the upward move. Any breakout must be confirmed by higher volume.
Gamma Exposure (GEX) Insights for Options Trading
* Key Gamma Levels:
* Positive GEX: $235.00 is the strongest resistance level, where the highest call wall resides.
* Negative GEX: $220.00 and $217.50 are critical put support zones.
* Options Metrics:
* IVR: At 52.4, options premiums are moderately high, offering opportunities for credit strategies.
* Call/Put Skew: Calls dominate at 23.6%, reflecting a bullish market sentiment.
* Actionable Gamma Zones:
* Bullish Scenario: A breakout above $231.40 could lead to rapid testing of $235.00 due to gamma-driven buying pressure.
* Bearish Scenario: A pullback below $228.75 might activate put support at $225.94.
Trade Scenarios
1. Bullish Setup:
* Entry: Break and hold above $231.40.
* Target: $235.00 and $237.50.
* Stop-Loss: Below $230.00.
2. Bearish Setup:
* Entry: Break below $228.75.
* Target: $225.94 and $220.00.
* Stop-Loss: Above $230.00.
Important Note
The market may experience volatility around key levels. Reassess price action during pre-market or intraday activity and adjust your strategy accordingly.
If you have questions or need analysis for another stock, feel free to reach out!
Disclaimer: This analysis is for educational purposes only and does not constitute financial advice. Always trade responsibly.
AMZN Trade IdeaAmazon is playing well with this resistance zone. I have a short and long entry set based on Fibonacci levels.
Long trade idea:
Entry: Above Supply zone
Target: A 1.618 Fibonacci level drawn in the past.
Short trade idea:
Entry: Below Supply zone
Target: 1.618 Fibonacci
Whither I enter the trade or not depends on price action.
KEY:
-White Horizonal Lines: Previous resistance levels.
-Green Horizontal Lines: 1.618 fib level (previous days).
-Green boxes: Supply and demand


Amazon (AMZN) Continuation Breakout in FocusChart Analysis:
Amazon's price action showcases a breakout from a consolidation channel (green shaded area), confirming the resumption of its broader uptrend.
1️⃣ Rising Trendline Support (Blue):
The price continues to respect the ascending trendline originating from September 2024 lows.
This trendline acts as a dynamic support zone, reinforcing the bullish structure.
2️⃣ Consolidation Channel Breakout:
After a brief consolidation in a descending channel, the price has broken out to the upside, signaling bullish continuation.
A decisive daily close above the channel confirms renewed buying interest.
3️⃣ Moving Averages:
50-day SMA (blue): Positioned at $217.48, rising and providing strong dynamic support.
200-day SMA (red): Positioned at $192.35, further underpinning the long-term bullish trend.
4️⃣ Momentum Indicators:
RSI: At 60.32, signaling strong upward momentum but still below overbought levels.
MACD: Positive crossover continues to support the bullish momentum.
What to Watch:
Sustained trading above the breakout level to confirm the continuation of the rally.
Potential resistance near $240-$250, the next significant zone to watch.
Pullbacks to the 50-day SMA or the ascending trendline could provide buying opportunities for trend followers.
Amazon's breakout from consolidation and its adherence to the ascending trendline suggest the stock is poised for further gains, supported by strong momentum and rising moving averages.
-MW

Nancy Pelosi bought Amazon Calls! 📈 Bullish Opportunity: Amazon (AMZN)
1️⃣ Bullish Flag Pattern with Premarket Breakout:
Amazon has formed a classic bullish flag pattern, which is a reliable continuation signal in an uptrend. The price has already broken out of the flag channel in the premarket session, signaling strong bullish momentum and potential for significant upside.
2️⃣ Amazon’s Cloud Leadership is Poised to Strengthen:
AWS (Amazon Web Services) continues to lead the cloud infrastructure market, controlling 33% of the market—more than Azure and Google Cloud combined, according to Canalys.
CEO Andy Jassy noted four consecutive quarters of reaccelerating AWS growth, with an annualized revenue run rate of $110 billion.
3️⃣ AI Advancements Reasserting Dominance:
While Microsoft is seen as the leader in the AI revolution, Amazon is catching up fast. Over the past 18 months, AWS released nearly twice as many machine learning and generative AI features as competitors combined.
These advancements are expected to make Amazon a leader in AI throughout 2025, further enhancing its cloud and technology business.
4️⃣ E-commerce Profitability Soaring:
CEO Andy Jassy’s focus on cost-cutting and logistics efficiency is delivering results:
Operating income in Amazon’s North American e-commerce segment grew by 87% in the first nine months of 2024.
Automation advancements, like robotics in fulfillment centers, have reduced processing times and improved cost efficiency by 25% during peak times.
These measures are driving higher profitability in its flagship e-commerce business, helping Amazon increase margins and drive long-term growth.
5️⃣ Undervalued and Strong Growth Potential:
Simply Wall Street estimates Amazon is trading at 40.5% below fair value, offering an attractive entry point for investors.
6️⃣ Smart Money Confidence:
Nancy Pelosi recently purchased Amazon calls 3 days ago!
7️⃣ Analyst Ratings:
Consensus: Strong Buy from top analysts.
Average Price Target: $245 (near-term expectations).
High Price Target: $280 (bullish scenario).
🎯 Strategy:
Enter now : $225.94 - $228.50
First Target : $240 (First resistance after breakout).
Second Target : $260 (Measured move from the flagpole).
Third Target : $280 (High-end analyst expectations).
Stop Loss: Based on the risk management.

Amazon bull flagNASDAQ:AMZN has a bull flag on the weekly and daily charts
Positives:
* Great chart
* Holiday spending should help with ER
* Above all MAs
* Mag 7 has lagged quite a bit and any rotation into them might give a boost
* Trump effect, Bezos sitting in the front row :)
Negatives:
* No real AI products to generate meaningful recurring revenue
* Huge AI spend
* Severences due to attrition as a result of 5 days in office policy

AMAZON - Next day delivery of GAINS!NASDAQ:AMZN 📦
🔹Green H5 Indicator
🔹9ema Bullish Cross
🔹Bull Flag
🔹Bullish Wr%
🔹Volume Shelf Launch
🎯$233🎯$243 before March! ⏲️
Not financial advice

Mo money Mo money AMZN to the moon ? AMZN: Bull Flag on Daily Chart
Amazon (AMZN) is forming a bullish flag pattern on the daily chart, indicating potential for further upward movement. This pattern typically suggests a continuation of the prior uptrend after a period of consolidation.
Key observations:
Bull Flag Structure: After a strong upward surge, AMZN has entered a consolidation phase, creating a flag-like formation with parallel downward-sloping lines.
Volume Dynamics: The initial breakout was accompanied by high volume, while the consolidation phase has seen diminishing volume, a classic characteristic of a bull flag.
Support and Resistance Levels: The resistance level is observed around , with support at , defining the flag boundaries.
Moving Averages: AMZN is holding above the , which may provide additional support and align with the bullish outlook.
Potential Breakout: A breakout above the upper boundary of the flag could propel AMZN toward , based on the flagpole's length projection.
Watch for a breakout with increasing volume to confirm the bullish continuation. Keep an eye on broader market trends and any news that may influence AMZN's price action.

AMZN Long then Short: Towards EarningsFrom my Elliott Wave counts, I believe that Amazon still have some room to go but it will be the last wave up given that wave 4 turns out to be a triangle too.
Take note that while I am bearish overall for the entire market, I think that via financial engineering, US equity markets might still be able to hold up for a while. And this time, Amazon may be the stock that will cushion the index.
I've placed the possible short entries on this chart and they are both Fibonacci Extension levels. And I expect that they will play the usual: earnings that exceeds expectations, price gapped up, started selling down.
Take note that this will be labelled short because the essence of this idea to short at the turning point even though in the short-term, it is a long first then short.

$AMZN FlaggingNASDAQ:AMZN if that flag plays out, we are looking at $255 area.
As always, I share my opinions and trades. I’m not suggesting anyone follow my trades. You do you.

Amazon’s Stock Stuck in a Downhill Slope or Ready to Escape ?Amazon's stock price movement on a 4-hour timeframe, presenting a descending channel pattern. This pattern is often associated with bearish sentiment, as it reflects a market structure characterized by lower highs and lower lows, signaling a consistent effort by sellers to dominate price action.
Currently, the price is trading near the upper boundary of the channel, which acts as a dynamic resistance level. Historically, such resistance zones within descending channels tend to attract selling pressure, reinforcing the bearish outlook. If the price fails to break above this resistance and shows rejection signs (e.g., long wicks or bearish candlesticks), it could confirm a continuation of the downtrend, targeting the lower boundary of the channel as the next support level.
It is crucial to monitor this resistance area closely, as a breakout above the channel could shift the sentiment from bearish to bullish. For such a breakout to be credible, it must be accompanied by strong volume and decisive candlestick patterns, such as a bullish engulfing or a breakout gap. In that scenario, the price could invalidate the descending channel and initiate a reversal, targeting higher resistance levels.
Additionally, the broader market context and fundamental factors should be considered. If the stock is supported by positive catalysts or market sentiment, it could strengthen the likelihood of a breakout. Conversely, weak sentiment or negative news could intensify the bearish momentum, leading to further downside.
The chart currently reflects a bearish bias due to the descending channel structure. However, the key to determining the next move lies in the price action and volume near the upper resistance line, which will decide whether the pattern continues or reverses.

AMAZON WILL KEEP GROWING|LONG|
✅AMAZON is trading in an
Uptrend along the rising
Support line and we are
Already seeing a bullish rebound
And a move up from the support
Just as I predicted so we are
Bullish biased and we will be
Expecting a further
Bullish continuation
LONG🚀
✅Like and subscribe to never miss a new idea!✅


AMZN: Consolidating Below Resistance🔥 LucanInvestor's Strategy:
🩸 Short: Below $222.19, targeting $215 and $210. Bearish MACD momentum suggests caution near key support.
🩸 Long: Above $226.26, aiming for $230 and $240. A breakout above resistance would confirm bullish momentum.
🔥 LucanInvestor's Commands:
🩸 Resistance: $226.26 — A critical level for bulls to confirm upward momentum.
🩸 Support: $222.19 — Immediate support; breaking below could lead to a retest of $215.
Amazon (AMZN) is consolidating near key resistance at $226.26, with MACD showing weak but stabilizing momentum. The price is above the 9-day EMA ($222.19), signaling recovery, but sustained volume is required for a bullish breakout. A failure at resistance may result in a short-term pullback.
👑 "Master the range, and you’ll master the trade." — LucanInvestor

AMAZON Bullish Flag Pattern! Buy!
Hello,Traders!
AMAZON is trading in an
Uptrend and the stock
Has formed a bullish flag
Pattern so IF we see a
Bullish breakout then we
Will be expecting a
Further bullish continuation
Buy!
Comment and subscribe to help us grow!
Check out other forecasts below too!

AMZN Consolidates Before Key Moves! Trade Setups to Watch
Analysis:
AMZN is trading within a well-defined ascending channel, showing resilience near the $220 level. The stock has faced consistent resistance at $227-$230, as indicated by strong call walls in GEX data. The MACD is slightly bearish, with momentum waning, while the Stochastic RSI indicates oversold conditions, suggesting a potential bounce.
Volume remains steady, reflecting a wait-and-see attitude among traders, with key levels acting as a magnet for price action.
Key Levels to Watch:
* Resistance Levels:
* $227-$230: Significant resistance zone with the highest GEX levels.
* $233: Psychological resistance, aligning with extended targets.
* Support Levels:
* $217.50: Immediate support zone.
* $215: Critical level, aligning with strong put walls.
* $210: Final downside support before significant selling could accelerate.
GEX Insights:
* Gamma Exposure (GEX):
* Positive GEX peaks near $227-$230, creating strong resistance to upside momentum.
* Negative GEX levels around $215 provide a critical support floor.
* Options Activity:
* IVR: High at 56.4, signaling elevated implied volatility.
* Call/Put Ratio: Calls remain subdued at 13.2%, indicating bearish positioning.
Trade Scenarios:
Bullish Scenario:
* Entry: Break above $227 with strong volume.
* Target: $230 (first target), $233 (extended target).
* Stop-Loss: Below $220.
Bearish Scenario:
* Entry: Break below $217.50 with increasing selling pressure.
* Target: $215 (first target), $210 (extended target).
* Stop-Loss: Above $222.
Directional Bias:
AMZN is range-bound, with a cautiously neutral to bearish bias. A breakout above $227 or breakdown below $217.50 will likely signal the next major move.
Actionable Suggestions:
* For Scalpers: Trade within the $217.50-$227 range until a clear breakout or breakdown occurs.
* For Swing Traders: Monitor key zones around $215-$230 for directional trades.
Disclaimer: This analysis is for educational purposes only and does not constitute financial advice. Always do your own research and manage your risk before trading.


AMAZON: Neutral on 1D signals a buy opportunity.AMAZON is neutral on its 1D technical outlook (RSI = 52.618, MACD = 1.360, ADX = 32.455) and is trading under its 4H MA50. With the long term pattern being a Channel Up and the price already hitting its bottom, this emerges as a medium term buy opportunity. The Channel's pullback has already met the 0.382 Fibonacci retracement condition, which is the level all three prior pullbacks hit before rebounding on a new bullish wave. Those waves hit at least the -0.382 Fibonacci extension on their way up, so that is our target (TP = 247.00).
See how our prior idea has worked out:
## If you like our free content follow our profile to get more daily ideas. ##
## Comments and likes are greatly appreciated. ##

Amazon Stock Analysis: Navigating the Path Between E-Commerce
Amazon Stock Analysis: Navigating the Path Between E-Commerce Strength and Market Volatility
Introduction
Hello, traders and investors! It’s Denis Mikheev from TheWaved™, here to deliver an in-depth analysis of Amazon’s stock (NASDAQ: AMZN). With the help of our premium tools and techniques, we’re diving deep into technical, VSA, and fundamental analysis to uncover the best strategies for the upcoming market movements. Let’s break down what’s happening with AMZN and set clear targets for trading this powerhouse of e-commerce.
Recent Performance and Market Context
Amazon’s current price sits at $219.27, with a noticeable decline from its 2024 absolute high of $233. This 5.89% drop aligns with recent sell-offs driven by macroeconomic headwinds and profit-taking from the December highs.
The stock is trading in a consolidation phase, sitting between strong support zones at $214.99 and $209.11 and resistance levels at $223 and $228. With the broader NASDAQ index displaying mixed momentum, Amazon remains a critical stock to watch.
Support Levels:
-
1. 214.99
2. 209.11
3. 198.78
4. 182.62
5. 177.95
Resistance Levels:
-
1. 214.99
2. 209.11
3. 198.78
4. 182.62
5. 177.95
Powerful Resistance Levels:
-
1. 180.095
2. 151.49
3. 116.04
4. 87.57
Technical Analysis: Key Levels and Trends
Support Levels: 214.99, 209.11, 198.78
Resistance Levels: 223.00, 228.00, 233.00
Key Moving Averages:
- MA50 (Hourly): 220.01
- MA200 (Hourly): 223.16
RSI Insights: The RSI-14 currently reads 52.91, indicating a neutral market condition but leaning towards bullish potential on strong volume signals.
These technical indicators suggest price consolidation, but with bullish potential as the RSI edges upward and MA200 looms as a key dynamic resistance level.
Volume Spread Analysis (VSA): Detecting Market Intentions
Analyzing VSA patterns from recent trading sessions reveals mixed signals. A notable “Buy Volumes Take Over” pattern on January 10 suggested short-term buying strength, but was quickly followed by a reversal due to increased sell volumes. This signals that smart money may be accumulating positions before a larger move.
Price Action and Patterns
On January 6, a strong “Buy Volumes Max” pattern indicated bullish intentions, but resistance at $228.23 capped further growth.
On January 7, a “VSA Sell Pattern 3rd” hinted at a bearish reversal, driving prices back to support levels.
Key takeaway: The interaction between support at $214.99 and resistance at $223 will be pivotal in determining the next directional breakout.
Fundamental Factors to Watch
Amazon’s fundamentals remain strong, with steady revenue growth driven by AWS (cloud services) and robust e-commerce performance during the holiday season. However, rising interest rates and inflationary pressures continue to dampen consumer spending and could act as a headwind.
Trading Plan: Targets and Stop-Loss Levels
Based on the current setup, here’s a practical trading roadmap:
Short-Term Bullish Scenario:
Entry: Above $223 after confirmation of a breakout.
Targets: $228, $233.
Stop-Loss: $220.
Bearish Alternative:
Entry: Below $214 with strong bearish candles.
Targets: $209, $198.78.
Stop-Loss: $217.
Forecast: Where Are We Headed?
In the short term, Amazon is poised for a potential bullish breakout if it clears resistance at $223. However, caution is warranted if macroeconomic conditions shift. Our long-term view remains cautiously optimistic, with a forecast targeting $240+ by Q2 2025 as the broader market stabilizes.
Conclusion and Call to Action
This analysis is powered by TheWaved™, utilizing advanced tools and methodologies. If you have any questions or want a deeper dive into our methods, feel free to reach out via direct messages. Remember, all the professional indicators and insights are available in the profile header. Follow for more ideas, and let’s trade smarter, not harder!
Concept of Rays
Explanation of the "Rays from the Beginning of Movement" Concept
Core Idea
My proprietary analysis method is based on using rays constructed on Fibonacci mathematical and geometric principles. These rays create a system of dynamic levels that help predict precise asset movements and identify key zones where price interactions occur. Price interaction with these rays signals probable scenarios: either a reversal or a continuation of movement, but only after interaction and the appearance of dynamic factors and patterns.
Why Predicting Specific Levels is Not Possible
Financial markets are nonlinear systems, where price movement is determined by numerous variables, including market volumes, liquidity, macroeconomic factors, and participant psychology. Instead of attempting to predict specific levels, I propose analyzing probabilities of price reaction at pre-calculated key zones. Price interaction with rays provides additional insights into the direction and strength of movement.
Stay sharp, trade safe, and may the markets favor your strategy!

AMZN: Testing Support Levels Amid Mixed Signals🔥 LucanInvestor's Strategy:
🩸 Short: Below $215.36, targeting $215 and $205. Weakening MACD momentum and the price nearing the 200-day EMA support the bearish case.
🩸 Long: Above $220.91, targeting $225 and $230. A strong rebound from the 9-day EMA could trigger upside momentum, but it would require notable bullish volume.
🔥 LucanInvestor's Commands:
🩸 Resistance: $220.91 — A key level where rejection has occurred, marking the boundary for bullish recovery.
🩸 Support: $215.36 — A significant level to watch; its breakdown could lead to accelerated selling pressure toward lower targets.
Amazon (AMZN) is in a consolidation phase, with the MACD showing a neutral-to-bearish outlook and price action testing key support near $215. The 9-day EMA is trending below the 200-day EMA, indicating bearish pressure. Volumes remain moderate, signaling caution for both sides.
👑 "When the market hesitates, discipline dominates the game." — LucanInvestor

AMAZON Will Keep Growing! Buy!
Hello,Traders!
AMAZON is trading in a
Strong uptrend along the
Rising support line so
After the retest of the
Support we will be expecting
A further bullish move up
Buy!
Comment and subscribe to help us grow!
Check out other forecasts below too!

AMZN Approaches Resistance! Can Bulls Push Through? Jan. 14Technical Analysis Overview:
4-Hour Chart:
* Trend: AMZN has recently rebounded from its lower trendline, showing early signs of stabilization.
* Indicators:
* EMA (9/21): Price is testing the 9 EMA, while the 21 EMA is still above, acting as dynamic resistance.
* MACD: Displays a potential bullish crossover, but momentum remains weak for now.
30-Minute Chart:
* Price Action:
* Consolidation near $217-$219 indicates a battle between buyers and sellers.
* Resistance lies around $220, coinciding with the highest positive NETGEX level.
* Volume: Volume remains subdued, signaling the need for stronger participation to break resistance.
Key Levels to Watch:
Support Levels:
* $217: Immediate support and gamma level.
* $212.5: Strong PUT support zone.
Resistance Levels:
* $220: Key gamma resistance (highest positive NETGEX level).
* $227.5: Next resistance level, coinciding with GEX7.
* $230-$233: Strong CALL walls, marking major upside barriers.
GEX Insights:
Key Gamma Levels:
* Positive Gamma Walls (Resistance):
* $220: Highest positive NETGEX and immediate resistance.
* $227.5: 57.28% GEX7.
* $230: 83.61% (2nd CALL Wall).
* Negative Gamma Levels (Support):
* $212.5: Significant PUT support (-16.14% GEX).
* $202.5: 3rd PUT Wall (-4.5% GEX).
Options Metrics:
* IVR: 66.2, signaling moderate implied volatility.
* IVx: 37.5, slightly below average, suggesting mild price fluctuations.
* Call/Put Bias: Calls represent 12.3%, highlighting a neutral to bearish sentiment.
Trade Scenarios:
Bullish Scenario:
* Entry: Above $220 with volume confirmation.
* Target: $227.5-$230.
* Stop-Loss: Below $217 to control risk.
Bearish Scenario:
* Entry: Rejection at $220 or failure to sustain above.
* Target: $212.5-$210.
* Stop-Loss: Above $227.5 to avoid extended losses.
Directional Bias:
* The near-term outlook for AMZN hinges on whether it can decisively break above $220. Bulls need strong volume to overcome gamma resistance, while bears will likely defend this level aggressively.
Conclusion:
AMZN is at a critical inflection point around $220. Traders should watch for a breakout or rejection at this level to determine the next move. The gamma landscape highlights $227.5 and $230 as significant resistance zones, with $212.5 providing strong support.
Disclaimer:
This analysis is for educational purposes only and does not constitute financial advice. Always conduct your research and trade responsibly.
