We are now bullish on Abercrombie Abercrombie & Fitch Co., through its subsidiaries, operates as a specialty retailer. The Company operates in two segments, Hollister and Abercrombie. It offers apparel, intimates, personal care products, and accessories for men, women, and kids under the Hollister, Abercrombie & Fitch, abercrombie kids, and Gilly Hicks brand names. As of August 30, 2018, it operated approximately 850 stores in North America, Europe, Asia, and the Middle East. The company sells products through its stores and direct-to-consumer operations; various third-party wholesale, franchise, and licensing arrangements; and e-commerce sites, including abercrombie.com and hollisterco.com. Abercrombie & Fitch Co. was founded in 1892 and is headquartered in New Albany, Ohio.
Abercrombie & Fitch Co trade above its Short-Term Down Trend Line at $21.40 and is currently trading at $21.61.
We are now bullish on this stock and will now execute a long term position trading strategy.
We will execute our first block of trade at $21.67 for our Global Proprietary Equity Fund with an allowance of four(4) times the Daily Average True Range ( 4 x 0.6720=$2.688) below our entry point at $21.67 . This will give us an Exit Price of $18.98 if our bullish analysis is wrong.
This is a long term trade with four(4) price targets, four(4) entries and four(4) percentage(%) Risk. The entries will depends on price action at the support zones.
Price Target 1: $25.00
Price Target 2: $28.66
Price Target 3: $31.25
Price Target 4: $37.50
Information contained herein is not and should not be construed as an offer, solicitation, or recommendation to buy or sell securities. The information has been obtained from sources we believe to be reliable; however no guarantee is made or implied with respect to its accuracy or completeness. The information and content are subject to change without notice.
ANFD trade ideas

Gems in a bear market rally: A familiar pattern in ANF!As I try to let my bullish projections play out , I always find it better to trade single stocks as longs rather than simply trade the futures. If you do it right, you should get a higher bang for your buck. Conversely, in bear markets like these, when it's time to go short you need only to trade the indexes.
Highlighted in the chart is yet another inverse head and shoulders pattern -- this time in ANF. If the pattern plays to fruition, we should see it fill the gap at $25.60
Fundamentally, Abercrombie is in the midst of a 4 year turn around story as it tries to save its brand after falling out of style. It failed to rally over the past 10 years like every other stock on the planet, so we won't find it as levered to market price action as other stocks. Additionally, it recently reported its 5th consecutive quarter of same-store-sales growth. Furthermore, retail names have been rallying on the back of a solid holiday season.
I think we can buy ANF on a breakout of the neckline at $21.30 with a target of $25.50 and a stop at $19.


Buy for 2-4 week reboundHitting support.
Not good to buy and hold through long weekends for traders, but this one will probably take more than a few days to reach its next peak. Expecting to hold for a month. If it starts to dip, will either sell and re-buy at the second level of support or just add to position at second support depending on RSI
Know before you go.

$ANF - Weekly cup and handle!Could see this move aggressively toward ~28.70 as PT. Second leg could push to ~31.81. Short float at 17.45% could lead the charge if price can approach first target breakout.


ANF Earnings and chart analysisI am not sure if the wave pattern will complete itself as there is weaker retail sales in clothing and food (according to US Census Bureau). I am convinced that the company's fundamentals look good. The only dilemma in choosing long position is increased cotton price as well as lower retail sales. If anyone has anything to add, please do so (in the comments)! Comments and positive criticism is much appreciated.
Thank you.

ABERCROMBIE shares Sell IdeaABERCROMBIE shares Sell Idea @Monthly Supply Zone (29.17 - 32.75)
Sell Limit: 29.07
Stop Loss: 33.35
Take Profit: 20.79


ANF: SHORT, big volume but price don´t move higher than max. Doble top, big volume and price can´t reach the previous higher.Overextended, long period bullish.


Turkey moveDo you know the inductivist turkey? He got hurt because he has over-ridden patterns. But this time is different.

ANF Short Idea - "Ambercombie & Fall"Strong downtrend since 2013 got broken
Idea is that longs are trapped and so I'm expecting a pullback
Stop at 22.75
Take profit at 20.78


ANF Entry - Significant Shifting at all time lowRecent events in the industry with sector support are spiking several stock in the retail fashion field, ANF is strategically placed in this time and buyers are showing their interest at all-time-low.
For me, there are enough signs to support the attempt to build a position in the stock.
*Already holding in the fashion sector at AEO which also spiked and moved nicely, linking the trade here.

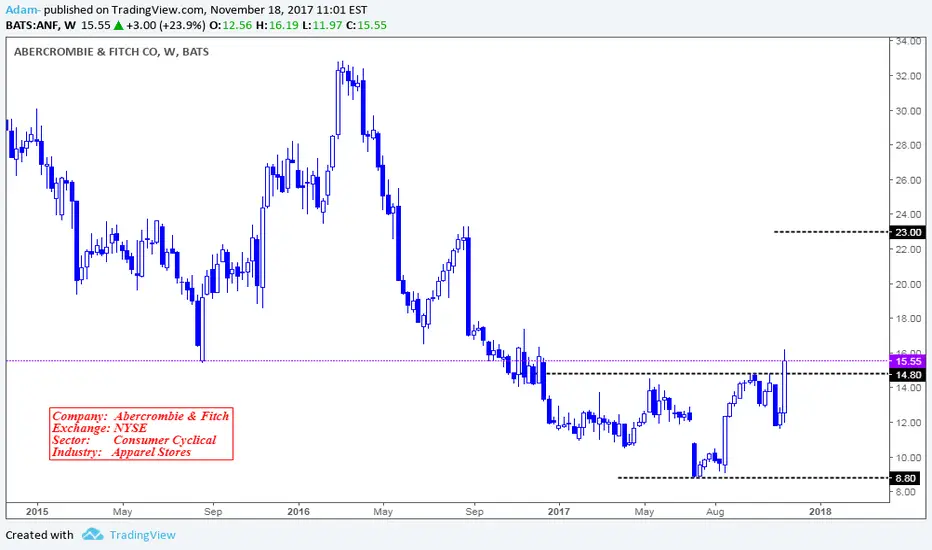
Long IdeaAbercrombie & Fitch Co is a retailer that sells apparel including knit and woven shirts, and graphic t-shirts under Abercrombie & Fitch, Abercrombie kids, and Hollister brands. It operates online stores as well as direct-to-consumer operations. Price chart broken a year long base formation. This could push the stock up to 23 Zone.


Bullish EngulfingBullish engulfing candles indicate immense buying interest that swallows the range of the prior candlestick low and surpasses the candlestick highs. The buying action is frenzied as the candle usually closes at its highs with little to no upper wick. This in turn triggers more buyers who spill over into the next candle. If the next candle closes higher than the bullish engulfing pattern, the next leg of the uptrend usually forms. www.investopedia.com

9.4.17 | ANF | Rising WedgeANF
(Code-Name_Virtue) Minor/Secondary Trend Press Release
Price has completed a Big W chart pattern and is now forming a Rising Wedge chart pattern. There is $.49 of daily volatility left in the Wedge with many strong supply values that price will be trading in if it continues bullish on Tuesday. The consensus is that price is going to reverse bearish this week, it may continue bullish on Tuesday due to the shopping from the holiday weekend however selling the high of tomorrow is sensible speculation.
(Keymaker)
Entry: Sell the high of the intraday chart.
Target: Exit when you're comfortable.
Stop: Use a 1:3 risk reward ratio.
Please scroll down for more charts based on this analysis.
