AXPD trade ideas


AXP - American Express finding support.Depending on the general market, further recovery in AXP off support at 52.00 USD could take it back to 65.00 and 67.43. Should we see declines in Indices I expect a sideways price behaviour in AXP, but as long as 52.00 USD holds I will be cautiously bullish.

Buy the consumer credit dip AXP and Vfibs 50 % and monthly SMA should hold around here for longer term entry, smaller size due to stop far


DOW JONES OVERVIEW: AMERICAN EXPRESS RISKS TO TAG 5-YEAR MEANAmerican Express has fallen below 1st standard devations from quarterly (66-day) and yearly (264-day) means, thus entering short term downtrend
Price is also trading within 1-st standard deviation from 10-year (520-week) and 5-year (260-week) moving averages, meaning that it is in lateral trend on long term basis
If the short term downtrend holds (price trading below 76.4-77.1 levels), there is a high probability to tag 5-year mean at 75 level
Scenario is canceled, if price returns to trend on 10-year basis by spiking above 1st standard deviations from 10-year mean (above 80)

(Live test) - Steve Primo #4 Setups - (Day 3)AXP, SLB, KO, CVX
- A good mix showing short. - No Long Setup

AXP - Topping. Or not?Nope, probably not.
The weekly chart on the left shows a nasty topping pattern, a weird H&S. However, the bearish picture is not sustainable, as the indicators are very oversold, while we are still in an uptrend. Climatic action on the Force Index, climactic volume for the previous week on the volume bar. Price also stands at an important support area, and the breakdown proved false. Until I wont see a clear downtrend, oversold indicators are a buying opportunity. The current oversold condition is not sustainable, and rallies are likely. The impulse is still red.
Now, looking at the daily, the picture is similar, but here there is more information that the sell-off is over. Price made a false breakdown (as outlined also on the weekly) below strong support. What is even more interesting about this is that the breakdown proved false on a Monday, after a gap down, after a bearish Friday. This is one of the best triggers I know (trigger identified by Gary Smith). Further down, there are confirmed bullish divergences on the MACD lines and histogram. The Force Index is extremely oversold and has now climbed back inside the channel, while the volume on the Weis Wave is climactic.
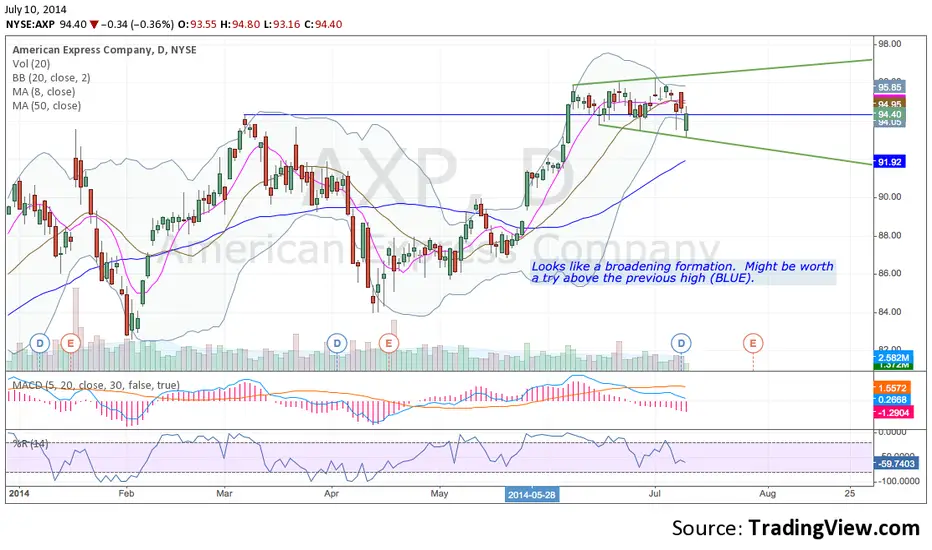
Look for 93$.

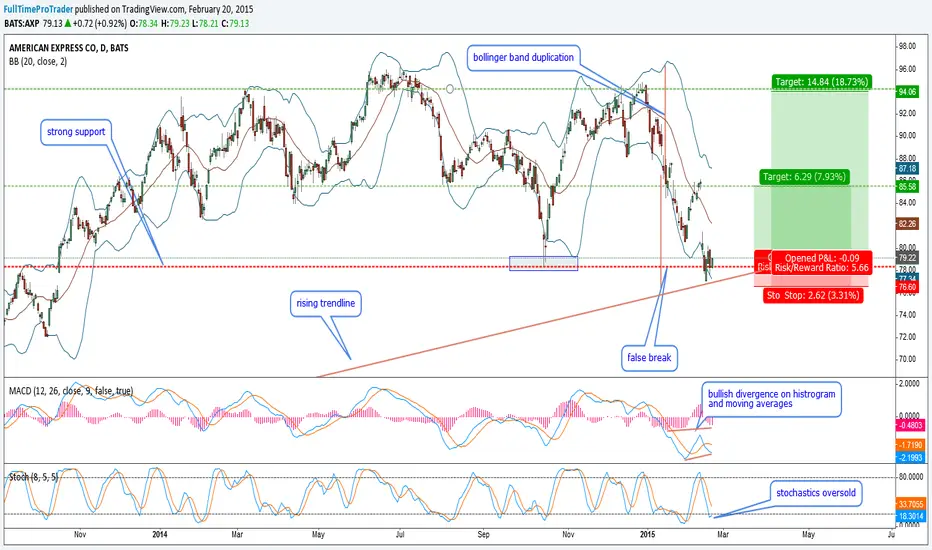
AXP-false breakA classic false break setup.
The fundamental information supports a bullish bias from here.
We have the w1 chart bullish also:
Fundamental review:
***************************
"We rate AMERICAN EXPRESS CO (AXP) a BUY. This is based on the convergence of positive investment measures, which should help this stock outperform the majority of stocks that we rate. The company's strengths can be seen in multiple areas, such as its growth in earnings per share, notable return on equity, increase in net income and reasonable valuation levels. We feel these strengths outweigh the fact that the company has had lackluster performance in the stock itself."
Happy trading
AXPLonger term bullish trade. Buying low, selling high is the plan. Good gap back in 10/13 acting as support.

American Express on the trend line as you can see we are near support area and we have long time divergence which may cause increase the volume in the market and increase the price I think we could enter to low risk long position. it's better to break at least a last swing in lower time frame.

AXP Long Trade Plan Based on DemandWith the S&P trending up and at weekly demand and AXP basically
mirroring it, having pulled back to an objective level of weekly
demand from the pivot low in mid oct 2014 where price
rocketed off. I am hoping that there will be some unfilled
buy orders or a large enough supply/demand imbalance to push price
higher. My entry on this trade will be a tick above 82.35.
Should it trigger I will use a time stop as IMHO if momentum doesn't
step in shortly it probably isn't there.

Potential short opportunity for AXP againFollowing up with the sell-off up til 15 Oct, when AXP make a price lower low, i had posted a bullish divergence on RSI & MACD. My long was triggered at 79 but price dropped to 78.35 before rebounding to 90 at the channel top! Took my profit @ 90.44.
Given that it was a DOJI close on channel top, chances are the price movement has exhausted somehow, though not necessarily mean that i will turn come next Monday. I anticipate some consolidation around the blue region with perhaps more break out
But i am ready to short again for sure. Using a buy put options, i have queued @91, 93, 95 which is subjected to minor changes depending on smaller time frame monitoring

AXP, meeting two resistanceUptrend channel support turned resistance and 200ema are a double resistance..
downtrend channel resistance waiting next

AXP downtrend started in March 2014The current downtrend channel for AXP has crystallized.
The two swing high point in Mar & May had already set the tone for downtrend channel.
Amazing, thats why i love Channel

Low risk High reward?Though RSI & MACD are still in the process of pointing down,
my mind tricked me to see bullish divergence.
So upon exited my short position, i re-enter long. 1st projected target @86

H & S top in AXP is troubling.The bearish chart pattern in AXP could spell trouble for the overall SPY. AXP looks like it wants to sell-off to August 2013 levels. The DAX, and other world markets looks like they are returning to August 2013 levels also. That would imply a move to 170 on the SPY.

0.382 - One of the Fib Key reversal levelAMEX has been on a short term pull back since touching the temporary low of 85.75. After spending two days hovering around and trying to break through 89.75, it was rejected twice.
This 38.2% is one of the potential pull back and reversal level.