AXP Time to breakout 52 weeks high - Nice move and hold support $150 if we keep holding $150 we will breakout 52 weeks
- chart have nice setup $155 - $160 my target love to play AXP always risk reward stop loss under $150 when you trade AXP look the price action easy to expect next move with small time frame
- iam not finical advisor
GOOD LUCK EVERYONE
AXPD trade ideas


Cup and Handle Bull FlagAXP seems to have formed a bull flag while pulling back. Price was recently outside the bollinger bands set on an 80 moving average, which is a bullish signal, but price is drawn back in to the bollinger bands as a rule. Bull flags are formed in a pull back but I have seen them break to the downside recently. Any pattern can fail.
Price did not close over long entry level for the flag today. Price did reach long entry level barely and closed below long entry level.
Price is over long entry level for the cup and handle pattern. Long entry level can be subjective and is an "at or above" type of level. You do want to enter under immediate resistance, but also enter as close to support as you can.
A bull flag is a technical continuation pattern which can be observed in stocks with strong uptrends. The pattern takes shape when the stock retraces by going sideways (or by slowly declining) after an initial big rise in price.
The top trendline is resistance and the bottom trendline is support. Be aware of a break in the bottom trendline as it can signal a break to the downside. A good place for a stop is under the bottom trendline of the flag.
RUN UP - In the first stage, buyers aggressively step in the market, driving prices higher. These buyers then attract other buyers, creating momentum.
CONSOLIDATION - After a while price settles down. This happens because less and less buyers are willing to purchase shares at this point (potential buyers begin to view the stock as too extended). Sellers also begin to come into the market because they don’t want to give up the made gains. When all of this happens, the stock will go into consolidation. It will remain in this phase until more buyers or sellers enter the market and disrupt once again this equilibrium. Even a bull flag can break to the downside. The hope is that it will signal more buyers (o:
The run-up before a bull flag should be a clear, fast and large move with increased volume.
The flag itself should be orderly. A tight flag is best without a lot of space between the candles. A flag should not go on and on for a long time dipping lower and lower. Keep in mind the size of the flag in relation to it's pole. It can not become so long that the pole can not support it. Volume should stay on the low side while the flag is forming as you do not want to see a lot of selling going on during formation. Increased volume during the pole formation and at break out is a good thing.
Not a recommendation
Other traders see the patterns you see. Fighting the urge to see what we want to see verses what is really there can be an obstacle.

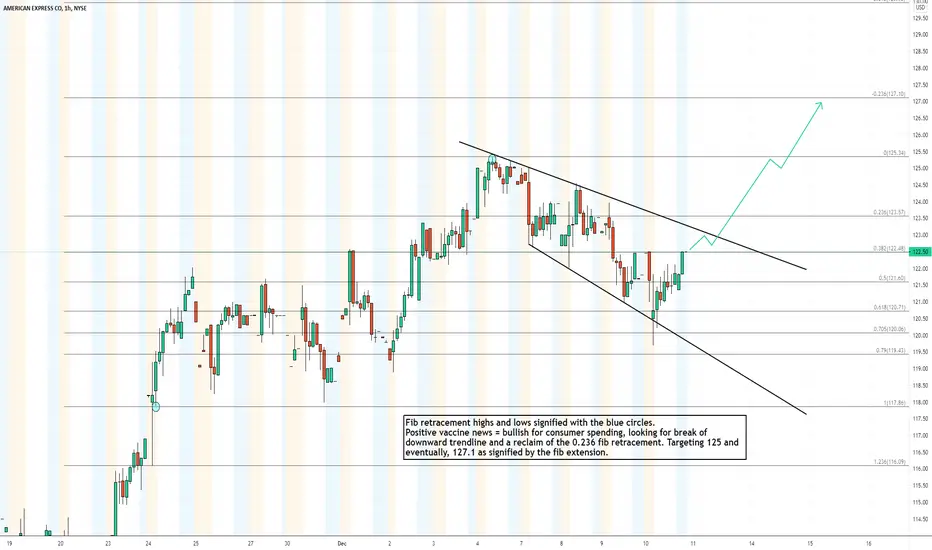
American Express Bounced off trendline (White line) Thursday and broke through downtrend line(yellow line) today with more volume. OBV,MACD and RSI are all curving up.
target is green line

$AXP American Express Trade Setup
Alerts et for a break above the Point of Control (POC)
Channel break today.
RSI crossed above mid-point
Targets price $150

WAVE 5 TARGET 156.75 plus or minus 1 WAVE 4 low ending now . so far the peak at 151.50 area is wave A x 1.272 at the high , but in a wave B of this degree I would look for the target of wave A X 1.382 = 156.75 for a peak in late april to may 11 super cycle peak . I am moving to a net long calls as of this post june july and oct calls

Cup and HandlePrice has broken through upper bollinger band which may inicate a pull back very soon. The bands are set on an 80 moving average verses a 20 MA.
May be best to fight FOMO (fear of missing out) and go long after price gets back inside the bands where they reside as a rule (o:
The handle low (HL) and Mid Cup (MC) can both provide support. In case of an emergency, the top of that gap would be very strong support.
Cup depth of 71.13 is used to calculate targets. I set Long entry a bit above the left cup high, I add the targets to the long entry level verses the left cup high. This could differ depending on how you learned to do this and we are all different. I use the .386, .618 and .786 levels for calculating targets 1, and then above that for longer term targets 2. There is always a possibility of a throwback (when price breaks out but returns below long entry level in a short period of time).
To find handle low, look for a horizontal areaa of consolidation in price. Sometimes there is not really a true handle, but they are nice to have (o:
Some consider this pattern invalidated if the handle low reaches below mid cup.
Not a recommendation

American Express is about to join the trend of large selloff.More sell signals on the daily chart. This time there were many over the past few days for American Express. I was hesitant to call this one a sell after its activity on Friday, but the historical statistics agreed there is plenty more downside. This downside coupled with multiple agreements throughout the rest of the U.S. overbought markets further helped convince me the SELL signals from Friday's close are still valid.
I have plotted all of the potential delays to the actual sell off followed by the potential target bottoms. All of these targets and days are based off of historical median and average price action when each signal triggers a SELL on the Daily chart. I received many major SELLs on Friday which is quite the confluence of future activities. I selected NOK, CAT, and AXP as there was a large amount of agreement across the timeframes. Last week was rough and preceded by a bearish MACD cross on the S&P 500 index. All of these signals taken together could spell a 20% correction in the near future. I can understand parallel sell signals in the defense and industrial equipment sectors, but the inclusion of AXP makes me think the market is about to get dropped quite a few pegs. Based on our more recent 5-10-20% drops, this one could be quick and preceded by the same unorthodox recoveries.
The historical figures and reasons for each target are posted as always on my website in the signature block. Feel free to follow as we post new articles nearly everyday.

American Express (AXP) ConsolidationI am not licensed or certified by any individual or institution to give financial or investment advice.
I think American Express could be in a possible roll/consolidation. I have my horizontal Resistance and Support drawn with the orange lines. Key takeaways are the S&P 500, Nasdaq, Dow (to which AXP belongs), and Russell 2000 are all at Uptrend Resistance; and AXP itself is at what I see as its own Resistance as well as forming a Double Top/M. These technical indicators lead me to believe AXP is ready to begin going down. If you are an options trader you may want to decide if it's worth getting into some bearish positions. If you deal strictly with shares this may be a good time to consolidate your cash and prepare it for buying a dip near Support, either to set up for a short term rolling trade strategy or to buy for mid to long term investing purposes.
Rolling patterns may present good opportunities for double dipping if you are an options trader. Puts going down and Calls going up. That's up to you. I don't currently own any positions in AXP.
Let me know what you think, or if you have any questions.


$AXP - watching $120 areaI have alerts at $120, with a plan to ride it up to $130
What are your thoughts?
I have left my original prediction from December, and while my drawing is not exact, it is not that far off.
They had positive earnings juxtaposed the prior earnings report.

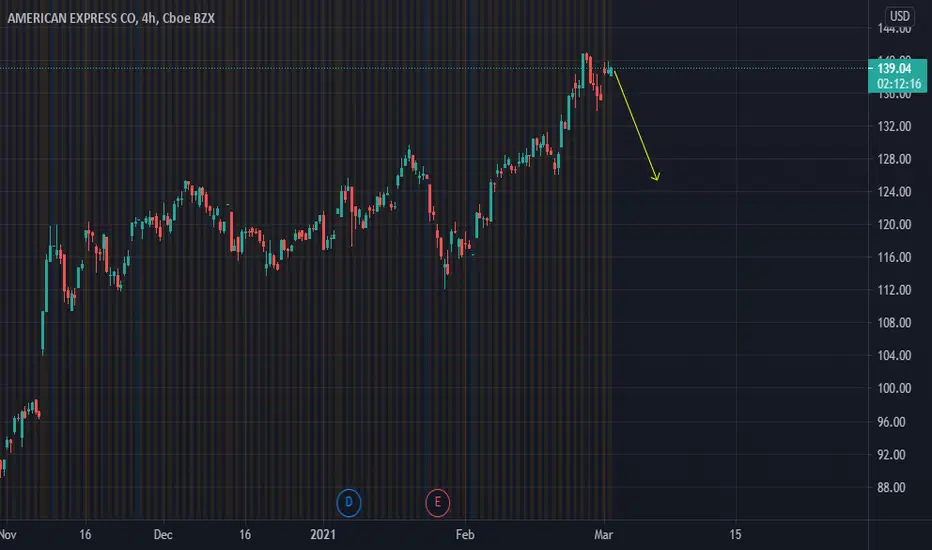
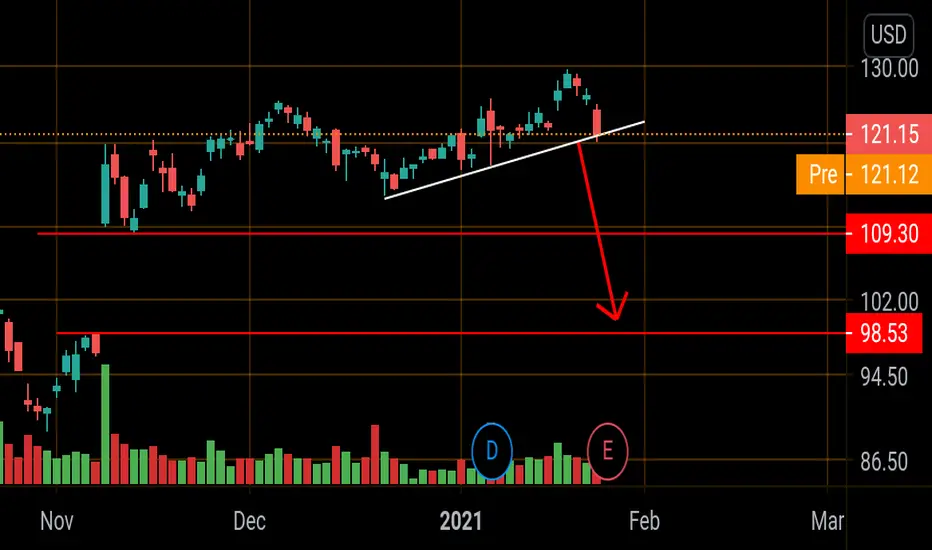
Short it AMEXFlopped on earnings.. fell of of support (Whiteline) and 100DMA premarket.
first target is 109 which is the double top leg.
second target is closing that gap at 98

Buy American Express 14/1/2021American Express is moving in a short-term up trend
The stock is testing EMA 13 so you can buy
Target 131.3 Stop losses 113.54

Long | AXPNYSE:AXP
Possible Scenario: LONG
Price target: 124 until 8th Jan 2021
Evidence: Price Action
This is my idea and could be wrong 100%.


$AXP has officially Left the Station, Starting to Scale OutI have been holding $AXP for awhile now. Bought in @ $96 , now starting to scale out of my position.
Earnings should be January 21st premarket
This is not financial advice, just a random idea!

$AXP posting slightly less than expected earnings $AXP posted slightly less than expected earnings, with the PEAD projecting a neutral outlook for the stock. currently price is trading around the lower boundary of the projected PEAD cone.
