Buy $BA - NRPicks 08 AprThe Boeing Company designs, develops, manufactures, sells, services and supports commercial aircraft, military aircraft, satellites, missile defense, human space flight and launch systems and services worldwide. It operates through four segments: Commercial Airplanes; Defense, Space and Security; Global Services; and Boeing Capital.
Revenue TTM 62B
EBITDA TTM 1.4B
P/S 1.69
BAD trade ideas

$BA Boeing Bullish Shark/CypherNo real divergence here on the weekly chart but a real nice harmonic formation. Possibly setting for a dragon style double bottom.
Generally you would expect to see an 886 to 1.13 extension from the lows on this type of setup. but id personally take it level by level considering the sector.

BA 7/11/2022No fly zone.
BA is currently in a downtrend with 50 ema acting as Dynamic Resistance
Price has touched a low of 114
Price has pulled back found resistance at 141 and 50ema
We currently have Stochastic coming off an Over-bought signal.
Downtrend + Pullback to Resistance + Overbought Stochastic = Short trade
It doesn’t get old.
Entering trade short.
Entry: 134.95
Stop loss: 147.64 (-9.40%)
Target: 114.43, +15.21%, 1.62 RR ratio

Boeing | Fundamental Analysis | Long May was a very good month for Boeing: the company returned to space with a (mostly) successful test flight of its CST-100 Starliner crewless spacecraft. Of course, SpaceX still has the edge over Boeing in manned spaceflight: since conducting its own crewless test flight in 2019, the company has put 25 people into orbit, compared to Boeing's zero.
But Boeing is looking to close the gap with SpaceX - possibly as early as this year - and set itself up to start generating revenue from manned flights in the future.
Boeing's OFT-2 test flight in May was the culmination of more than two years of work to get the Starliner up and running. While the crewless flight didn't go entirely smoothly, it was close enough that last month NASA confidently designated two astronauts -- crew chief Barry "Butch" Wilmore and pilot Sunny Williams -- to fly the Starliner in the upcoming Crew Test Flight (CFT).
NASA has not given a specific date for the CFT as it is still evaluating data from OFT-2. However, the space agency's internal calendar reportedly has a launch date of December 8. According to Ars Technica, there is at least "a reasonable probability that Starliner will make its second flight this year." And NASA has promised to help clarify that in a "launch schedule estimate" by the end of July.
Above all, it will be a big PR win for Boeing. It will allow the company to claim that, like SpaceX, Boeing is also a space company with a human-rated craft capable of flying to the International Space Station, to future private space stations that could be launched into orbit, or even theoretically to the moon. The Starliner's 390-cubic-foot crew compartment is near twice the size of the Apollo capsule, which regularly went to the moon in the 1960s and 1970s. While SpaceX will certainly remain the leader in terms of missions completed to date, in some ways Boeing will successfully "catch up" with SpaceX in this particular space race.
A successful CFT mission would also allow Boeing to receive the remainder of the $4.2 billion the company received in 2014 to develop the Starliner, a test flight, and six working flights with a crew to the ISS.
However, the CFT likely won't help Boeing win a few more crewed missions from NASA. When NASA gave SpaceX the first three additional crewed flights last year and then five more flights in June, it essentially maximized its crew transportation needs to the ISS until the end of the space station's lifespan, which is expected to expire in 2030.
While it is possible that NASA will find reasons to send additional astronauts to the ISS over the next eight years -- or that it may extend the life of the ISS beyond 2030, which would require additional flights -- at this point, Boeing cannot expect to get new flights to the space station. That means the company must get lucky if it wants to find more work (and more revenue) for Starliner. Either Boeing has to cross its fingers and hopes NASA finds a need for more flights to the ISS, or Boeing has to find new customers who need a manned spacecraft.
Where can such customers be found? There are three options. First, Boeing could approach Axiom Space with an offer to service that company's planned future space station. Axiom already has close ties with SpaceX, which could make that offer difficult to make. On the other hand, Boeing is already Jeff Bezos' partner in the Orbital Reef space station project, and if that project ever comes to fruition, Orbital Reef would be a logical destination for future Starliner flights.
Alternatively, Boeing could do as SpaceX did and become its own customer. Once the Starliner is deemed safe for human spaceflight, there is no reason why Boeing should not take the example of Virgin Galactic, Blue Origin, and SpaceX and offer space tourists to go into orbit aboard the Starliner as part of paid spaceflight. After all, when SpaceX flew its private Inspiration4 space tourist mission, it was rumored to have raised as much as $200 million to fly four space tourists.
Of course, how big the market is for $50 million space tourism tickets remains an open question, but since only two companies are capable of providing such a service right now, and Boeing is going to be one of them, this may be the most convenient avenue for expanding Boeing's new manned spaceflight program.

Charts showing BA Long Boeing in the news on new Aircraft Contract orders so I am Long for this week on Boeing Aircraft.

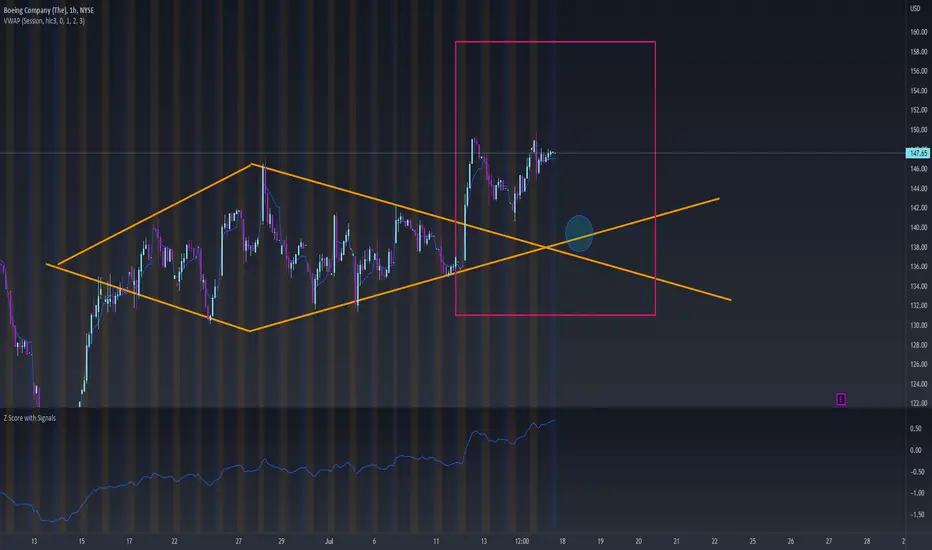
BA: Short vs Long? Expectations for next week Don't be too quick to short this.
While the chart may look bearish, BA is hands down gaining momentum and interest. There are some telling signs here that I will briefly go over but let's recap:
Recap:
- BA rallied on news last week, gaining roughly over 8% in 1 day and making an attempt to break out of the weekly trading range (the green box with a cap of around 148).
- BA rejected being out of its trading range (this was my swing short this week, shorting its break down back into the trading range) and came tumbling back into range only to make another running attempt to break out, but again, being met with rejection.
Likely Trajectory for BA:
I am NOT overly short biased here. Chart does seem kind of bearish at first glance but I am not convinced. And here is why:
- BA ran up roughly over 8% on a good news day, to give roughly 4% of those gains back the next day and then climb AND CLOSE, and I repeat AND CLOSE, regaining 4% the following day. This is not the behavior of a bearish stock, imo.
- BA has seen massive rejection of the lower 110s. I was a little greedy, hoping for a touch in 94 where I could literally buy hundreds of BA shares and just live my life happy until retirement. Alas, this never came. And so people seem to be catching on that maybe this pipe dream of BA in the double digits may not be realized and are scaling back into their buy and hold positions (not to say that BA won't see the double digits, I just think that right now I am seeing a lot of both traders and investors stepping in. You can see it in the chart.)
- Lot of interest in BA 160 calls. My view of option data is meh, but its just an interesting number to see.
- BA attempted to break down from diamond top only to get immediately rejected and bought back up.
Next Week Range:
(Displayed in Red Box)
Next week range has seen bullish divergence. If this were SPY I would say that means SHORT! LOL! But who knows what it means with BA; anyway, next week range:
131 - 159
Just based on the projections for next week, a HARD BUY area would probably be around 139 or lower, a hard sell area would be 158 or higher. Depending on your time frame. I wouldn't be short biased here though, like I said, and I would be inclined to be on the long side of things. But note, I am super biased with BA. I am a BA moon boy so don't listen to me.
Technicals and Chart:
(Main chart above)
BA is flagging in a little mini bird or bearish bat type pattern and I do expect pullback. My ideal pullback zone is marked in the chart with the circle, which also corresponds with the projected buy zone of 139.
A bounce here, IMO, would be a very good sign and a buy.
A break here would invalidate my bullish bias and likely bring us to the bottom of the 131 range.
Key Points:
- Range next week 131 - 159; bullish divergence from the previous range 125 - 148.
- Expecting some pullback but not overly short biased here.
- Look for a break below 139 if you are short biased.
- Look for a bounce at 139 to 141 if you are long biased.
That's it!
Trade safe, let me know your comments/questions and critiques below.
Thanks for reading.

Diamond Top if I ever Saw one This is pretty self explanatory.
A diamond top if I ever saw one.
BA has been bullish lately but it seems like it may be winding down for a bit of a drop.
SAS predicted trading range for this week is 124 - 148.
Will be looking to actually swing this short I think. I think we may end up seeing a bit of a gap down on Monday, we will see where that brings us in relation to the trading range and the diamond pattern.
Alternatively, one could technically argue that this is a bull pennant and it could very well break out to the upside. In that case, I would be looking to see how it treats 148 and tempted to enter short here for a quick swing.
My thoughts, not advice. BA is always a wild card. My general advice is to just avoid it, but because I am a stan I find it hard to do.
Trade safe everyone!

BA - Double Bottom Potential On this daily timeframe a double bottom has presented itself
The solid white line is a dominant trend line
The dashed white line is where I expect the second bottom to form
Bullish


BA lookin like a short. Hey everybody, welcome back to my ideas.
As you can see we are shorting BA.
Price broke out of the long term down channel and was recently rejected on retest.
Yesterday it was also rejected on the second retest by the down channel and a long term S/R level and is now looking to form a double top.
To top it off, yesterday closed with a nice doji candlestick.
My confidence level here is 4/5
Let me know what you think in the comments.
*This is not advice

(Boeing) BA Short
I believe we could see a short term price decline in the BA stock. This might be a good opportunity for a short term bearish/short trade through stocks or options. The price has been on a long term downtrend, since approximately Nov 2021. Making Lower Highs and Lower Lows.
I have attached an image here of the BA chart on Daily candles, along with several indicators that give us high probability of a bearish price action.
Through my analysis, I see the following:
1. BA June 28th 2022 price action created a Bearish Hammer
The price opened at $140.89. After the open the price went up to the daily high of $147.18. At the high the price hit the top Bollinger band where it bounced off and reversed towards the downside. The bears then drove the price down to the daily low of $138.54 and shortly closed near the day's low at $138.70. The price closed below the open price signifying that the bears have won for the day.
2. The Bearish candlestick pattern is cutting through 3 key resistance levels.
- (Resistance 1) The Bearish Candle is cutting through the key moving average at which point the BA price has rebounded from in the past, as per the circles areas in the chart with arrows pointing to them. This MA served as a resistance several times in the past and it is where the wick of the bearish hammer candle is now.
- (Resistance 2) The Bearish Candle is cutting through the horizontal resistance shown by the blue dashed line.
- (Resistance 3) The Bearish Candle is cutting through the top Bollinger band, which is a resistance point and indicated the the price is overbought.
3. The Stochastic are showing an overbought condition, and in addition the black stochastic line just went below the red stochastic line, indicating a short term bearish price action is possible/likely.
I intend to enter the short trade and have 2 target profits in mind, marked by TP 1 (@ approx $131) and TP 2 (@ approx $131) in green lines on the chart. This will depend on the risk:reward ratio and aggressiveness of the bearish price action.
It is worthy to note that BA made a high high on this last bullish wave, however in order to confirm the short term trend change, we would need to get a high low next (hopefully at TP 2 price level point, which is also resting on the lower Bollinger band).
This is just my analysis and created for entertainment purposes. This is not and should not be taken as investment advice. I am not recommending this as a trade to anyone. Please do your own research and make your own decisions.

BA and WTZ4+Dbl. BottomFor Boeing Company, I apply WTZ4 for the setup together with my favorite price pattern. RRR of this trade is so attractive. Enjoy your trading.

Pull Back Fishing? /Earnings 7-27 BMOBA will announce earnings Monday before the market opens.
From what I read, analysts are not predicting an earnings beat. Zack, whoever he is, says it is a strong sell.
Sometimes the reaction to the news is more important than the news itself.
BA is above a strong support level of 113.02. The channel BA is traveling in appears to be broadening. Possible horizontal trading channel forming.
BA fell below the Bollinger Bands set on an 80 DMA, and popped back inside. When a security is below the bands it can also serve as an oversold signal.
It looks like price is at a resistance level and trying hard to get past it.
This is a tough market for securities to get out of a hole, but I it is hard to think of this country without this stock, so I would doubt it is going anywhere.
Possible recent bullish divergence between price and RSI.
No recommendation.
Percentage of Shares Shorted: 1.81%
Short Interest Ratio / Days to Cover: 1.1
The short interest ratio, also known as the "days to cover ratio", is calculated by dividing the number of shares of a stock sold short divided by its average trading volume. A short interest ratio ranging between 1 and 4 generally indicates strong positive sentiment about a stock and a lack of short sellers. A short interest ratio of 10 or greater indicates strong pessimism about a stock. Boeing currently has a short interest ratio of 1.1.
What is the short interest of other stocks in this industry: Honeywell International Inc. (0.83%), Lockheed Martin Co. (1.11%), Northrop Grumman Co. (1.33%), General Dynamics Co. (1.36%), TransDigm Group Incorporated (2.23%), HEICO Co. (6.36%), Teledyne Technologies Incorporated (1.68%), Textron Inc. (2.39%), Huntington Ingalls Industries, Inc. (2.17%), and Curtiss-Wright Co. (2.36%).
Boeing saw a decline in short interest in May. As of May 31st, there was short interest totaling 10,720,000 shares, a decline of 5.5% from the previous total of 11,340,000 shares. Changes in short volume can be used to identify positive and negative investor sentiment.
The market can remain irrational longer than you can stay solvent.

BAI think the probability of a big weekly candle for BA this week is high. Rejected the supply zone today but volume was relatively low compared to the last few days (kinda surprising to me given the gap up open above Friday's high). Bullish above the supply zone, bearish below today's low. Wouldn't be surprised to see a $20 move from here in either direction.

Fairly Straight Forward TradeBA was in a bull pennant, it broke out today and then immediately rejected some overhead resistance. It also has some strong mathematical resistance on the Z-Score (shown by the pink line on the Z-Score indicator).
Its in a broader wedge type pattern IMO (see the chart above; lines in green).
BA all around is a hot mess. Its math chart is just atrocious and thus it does not respond well to time series modelling (however, my previous time series targets on BA actually were spot on, which is nice, but I under-estimated where it would bounce). BA has constantly been hampered and sold down and has had a rocky history owning to it being a company that is so terribly managed and mishandled (yet I still stan it).
Thus, I generally need to go old school with BA and in between using the Z-Score, I generally need to rely 95% on the chart.
BA, like RTX, seems to be fairly immune to the market dramas. Yes BA sold off, but like, it was selling off all through 2021 as well. It wasn't really participating in the massive bull run that the whole market was participating in. Defense in general seems to be fairly strong (check out ITA which, of course is selling off, but not to the extent of the rest of the market). It is possible that they get caught up in the broader market panic and selling but I am just not seeing it right now.
This will end 1 of two ways, either we see BA work up the strength to break above that overhead resistance on Tuesday, in which case its a long (green candle) OR, we see rejection, in which case, it would be safe to short back down to the bottom of the wedge (red candle).
At this point, I am neutral on BA but Tuesday will tell which position BA is looking to give us.
My thoughts and opinions.
Leave your comments/questions and critiques below!

BOS RecapBreak of structure to the upside.
Waited for pullback on 15min and brought calls in continuation.
Made $1K on this trade.
It's important to stick to the same process wait for pullback after the move is made on 30min or 15min depending on how quick the price is moving.
Risk reward is Key. This trade allowed me to control my account and not end the day in the RED. Yes, there will be some trades that will hit your stops (ALWAYS Honor your stops) for every $700 I give to the market it pays me back over $2100 more than 50% of the time. even if it's less than 50% this is still a solid business plan with(2-3HRs) of chart time daily.
It's important to work on the discipline and skills that will allow you to build a life of Freedom!


Houston. We are ready for lift offInteresting chart.
A hold from the 45 degree of previous bottom would make this a bullish chart.

BA: Simple Trade IdeaIf you look at my previous posts on BA, this entire selloff of this stock was to be expected. Boeing CEO just released a press update expecting the industry to be bullish going forward, so I would be long BA at these levels for the short term being that we are sitting on support.
Not financial advice

Missed the entry, BUTScrolling through the big option players and caught BA on an up trend. All signs point to a continuation. I'm getting long on this play on Monday 6/6/22. This has easy momentum to 155. It's below quarterly VWAP. The Volume Profile is weak at the current price. Going to look for price to clear 141 for entry and set 140.70 as my stop. This may come back and flag a bit before it continues up so I don't want to ride that wave. If I stop out no problem I'll wait for another entry.

hindsight 20/20looking back on some ideas I posted over a year ago. Among the highlights, are almost exactly as predicted. BA will be nice for the picking when it actually bottoms out in another year or so.

BA, shortThe following projection is only my personal opinion
It cannot be construed as a BUY/Sell call.
Ever since the COVID19 started in 2020, Boeing has been thrashed like no tomorrow once.
This is compounded by the fact that its safety record wasnt that good with many violations.
The support zone of 75 - 100 is crucial in mid term.
If this cant hold, geometrically, price could cut through all the way (not in straight line)
within next 1-2 years.
