CCL Bull Flag PatternIt looks like there is a bull flag pattern formed on CCL. If it breaks out soon, which in my opinion is likely, it should reach approximately 67.70. The Ichimoku Cloud also looks promising, so I think it's safe to say that CCL is going to be moving upwards in the near future.
CCLD trade ideas

Clear Perfect SetUp - Trend + DivergenceClear ideal SetUp with Trend + Hidden Divergence + Pullback to pas Support.

CCL- Are Options Your Answer?Only way in VIEW to trade earnings, is make sure that you set up trades the day before. Use iron condors, strangles, straddles. Why? because most of the time you have no clue which direction price action will go after earnings, in the long term. Example of a $56.00 - $ 60.00 straddle. You get a premium or credit and profit from trade (your reward) & your maximum loss would be at stop lost of $3.00 ($56.00) if hit or $300.00. The best lengths to trade monthly contracts is 45 to 65 days to expiry. Short weekly options, can be done, but like always they are harder and have less room for error then longer ones.
The chart is example of how an long call option play could have been done to capture $7.28, per share profit as of today.
Options entries and initial setups of trades are the KEY, to playing STOCK EARNINGS.
Very good website is: stocksearning.com

WHAT ABOUT A NICE SHORT TRADE ON CCL STOCK?Carnival corporation has been in a huge rally but lately we can see some signs of fatigue that we cannot ignore.
TECHNICALLY OBSEEVATIONS
1.CCL stock seems to respect well the 1,618 Fibonacci extension as you can see it moves at those levels after every pulback.(I didn't do it for every pull back to keep the chart clean but you can try it,it works almost for every swing)
2.We can see also bearish divergence in MACD strategy and price levels.
3.We have also RSI bearish divergence.
4.We can see also that the hidden bullish divergence we had at STOCHASTICS now is not existing as price and stochastics made both higher highs.That's a sign bulls are losing strength.
5.We can also notice that the top trend line of the ascending channel coincides with the 1,618 Fibonacci extension of the last pull back.
POSSIBLE TRADE
BUY STOP AT 67.70$
ENTRY PRICE WITH PENDING ORDER AT 66$
FIRST TARGET T1 AT 63.50$
SECOND TARGET T2 AT 60$
THANK YOU FOR SUPPORT!
HAPPY TRADING GUYS!

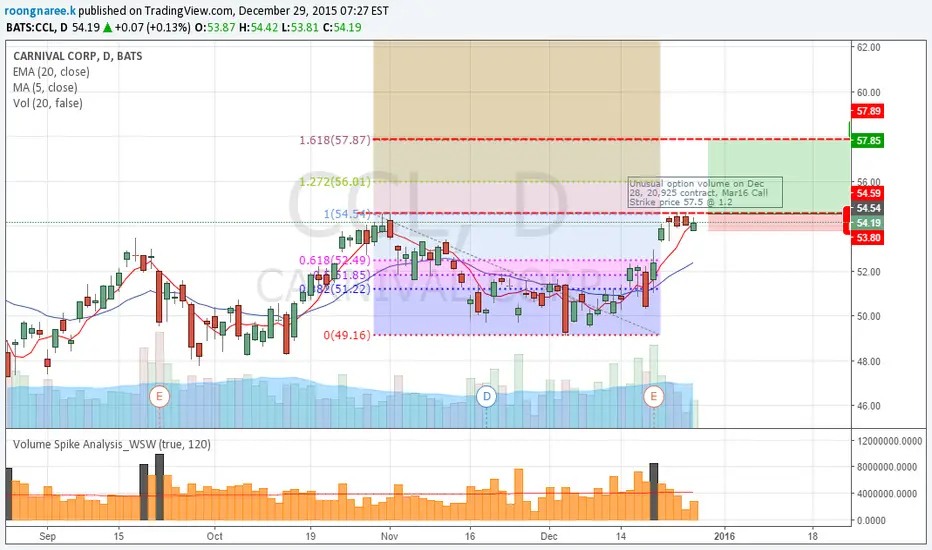
Signs of divergence: Get exposed to earnings disappointment.CCL SHOWING DIVERGENT SIGNS:
- Long and short term negative trends, while the medium term is still up trending;
- Golden cross in mid November suggesting upside on the uptrend;
- Multiple rejections at/above 53 suggesting more downside;
- Down trending MACD and RSI;
- Mildly positive consensus (closer to a HOLD);
- Some 10% upside on the consensus target price;
- Downgrade this day by a broker ahead of earnings tomorrow.
GET MEASURED-RISK EXPOSURE TO EARNINGS DISAPPOINTMENT:
- Buy Jan '17 $50/$49 put at $1.35/$0.95 (indicative);
- Sell Jan '17 $44 put at $0.20 (indicative) to mitigate the cost of the strategy.
COMPELLING REWARD/RISK
Targets down: 46 / 44 / 40
Max loss (assuming 49/44 put spread): $0.75/share

Buy Signal for Carnival Corp - Marketbreadth is greenMoneyHour$-Breather signals a Buy for CCL - always use a Stop Loss with 8% and wait for Sell signal of my Breather
My Market Breadth calculation shows a positive (green) environment


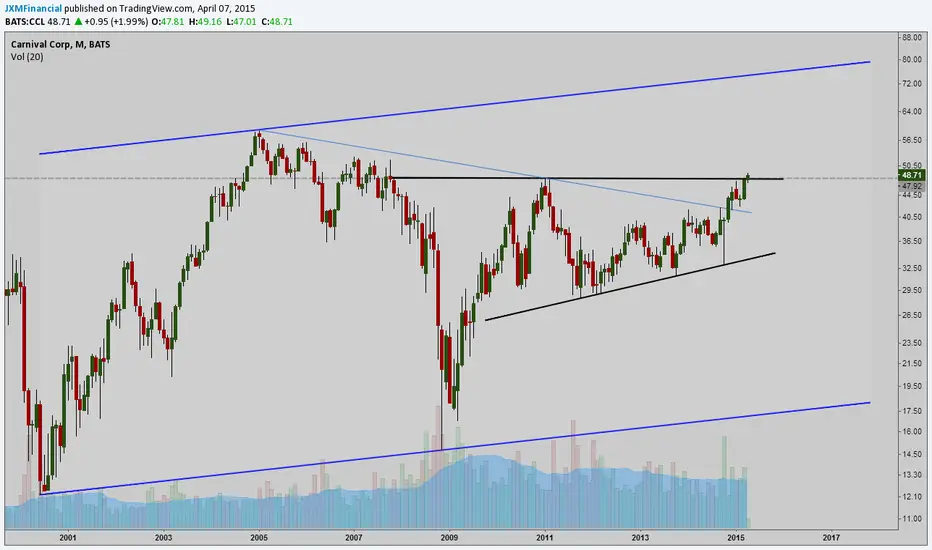
Big Diamond Pattern Atop Carnival Cruise CorpBig Diamond Pattern Atop Carnival Cruise Corp
When forecasting you have to take a lot of information into consideration, you have to also find the needed information to make a forecast.
What we know in the short term, Carnival Corp CCL, average analyst stock price estimates post Q2 earnings - June 28 - was $60.50 and high estimate for 2016 of $80. Brexit aftermath has slowed stock momentum and was in an industry that was hardest hit other than global banks. If Carnival does infact beat estimates, which it has solidly for nearly two years straight, we could be in a big surprise to the upside.
Long term, estimates for all corporate earnings are extremely overpriced. 2017 is expected to price nearly a 20% rise in earnings for the S&P 500. With the Federal Reserve and rating agencies ready to revise these numbers early next year, along with analyst revisions, this could be a disaster for US stocks in 2017.
Diamond Pattern
We can't always assume which direction the diamond pattern will follow, but we do know that massive volatility will shoot out of the pattern once a diamond pattern is completed. Studies have shown Diamond Patterns are the best patterns to forecast future volatility. Diamond Patterns shape have also proven to slightly improve long term forecast, but not always short term forecast. Short term direction after the patterns has completed, may not always be the ultimate direction the pattern wants to go. Often Diamonds shoot out fast head fakes in the short term, while the direction of the diamond has been pointing to a direction opposite of the head fake. So traders need to take into consideration short term vs long term, when studying the diamonds direction (red arrows on chart point to downward momentum).


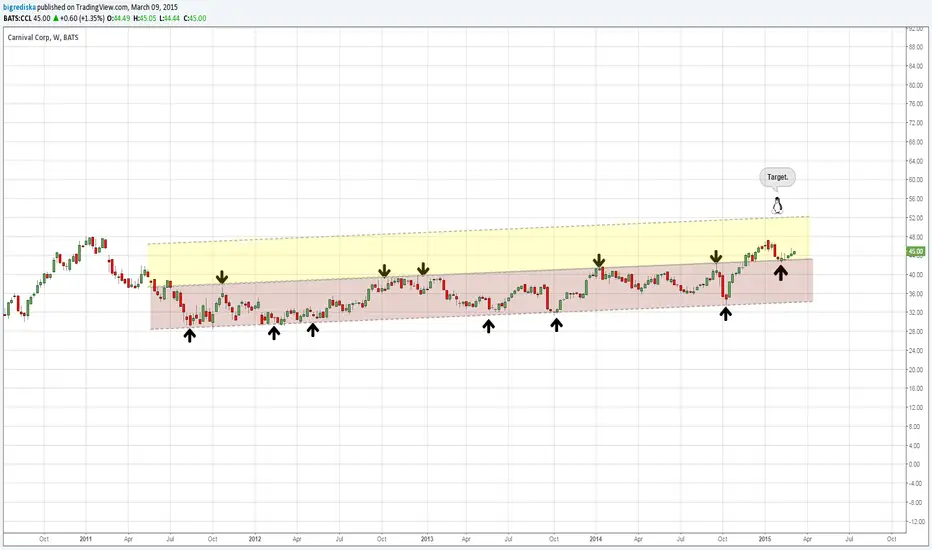
Carnival Corp Weekly Long Taking this 5R long here for 3 primary reasons:
1. Net exposure is to the downside, this looks like a nice counterbalance with oil in the dumps
2. Active weekly RE Buy after a RE from the 15W mode
3. Price has pulled back to a key earnings level, with another one $1.50 below it,
which should act as a level where strong buying pressure will arrive.
GL!


Not just Swings and Roundabouts for CarnivalPost earnings confirmed move up. OTM call with accumulation on a break of $42
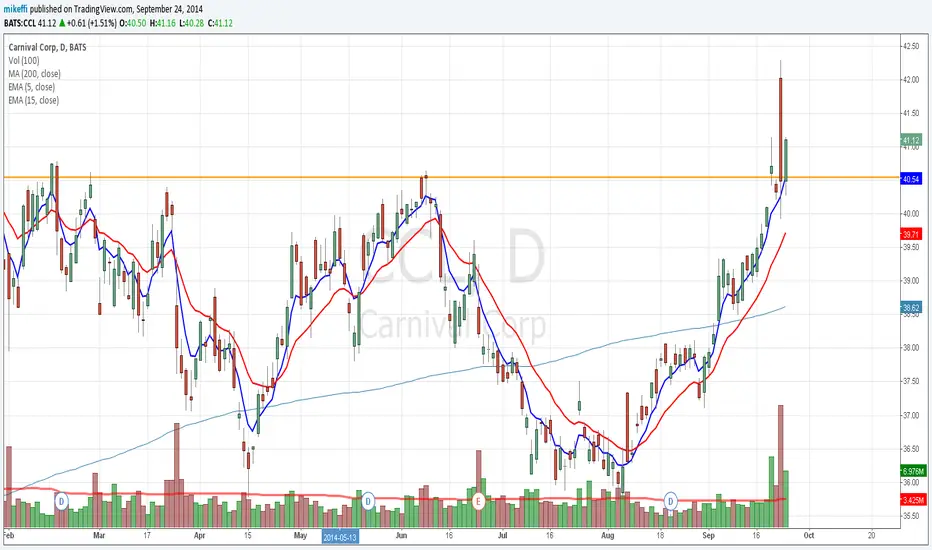

CCL LongCCL Long
Entry Price - $36.00 - $36.50
Target - $37.50
Daily stochastics oversold price action in high trough than previous
High selling volume but not much decline
