COINBASE Stock Chart Fibonacci Analysis 031025Trading Idea
1) Find a FIBO slingshot
2) Check FIBO 61.80% level
3) Entry Point > 166/61.80%
Chart time frame: D
A) 15 min(1W-3M)
B) 1 hr(3M-6M)
C) 4 hr(6M-1year)
D) 1 day(1-3years)
Stock progress: C
A) Keep rising over 61.80% resistance
B) 61.80% resistance
C) 61.80% support
D) Hit the bottom
E) Hit the top
Stocks rise as they rise from support and fall from resistance. Our goal is to find a low support point and enter. It can be referred to as buying at the pullback point. The pullback point can be found with a Fibonacci extension of 61.80%. This is a step to find entry level. 1) Find a triangle (Fibonacci Speed Fan Line) that connects the high (resistance) and low (support) points of the stock in progress, where it is continuously expressed as a Slingshot, 2) and create a Fibonacci extension level for the first rising wave from the start point of slingshot pattern.
When the current price goes over 61.80% level , that can be a good entry point, especially if the SMA 100 and 200 curves are gathered together at 61.80%, it is a very good entry point.
As a great help, tradingview provides these Fibonacci speed fan lines and extension levels with ease. So if you use the Fibonacci fan line, the extension level, and the SMA 100/200 curve well, you can find an entry point for the stock market. At least you have to enter at this low point to avoid trading failure, and if you are skilled at entering this low point, with fibonacci6180 technique, your reading skill to chart will be greatly improved.
If you want to do day trading, please set the time frame to 5 minutes or 15 minutes, and you will see many of the low point of rising stocks.
If want to prefer long term range trading, you can set the time frame to 1 hr or 1 day.
COIND trade ideas

Seems that a bounce may take place soonFrom the chart of COIN, it is near the long-term upward supporting trendline. A bounce may take place soon. Based on its trading range, it may head toward US$250 if this support trendline manages to hold its ground.

$COIN - pocket full of coins or out of coins?CAPITALCOM:COIN has dropped from $349 to currently $218 over the last three days, but seems to maybe have settled at the support in this area. Working on a bounce up from support, and MACD looks to maybe cross up and RSI has crossed up. Might be time to consider a long, my target is $300. The three candles since the bounce have been long-tailed, indicating buying interest. Of course, considering CAPITALCOM:COIN one must also look at CAPITALCOM:BTCUSD as they tend to move in tandem.

COINWe are going to invest in Coinbase shares, aiming for a 50% gain before the end of April. Good luck to everyone!

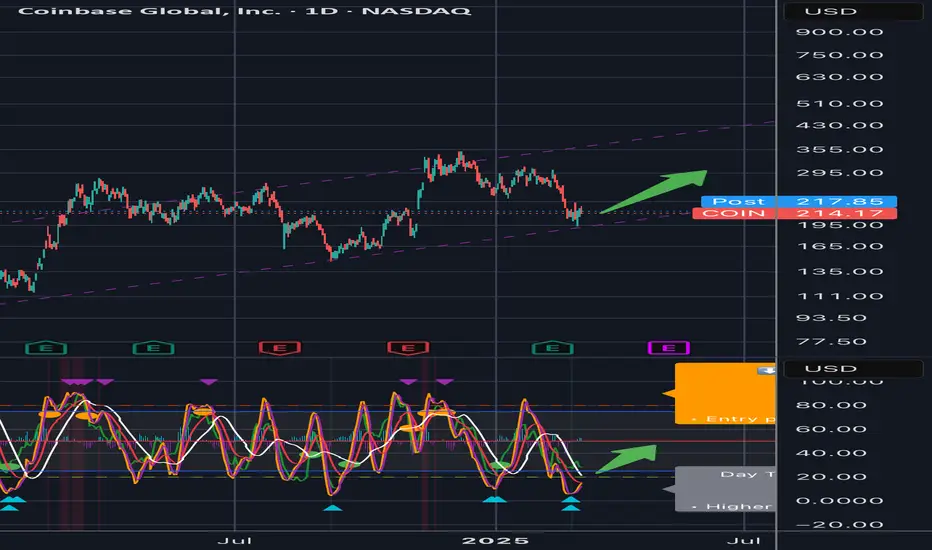
Bottom is in IMHO - Long term bullish COIN game plan # **Coinbase (COIN) – Technical Analysis**
## **Current Market Overview**
- **Price:** $214.17
- **Trend:** Bullish within an **ascending channel**
- **Support Zone:** $200 - $205 (Trendline Support)
- **Resistance Levels:**
- **Short-Term:** $230 - $240
- **Mid-Term:** $270
- **Long-Term:** $300+
---
## **Chart Patterns & Indicators**
### **1. Ascending Channel**
- Price is **respecting the lower trendline**, indicating a potential bounce.
- **Holding above the trendline** supports a continuation towards $270+.
### **2. Stochastic RSI – Oversold**
- Deeply oversold **(below 20)**, signaling potential upward momentum.
- Historically, price has bounced after hitting this level.
### **3. Volume & Confirmation**
- Need a **break above $230 with volume** to confirm upside strength.
---
## **Trade Plan & Price Targets**
### **Short-Term (1-2 weeks)**
- **Bias:** Bullish
- **Entry Zone:** $210 - $215
- **Stop Loss:** Below $200 (trendline break invalidates setup)
- **Target 1:** $230 (resistance level)
- **Target 2:** $240 (next key level)
### **Near-Term (1-3 months)**
- **Bias:** Bullish
- **Price Target:** $270 (upper range of channel)
- **Risk:** Medium (watch for rejection at $230)
### **Long-Term (6-12 months)**
- **Bias:** Strongly Bullish
- **Target 1:** $300 (upper trendline resistance)
- **Target 2:** $350+ (breakout scenario)
---
## **Risk Considerations**
- A **break below $200 invalidates** the setup.
- Macro conditions and crypto market correlation **impact price action**.
---
### **Final Thesis**
✅ **Bullish continuation likely if price holds $205-$210.**
🚀 **Breakout above $230 needed for strong upward momentum.**
⚠️ **Break below $200 = potential trend shift, bearish risk.**
COINBASE: Reached the bottom of the 1 year Channel Up.Coinbase is bearish on its 1D technical outlook (RSI = 39.040, MACD = -17.200, ADX = 47.118) and has hit the bottom of its 1 year Channel Up following a 4H Death Cross. This is typically seen at the end of downtrends and with the 4H RSI already rebounding after turning oversold, we technically have the best buy opportunity since September 6th 2024. The trade is long, TP = 395.00.
## If you like our free content follow our profile to get more daily ideas. ##
## Comments and likes are greatly appreciated. ##

COIN - BUY! This is a market I looked at last week but here is why im going to be Long Term buying for this company now.
Firstly the fundamentals show that we have a very close and strong Demand zone that has already had a strong reaction, secondly this happens to be sitting near a key level that price is also respecting as a support level.
We can notice prior the Demand zone touch that we have swept Sell side Liquidity and now price is very clearly Consolidating. Except, we have had multiple reactions from this level and Elliot's now suggests that the end of that Consolidation cycle is here.
Im looking to buy in a Market order, to add confluence to my decisions this market runs off the Nas100 which is also in a key level on a very strong Bullish Trend.
Im looking for this to be a very large move with respecting the Demand and hopefully taking out Buy side Liquidity and on its way into a new Swing Range
Good luck to all the traders that Decide to follow and please message and comment any questions
Cheers

Bull/Bear case for $COINKey Resistance Levels: $263, $222
Key Support Levels: $200, $193, $189
Bull Case
The stock is testing a major ascending trendline near $200. If it holds, a bounce toward $221–$263 is possible.
Oversold RSI (40.78) and Stochastic (14.33) indicate a potential relief rally if buying interest picks up.
If COIN reclaims $222, it could push toward $250 and even $263, breaking out of the descending triangle.
Above $263, the next major target would be $320.
Bear Case
COIN remains in a descending triangle, signaling continued weakness unless a breakout occurs.
A break below $189 could trigger a deeper correction to $166–$143 (Fib retracement zones).
If $143 fails, the next major support lies at $115, with an extreme bearish target of $70.
Final Verdict
Bullish Above $222: Expect $250–$263, then $320+.
Bearish Below $189: Expect $166–$143 downside.
Best Trading Approach
Aggressive Bulls: Buy near $200–$193, SL $189.
Conservative Bulls: Buy at $166–$143, SL $138.
Bears: Short below $189 for $166–$143.

COIN - Potential 15000 Point move comingHI all,
Overwhelmed with support recently which I really appreciate. Lets take a look at COIN
Coin is at a large area of intrest to me as this price has been used as both support and resistance many time. We area currently respecting a long term Bullish trend line
We are slowly approaching a Strong Demand zone now from where price made a massive Bull run. Im looking to make a similar movement off this support level although price may push off this point of intrest without testing the Demand.
If we take the previous high price then I will look to buy from a market order position targeting Buy side Liquidity
Good luck to all the traders that decide to follow

CoinbasePrice has made another low as I expected. It officially breached the 1.0 and started to move higher. As if on schedule, President Trump announced a US crypto strategic reserve this weekend. BTC and other tier 1 cryptos are up anywhere from 10-30% already. This will directly affect COIN and will kickstart the next move higher. What you need to be wondering is if this is the start of wave 5, per my original thesis, or if this is the start of intermediate (B) based off of my other view that COIN has already made a long-term top. This next week / immediate move higher will be of extreme importance to the long-term projection of COIN...and that is an understatement.

USDJPY, EURNZD, ETH, BTC & COIN Daily Trade SetupsIn this update, we review the recent price action in the USDJPY, EURNZD, ETH, BTC & COIN and identify the next high-probability trading opportunities, price objectives, and invalidation points. To review today's video analysis, click here!

$COIN Spinning Stop Candle in Downtrend; ReversalWe have 7 days of straight beating, assault, slaughter and murder. Do I think this thing reverses 10 fold? No but do I expect a bounce into the mid 220’s? Yes. RSI is relatively low (sold) for its name, it fundamentally smashed earnings and the candle here that closed on the daily is known as a spinning stop with a green closure. Expect a volatile move soon - tomorrow or and into Friday. NASDAQ:MSTR held up well today. This is always a craps shoot, no matter the trade, no matter the look of the chart and all the indicators we use. It just creates an edge. Good luck. I’m going to look at calls here for a bounce.
Wall Street Loser.

COINBASE ($COIN) Q4—CRYPTO CASH PILES UPCOINBASE ( NASDAQ:COIN ) Q4—CRYPTO CASH PILES UP
(1/9)
Good evening, TradingView! Coinbase ( NASDAQ:COIN ) just dropped a Q4 banger 💰 $ 2.27B revenue, up 138% YoY 🌍 Full ‘24 hits $ 6.29B—let’s unpack this crypto hauler!
(2/9) – REVENUE SURGE
• Q4 Take: $ 2.27B 🌟 138% leap from ‘23
• Full ‘24: $ 6.29B 💼 115% climb
• Subs: $ 2.3B 📈 64% jump
NASDAQ:COIN ’s raking it in—trades and fees soar!
(3/9) – EARNINGS POP
• Q4 EPS: $ 4.68 🏆 beats $ 2.11 guess
• Net: $ 1.3B 🌞 300% YoY surge
• EBITDA: $ 3.3B 💪 two years of green
NASDAQ:COIN ’s cash flow hums—profit’s real!
(4/9) – BIG MOVES
• Global Cut: 19% Q4 from overseas 🌐
• Next Up: Derivatives, USDC push 📊
• Stock Dip: Flat post-earn 🤔 profit grabs?
NASDAQ:COIN ’s stretching wide—crypto’s workhorse!
(5/9) – RISKS ON DECK
• Crypto Swings: Price drops sting 🕸️
• SEC Suit: Regs loom ⛔ costs nip
• Rivals: Binance lurks ⚡ tight race
Hot streak—can it sidestep the traps?
(6/9) – SWOT: STRENGTHS
• Haul: $ 2.27B Q4 🚛 volume beast
• Subs: $ 2.3B 💡 steady stream
• Profit: $ 3.3B EBITDA 🏋️ cash stack
NASDAQ:COIN ’s hauling freight—built tough!
(7/9) – SWOT: WEAKNESSES & OPPORTUNITIES
• Weaknesses: Trade lean 🌫️ thin ice
• Opportunities: Global reach 🌏 reg wins
Can NASDAQ:COIN outpace the bumps?
(8/9) – NASDAQ:COIN ’s $ 2.27B Q4—what’s your take?
1️⃣ Bullish—$ 350+ in sight 😎
2️⃣ Neutral—Good haul, risks linger 🤷
3️⃣ Bearish—Crypto dips drag it down 😕
Vote below! 🗳️👇
(9/9) – FINAL TAKEAWAY
NASDAQ:COIN ’s $ 2.27B Q4 and $ 6.29B ‘24 pile up big—crypto hauler 🪙 High P/E, but cash flows—gem or jinx?

Coinbase Weekly AnalysisRetracement back into Demand.
Should see a strong hold at this level.
If it breaks, look for next demand zone

coin cup&handle price target = $530coin current price $278 , came for retest of the break level.as long as it's above this level
cup&handle formation price target = $530
resistance 1 = $368
resistance 2 = $429

COIN: Lol...LOL, who needs WSB for loss porn, just come to COIN ideas on TV xD.
While everyone was desperately longing this last week, I was shorting.
Take a look at the chart. These lines represent supply and demand zones that are algorithmically determined. Red is supply, green is demand.
There is no demand until sub 200, at around 190.
A huge daily gap fill as well.
Don't really need math for this.
However, if you're interested in the math I'll throw you a tip, expect a further -0.6 to -1% decline into tomorrow.
Safe trades, not advice!

CoinbasePrice has officially entered into my target box today. I still feel we have lower to go before this is over though. I would like to see us hit the 1.0 @ $204.65 before turning back higher. I can think of several things that could support a move higher such as the SEC dropping its case against COIN. However, we have crossed into wave 1 territory, which is the minimum needed for the larger ED I have been tracking.
We created some neg div on the hourly chart today too. As you can see, price made a lower print today than last December and MACD is reading a higher print. Is this hinting that more downside is coming? I believe so, and I believe the 1.0 @ $204.65 is the ideal place for price to turn around at. I have an alert set @ $205 and will likely look at placing an order around this area.

BTC & Crypto Update - Exactly as I laid out a month ago! Here's what we're looking at in the near term. I know it stinks that we have to come down before sky rocketing again - but eventually we all knew liquidity would have to be built on cryptos, especially BTC, and that's what we're seeing now. We're ultimately bullish! These are bullish algorithms! But we need to build controlled liquidity in these algorithms to sustain further movements and breakouts to the upside.
Happy Trading :)

Coinbase (COIN) Shares Drop to Three-Month LowCoinbase (COIN) Shares Drop to Three-Month Low
The Coinbase (COIN) chart shows that, for the first time in 2025, the share price has fallen below the psychological $250 level.
Bearish factors impacting COIN:
One key factor driving negative sentiment is the confirmed hack of the ByBit cryptocurrency exchange, raising concerns about deposit security in the industry. According to media reports:
→ The attack may have been carried out by North Korean hacker group Lazarus.
→ Hackers allegedly drained Ethereum tokens worth between $1 billion and $5 billion from ByBit’s wallet.
→ This is the largest crypto hack in history.
Another factor is growing concerns about the US economy, which have negatively impacted stock markets. As reported by Reuters:
→ The S&P 500 index (US SPX 500 mini on FXOpen) fell by 1.66% on Friday, marking its worst performance of the year.
→ The decline followed a drop in Walmart’s share price and weak consumer sentiment data.
→ Friday’s Purchasing Managers’ Index (PMI) figures were below previous levels. Investors are now focusing on this week’s release of the Personal Consumption Expenditures (PCE) price index—the Federal Reserve’s preferred inflation gauge.
Technical Analysis of Coinbase (COIN) Chart
COIN price movements form an upward channel (marked in blue), but several bearish signals are emerging:
→ The price has dropped into the lower half of the channel.
→ The psychological resistance level has shifted from $300 to potentially $250.
If bearish sentiment persists, COIN’s share price could fall further towards a support zone consisting of:
→ A bullish gap (marked in purple).
→ The lower boundary of the blue channel.
→ The psychological $200 level.
Coinbase (COIN) Price Forecast
Wall Street analysts remain cautiously optimistic following Coinbase’s quarterly earnings report on 13 February, which exceeded expectations.
According to TipRanks:
→ 10 out of 21 analysts recommend buying COIN.
→ The average 12-month price target for COIN is $350.
Trade on TradingView with FXOpen. Consider opening an account and access over 700 markets with tight spreads from 0.0 pips and low commissions from $1.50 per lot.
This article represents the opinion of the Companies operating under the FXOpen brand only. It is not to be construed as an offer, solicitation, or recommendation with respect to products and services provided by the Companies operating under the FXOpen brand, nor is it to be considered financial advice.

COIN: take the chance and join the journey here!COIN: take the chance and join the journey here!
-ABCD pattern.
-Bull flag pattern consolidation.
-Key level and demand zone support.
-Logical volume and spread.
.
See and wait!

Revised COIN price targets - the blood is on the streets
ByBit exogenous news is wildcard so we’ve broken down support as all hell broke loose.
Here is the revised outlook of the trading plan:
Trading Plan Based on Risk Appetite
Aggressive Trader (Short-Term)
• Long Entry: $234-$236 (oversold conditions).
• Stop-Loss: Below $230.
• Target: $248-$252.
Swing Trader (1-2 Weeks)
• Long Entry: On confirmation above $248.
• Stop-Loss: Below $234.
• Target: $263-$272.
Investor (Long-Term)
• Buy Range: Accumulate in dips between $220-$234.
• Target: $280-$310 in a bullish case.
Conclusion
• COIN has broken key support levels but is now in a critical demand zone ($234-$236).
• The next 24-48 hours will be crucial—if price stabilizes, we may see a bounce.
• A further breakdown below $234 opens the door to $220.
• A reclaim of $252-$263 will confirm a short-term bullish reversal.

Coinbase shortterm bounce opportunity This is beaten down. So much so, that it’s beaten down on many time frames. In my book it’s a contrarian opportunity here. My indicator tells me the same.
The COIN stock is showing oversold conditions based on momentum indicators.
• The 3H chart suggests a potential reversal or at least a short-term relief bounce.
Timeframe Analysis
Short-Term (3H - Intraday to Few Days)
• Current Price Action:
• Price is hovering above a strong liquidity zone near $246-$250.
• The stochastic-based oscillator at the bottom is in the oversold region with blue triangles indicating potential buying interest.
• Previous Break of Structure (BoS) & Change of Character (CHoCH) events confirm short-term trend shifts.
Key Levels to Watch:
• Resistance: $270 (previous rejection), $280-$285 (key range high).
• Support: $246-$250 (buying zone); a break below could send it toward $234.
• Short-Term Probabilities:
• Bounce to $270: ~60% chance if support holds. [
• Break below $246: ~40% chance leading to $234-$236.

COIN: Buy ideaThis configuration of the chart on COIN points out to us a great buying opportunity. This purchase will occur when the resistance line is broken forcefully by a large green candle and followed by a large green volume. Furthermore, this will be confirmed by the strong break of the vwap indicator.
