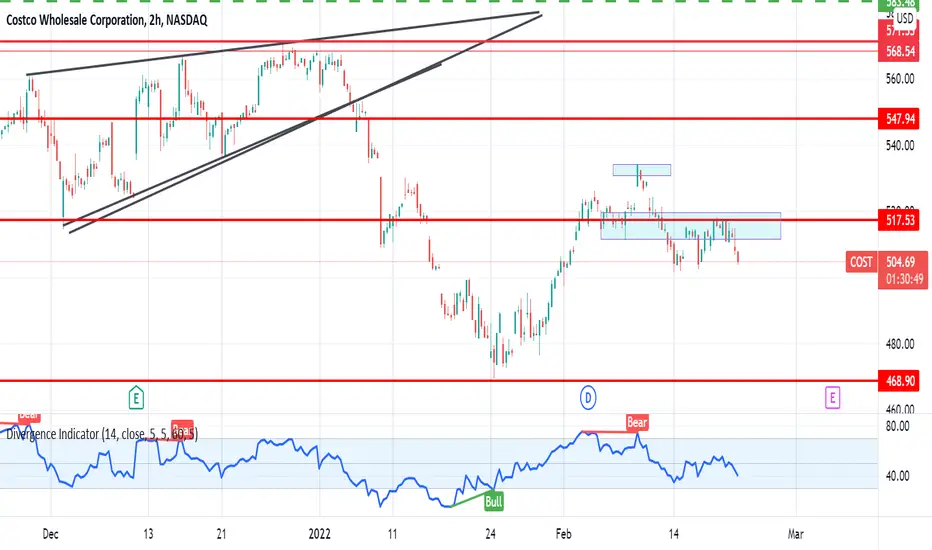
$COST Breakout of fakeout...Been watching this develop, all stocks are waiting for rate hike confirmation tomorrow, then what. Does this break to the topside, or fall out of the wedge....
COST trade ideas

$COST last man standing?...Pull back to $470 maybe? Watching this closely, seems like it could be a weekly double top...

COST BEAR FLAGCOST has been chopping up and down in this clear bear flag trend.
It's only a matter of times before it revisits its lows imo.
See my "SPY DANGER" chart to see why I'm so bearish on stocks in the coming weeks. I explain everything in detail over there.
Looking for a break to the downside in the coming week and a half below the green support line.
Targets: 483 --> 470 (prior lows in February and January respectively). Below that.... well idc.
Play: COST 03/25/22 495/490p spreads at 0.5 at time of this writing. If ITM, these will go to 4.5 (9x).
I fully expect that to happen :)
NFA.
Don't go all in you chumps.
Good luck traders :)

COST: SHORT OF THE DAYCOSTCO P/E is sitting at 42.37 making it one of the highest P/E's in it's sector. COST reported earnings last Thursday, but reported lower guidance for Q3. COST is up over 3% today and respecting the fibs as well as the channel it's currently in. First price target is 502 over the next few weeks.
Not financial advice

Costco going for discounts. COSTGoals 485, 468, 440.
We are not in the business of getting every prediction right, no one ever does and that is not the aim of the game. The Fibonacci targets are highlighted in purple with invalidation in red. Fibonacci goals, it is prudent to suggest, are nothing more than mere fractally evident and therefore statistically likely levels that the market will go to. Having said that, the market will always do what it wants and always has a mind of its own. Therefore, none of this is financial advice, so do your own research and rely only on your own analysis. Trading is a true one man sport. Good luck out there and stay safe

the bull rally continues here! 🦉cost trend resistance held as support! great signs for the longs. also saw a nice double bottom bounce off support. looking for a rally to 567.77 this year is long as the important trendline holds.
like and follow for more! <3


House of flying daggers
Burst warehouse, forget the whole world; Once rich, forget the past.
Scary bookmakers think scary is the worst.
The k line, like the heart wire.
Sometimes, you fight to get the benefits, after all, found that it is not yours.
The whole of winning is the story of other people's homes.
A god who earns millions has his own divine prediction, whether he wins or loses.
There are six kinds of people in the world: buying before thinking, thinking while buying before buying, thinking before buying, and not thinking after buying.
Don't buy it. Don't buy it.
Lying god, most afraid of a good memory single.
Buy, burst, miserable, dare not say, cheated, the best opportunity, and wasted
Time...... A series of helpless painful course arrived tomorrow still face does not change color, to the person fierce blow
This behavior is called "pretend pussy"!
Think more for fluke, the opportunity of deficit is less. The same goes for people.
You must be a good person to write articles and deal with details like that, haha.

Costco ShortI love Costco as much as the next person, but technicals and fundamentals don't look great. 45P/E with RSI and price starting to show weakness. Fairly solid short to 480, where I'll take half profit.

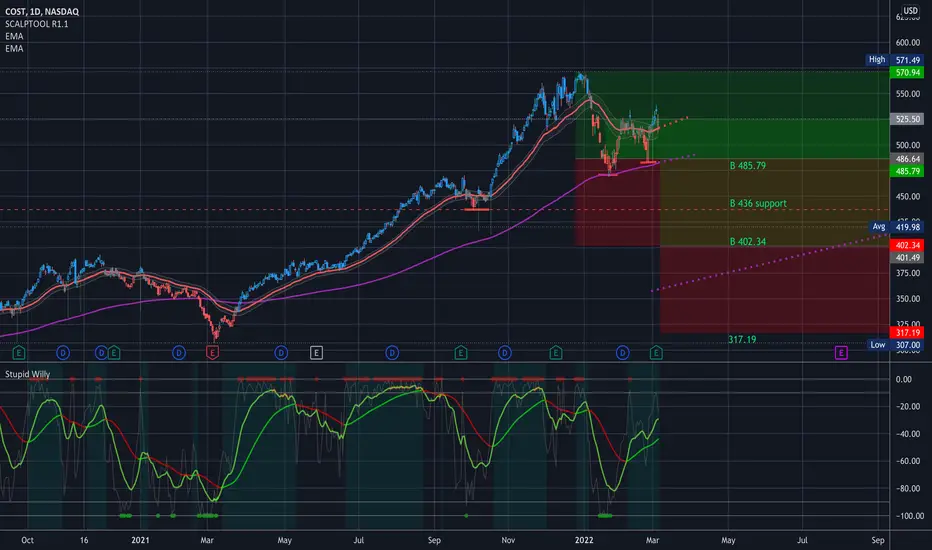
$COST Key Levels, Analysis & Targets$COST Key Levels, Analysis & Targets
I have to be sentimental with COST. I didn’t analyze it differently… the MA’s just are what they are…
But I think that COST is an efficient company. I think they deserve their market value. I do think it will fall a little bit, but this company is strong. I’d hold.
-----
—
On the far right of the chart is my Average (Grey) Current Target (Green), and Next Level to add (Red) Percentage to target is from my average.
ONLY ADD at support levels & FIB levels… labeled (most of the time)
(Support=Green, Resistance=Red, Trendlines=Blue) Fib will be labeled if any and their colors will vary.)
I start every position with .5 - 1% of my account and build from there as needed and as possible.
I am not your financial advisor. Watch my setups first before you jump in… My trade set ups work very well and they are for my personal reference and if you decide to trade them you do so at your own risk. I will gladly answer questions to the best of my knowledge but ultimately the risk is on you. I will update targets as needed.
GL and happy trading.
IF you need anything analyzed Technically just comment with the Ticker and I’ll do it as soon as possible…
COST - Possible head and shoulders forming into a falling wedgeIt looks like COST is making a H&S. Price might fall into the wedge, and then moon after that. Could go to the Fib around $362. People will horde Costco when SHTF, but look at what happened during C19 crisis when the toilet paper ran out. The oil crisis could put constraints on trucking and suppliers being able to fulfill orders. My gut was telling me to sell at $560, but I got too high on euphoria. We have passed complacency and are now at the anxiety / denial phase of this market cycle.
Costco shoppers:
- Boomers
- Families
- Gold-diggers
- Kooks

COSTCO - COSTUpdate here on Costco, looking to become heavy buyer towards the 390-446 range. Weekly looks like it’ll break down further from here based off technicals.


Costco Makes a Lower HighCostco ran to new highs in late December, but this year it’s been under pressure.
The warehouse retailer slid 11 percent in January – its sharpest monthly drop since December 2018. It then retraced about half the decline to make a lower high last week. Notice how the high not only consisted of an abandoned shooting-star candlestick. It also occurred at the 50-day simple moving average (SMA).
Speaking of the 50-day SMA, this chart includes our custom script Moving Average Speed highlighting its direction and rate of change. The last time it fell like this a year ago, COST had a deeper retest.
Given that history and the stock’s healthy gains in later 2021, some traders may view the recent price action as the start of an ABC correction. Will they also focus on the October low around $440 as the next likely support?
TradeStation is a pioneer in the trading industry, providing access to stocks, options, futures and cryptocurrencies. See our Overview for more.
Important Information
TradingView is not affiliated with TradeStation Securities Inc. or its affiliates. TradeStation Securities, Inc., TradeStation Crypto, Inc., and TradeStation Technologies, Inc. are each wholly owned subsidiaries of TradeStation Group, Inc., all operating, and providing products and services, under the TradeStation brand and trademark. When applying for, or purchasing, accounts, subscriptions, products and services, it is important that you know which company you will be dealing with. Please click here for further important information explaining what this means.
This content is for informational and educational purposes only. This is not a recommendation regarding any investment or investment strategy. Any opinions expressed herein are those of the author and do not represent the views or opinions of TradeStation or any of its affiliates.
Investing involves risks. Past performance, whether actual or indicated by historical tests of strategies, is no guarantee of future performance or success. There is a possibility that you may sustain a loss equal to or greater than your entire investment regardless of which asset class you trade (equities, options, futures, or digital assets); therefore, you should not invest or risk money that you cannot afford to lose. Before trading any asset class, first read the relevant risk disclosure statements on the Important Documents page, found here: www.tradestation.com .

COST dead cat bounce nearing the endCOST bounced nicely off oversold zone but now seems to be stalling. Volume profile at 527 is proving difficult to get past. Level to watch is a close below 514. Will quickly see it retest its breakout zone at 495. Will have to wait to see what it does at 495 if we get there.

cost long from 468Costco found support at the previous resistance area at 468. A nice bounce occurred on friday and we got a move up today.
only look for long positions on a retracement.

C&H COST on dailyCup and handle on costco.
I believe a possible swing trade is presenting itself here in costco.
I like this company long term as well.
The 50 sma is acting as the resistance right now.
Pt: 529,546,571

$COST - Staples 2/10Costco is the 2022 top pick representing 2.3% of the portfolio. Not a lot of faith in the staples sector for sure with it representing such a small part of the 2022 top pick portfolio. The only concern I have is if it hit that gap above and then started trend lower. Another concern would be a double top but there would be nice profits secured if that happened anyways. Costco has been a beast these last couple years and its e-commerce trend is still favorable. I like it.

Cost is long. toward 493Target 1 is 493 after testing the support on 466, it is going up toward 493
the next target will be 519
In my opinion, can be reached gaols in the next two weeks.

Long on COSTLong on COST if it bounces up at 469.5. RSI rebounding from lower bounds with MACD converging. Positive price/indicator divergence on 2h and 4h time frame. Stop loss right under 469.

COST daily470 area held, this demand zone look like a nice buy area keep it on your radar. Oversold defensive stock, good for portfolio diversification with the current economic environment.

Equity Markets1.22.22 Looking at TTD, Costco, Nvidia, and other markets that we have looked at in the past.
