COST Replay....So I doubled up on puts this morning on the gap down because options premium indicated 2.3% drop and closed the position on the initial drop. Nice wedge back to the old resistance, where I should've bought puts again, lol. Then back down where it belonged.
Should've seen it coming, COST almost always finishes at the bottom when it drops on earnings, the notable exception being the last earnings which happened at the bottom when it was oversold.
Also note the huge pump volume EOD yesterday and the red bars today after open and near close. Lots of people jumped into this for earnings expecting a breakout. Serves them right, lol.
Could've just played this all day instead of screwing around with other stuff.
COST trade ideas

COST EarningsI think this is going to move big in one direction or the other. Guessing down, but i could be wrong.
Obvious double top.

Will rising oil prices hurt Costco?Costco has been inversely correlated with Oil prices for quite some time, but that has changed recently.

$COST could be wrong....But looking at a small risk put for a few weeks out after earnings...might be a sell the news, beat and lower forecast with things getting back to normal, less quarantine stockpiles etc...just a theory

action packed chart of COST; to the moon off earnings!Bullish inverse head and shoulders formation on the daily chart for Costco. Earnings around the corner with expectations of a huge beat. Costco has their membership fees/incentives to help protect margins as inflation becomes a factor in everything from supplies to freight. Earnings whispers are $2.44 a share with a consensus of at least $2.28/share.
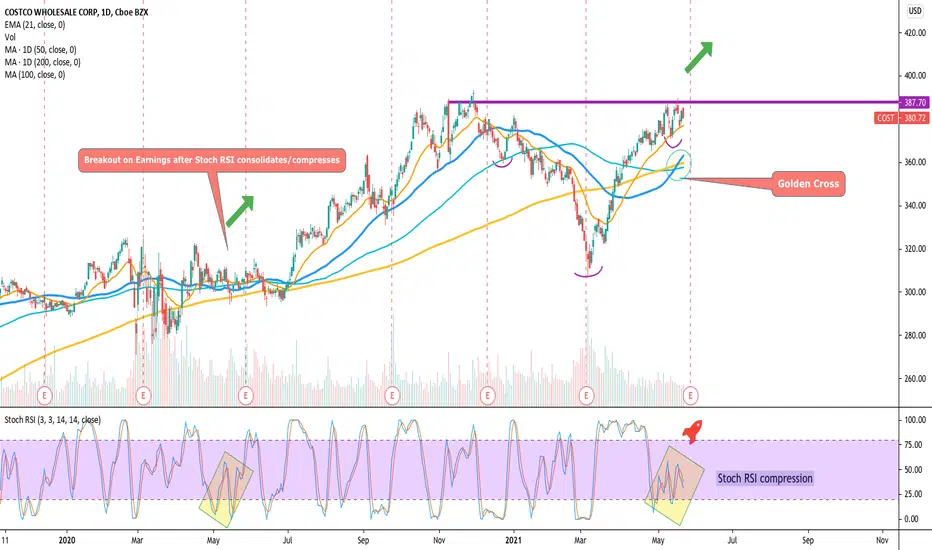
Stoch RSI compression repeated itself. The last time Stoch RSI compressed/consolidated right before earnings it went on a huge 18% run over the next 98 days, 27% over the next 186 days, and 22% by the next earnings report (196 days later).
"History doesn't repeat itself but it often rhymes"
I expect a similar breakout on earnings with this repeated pattern although price action has been terrible this earnings season even with beats & good guidance. COST could be the exception. Probably smartest to play it through options to risk less.
www.earningswhispers.com
Cup and HandleCostco formed a head a shoulders pattern a while back and experienced a deep pull back.
Looks to be recovering from the rising wedge pattern with very little disruption.
Cup and handle patterns are calculated using cup depth.
No recommendation.
If you like a stock, sometimes you can do well by waiting for the fall to complete from an ugly top or a head a shoulders pattern, then buying at the bottom. Some prefer getting in closer to the top. We are all different.


Costco potential short NASDAQ:COST Was trading in Rising wedge and broke down . we are looking into pull back to daily support at around 350 , if you looking to trade it keep ur stop loss tight to 376-378 area . Good luck and please note it's just an idea I'm not financial advisor

Nice Run. Pullbacks necessary. Short to $355?Greetings All,
COST, along with Home Depot (HD) have been on a tear lately. However, targeting the reversion to mean principle, I expect COST to retrace to the 50MA around $355. There is also bearish RSI divergence on the daily chart.
Happy Trading !

COSTCO - Is this a bottom?With the recent bottom testing on the SPX500USD
How does this affect COSTCO's recent massive correction?
This could be a great entry point!
Use trend line for stop loss!
And remember to track index. If SPX500USD sells more, then costco could go down more.


Another recovery play post covid Costco just released a strong earning report which proved once again its business model could transcend good and bad time.
If we looked back at the last three years, we could easily observe Costco shares often time dropped the week before earning release, and bounced right back up after. It happened in 2018, 2019 and just now before the earning last week.
Together with the negative sentiments, costco share priced did drop below its uptrend line for a moment, but it managed to climb back above before the weekend, and lets assume its uptrend would continue esp with the recovery play in front of us.
I do not now have a position in Costco but I am looking forward to start a position at 337 (10MA), with its recent low $313 as cut loss and looking for at least an upside target of $390, which gives us a decent 2x of risk reward ratio.

Long COST into earningsDaily RSI is at levels it hasn't seen since 2016. This obviously isn't especially bullish, but these oversold conditions sets this up for a great relief rally lotto.
So far the pitchfork has been respected and the gap to 318 has been filled.
The risk/reward seems too good to pass up.


Cost sellCostco sell off of distribution, I see us hitting 348-350 and creating the LPS is distribution as wsellers take over

COSTO SWINGLOOK FOR AN ENTRY AT PULLBACK, I'M IN COSTCO LONG TERM.
1. MOST IMPORTANTLY - IT'S A FANTASITC COMPANY, I LOVE SHOPPING THERE, I LOVE THAT BUFFET AND CHARLIE ARE HUGE COSTCO BULLS TOO
2. RSI IS MOVING FROM OVERSOLD
3. MAC D IS BULLISH
4. THE 200 AVERAGES WILL BE THE RESISTANCE WE SELL OFF ON, THIS WILL PROVIDE AN OUTSTAND RENTRY OR ENTRY DEPENDING ON WHAT YOU'RE DOING, A BREAK ABOVE IS WHAT WE ARE REALLY LOOKING FOR.
THE REAL MONEY WILL BE MADE IN A LONG TERM SWING TRADE HERE, BUT YOU CAN BE CONFIDENT IN YOUR POSITION, AND MOST IMPORTANTLY, SLEEP WELL AT NIGHT.


COST Trend continuation to the downsideMACD looks good RRR 1.4
Remember shorts are smaller position sizes in your portfolio


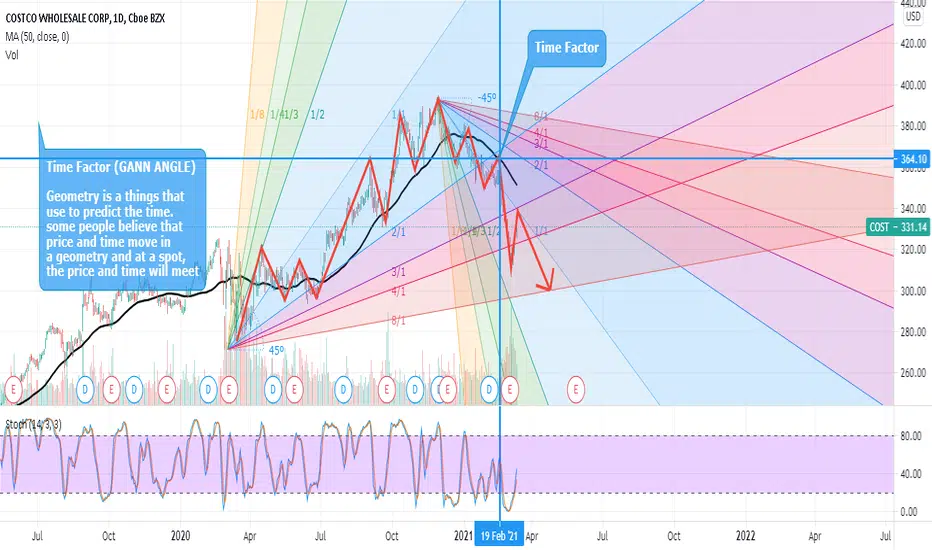
COST (NASDAQ) - Define the time factor using GANN Angle TeoryGreetings
Humbled, we would like to thanks for your support who has already liked, commented and followed us. Your support, strengthens us, to help in analyzing the market. If you have any questions, feel free to send us message (inbox).
Pra Trading :
- Please care for Money Management
- Have a good psychology
- Do not be hurry to open position and do not do nothing if u see opportunity
- Evaluate and upgrade your trading plan
Execution Strategy :
- Know what you want to buy, see the Fundamental
- Decide that you are on investing or speculating
- Consider what your strategy based on Investing/Speculating
- Make Road Map Of Your Trading Plan
- Decide
a. Entry strategy
b. Cut loss
c. Target of Profit
Post Trading :
a. Do not be sad if you loss or do not be very happy if you win
b. Just become a normal without emotion, Do not put emotion into your trading
c. Evaluate your trading
d. Keep on Learning
e. Be Humble
Idea :
COST (NASDAQ) - Define the time factor using GANN Angle Teory
How much COST to the moon?COST followed fibonacci levels in the recent past, reaching its minimum and then bouncing back up.
I draw its possible future path, that can go much over the highest price ever reached.
In my opinion, this is a great buy opportunity for a medium-long term holding.
In case the STOP LEVEL will be crossed down, I will close and reverse the position.

Heading to $350Quick swing trade set up on COST.
Entry: Under $325
Profit Target: $333 (target 1), $350 (target 2)
Stop loss: $ 317
Risk: up to 2.5% loss
Upside: 7.5%+ (you could choose to hold this long term -- pays a decent dividend).
Good luck traders!
