Costco Wholesale Corporation ( NASDAQ: COST) Unravel The GemIn the last five years, shares of Costco Wholesale (COST -0.19%) have made for a wonderful investment, climbing 149%. This gain is much better than the broader market indices. But the stock is still 11% off its peak price (as of Oct. 27).
There is a lot to like about this company. Those looking to buy shares right now need to spend some time understanding more about Costco and the current situation.
With that being said, here are three facts the smartest investors know about this top retail business.
1. A membership-based business model
Anyone can go visit and shop at a Walmart, Target, or Home Depot location. This is typical in the retail industry.
However, Costco does things differently. Consumers must shell out $60 (for the basic plan) or $120 (for the Executive plan) a year to become Costco members, thus allowing them to shop at one of the company's 862 warehouses worldwide. This strategy has been successful, as there are currently 71 million member households, a figure that was up 7.9% year over year. Plus, these memberships registered a renewal rate of 92.7% in the U.S. and Canada in the most recent quarter.
From the company's perspective, this membership model is a financial boon. It drives customer stickiness, which can reduce marketing expenses and support strong revenue gains. It allows Costco to keep the pricing markups on its merchandise under control, as the business isn't trying to maximize product gross margin. And lastly, membership revenue provides a major boost to the bottom line.
Costco also has proven pricing power with its memberships. Costco is due to raise membership fees since it hasn't done so in over six years, but customers likely won't resist if history is any indication. The savings provided by being a Costco member far outweigh the annual fee.
2. An uncertain macro environment
Costco's revenue soared to double digits in both fiscal 2021 and fiscal 2022. The pandemic and its aftereffects spurred demand from consumers to shop at Costco. Perhaps elevated levels of inflation also drove people to these stores, as saving as much money as possible was the priority.
But like many businesses these days, the uncertain macro backdrop is providing a bit of a headwind. Net sales were only up 6.7% in fiscal 2023 (ended Sept. 3), with same-store sales rising 3%. And for fiscal 2024, Wall Street consensus analyst estimates call for revenue to increase 4.9%.
The company's management team points to weaker demand trends as they relate to big-ticket, discretionary items. These include things like electronics and jewelry, for example.
3. An expensive stock
Thanks to Costco's outperformance historically, the stock isn't cheap. It currently trades at a price-to-earnings (P/E) ratio of 38.4. Costco's shares are trading at a value that's more expensive than its past 10-year average of 33.1.
The valuation also represents a huge premium to rivals like Walmart (P/E of 31) and BJ's Wholesale Club (P/E of 18.6). This is likely warranted, as a valid argument can be made that Costco is a superior business to these two competitors.
COST trade ideas

$COST bearish divergence at resistanceStruggling to break above 2021 ATH. Bearish divergence on the oscillators on both the weekly and daily timeframe, below the trendline. Probably better shorts available in the market but if economic picture deteriorates could be a long way down.


Costco Wholsale next rally to $613.56Inverse Head and Shoulders formed on Costco Wholesale.
The price broke above and is now retracing to a conservative level. Once it tests, we then need a strong move up.
Now the reason I'd wait for the retest is because American indices are showing further downside to come and it might create this sideways consolidation range following the breakout.
7>21
RSI>50
Target 613.56

COSTCO: Watch this buy breakout level leading to All Time HighsCostco Wholesale Corporation is testing the R1 level (571.65) for the third day straight on a nicely balanced bullish 1D technical outlook (RSI = 60.287, MACD = 2.930, ADX = 22.559). Since the dominant pattern thus far is a Channel Up, if the 1D candle closes over the R1 level, traders should regard it as a bullish breakout opportunity, targeting the R2 level (TP = 612.00) which is the stocks ATH.
## If you like our free content follow our profile to get more daily ideas. ##
## Comments and likes are greatly appreciated. ##

ASCENDING TRIANGLETop line is flat and bottom line slopes up.
Neutral until broken.
Targets for Triangles can be estimated using the wide end of the triangle and projecting it for the point of the break be it up or down as the pattern is neutral until broken.
It is easier to estimate a break up as the top line of this triangle is flat.
It is a crap shoot to estimate the point of break on the bottom line as it slopes and there is no way to know where it will break. So I guesstimated. (o;
No recommendation.

COSTCO, at support, to trend down with sales reportCOSTCO has a history of trading against the market. Often when the market is down, COST is up, and vice-versa. Consider this a divergence making for a better entry.
COST is bumping up against well know support pre/post inflation at around $540.
May same store sales are due out tomorrow afternoon, 7/6/2023 at 1:15pm PDT.
Based on COSTCO's mid-month mark downs of products and increases in discounting from their flyers to the online purchases, they are working to keep revenue numbers up as well as total sales numbers.
COSTCO has recently been checking cards/IDs/applications to ensure the person paying is the cardholder/executive member. I have experienced this in San Antonio, Kyle, and Austin Metroplex.
Bearish and Bullish entries
Bearish, $540/545 CALL CREDIT SPREAD, expecting a trend down after same store sales disappoint beyond the core numbers.
Bullish, $510/515 PUT CREDIT SPREAD, when the trend down begins, expect COST to have support at the $520 range, but look for spread entries at $5 strike lower for added security against broader market moves.
An Iron Condor is possible, but we aren't at a FIB50 for COSTCO, so a put spread would likely lose money as the stock price goes down, so avoid an IC and take spreads OTM as the mark moves.
LEGEND:
Large red arrow points to the last same store sales impact on stock, as well as the trend recovery. COST is generally bullish vs. bearish at this time, and the daily MA cross confirms.
Drawn red box near arrow, is the day the last same store sales results were posted.

COSTCO: Bearish Butterfly with PPO and MACD Bearish DivergenceCostco has formed a Bearish Butterfly that lines up with the 0.786 retrace and is testing the zone for the second time with PPO Bearish Confirmation Arrows on both tests, PPO Bearish Divergence, and MACD Hidden Bearish Divergence. This looks like it could be setting up to revisit the lower half of the range.

Costco Wholesale Corporation (symbol ‘COST’)Costco Wholesale Corporation (symbol ‘COST’) share price rose by 6% in the quarter ended on 31/08/2023 in a rather steady bullish momentum. The company’s earnings report for the fiscal quarter ending August 2023 is expected to be released on Tuesday 26th of September, after market close. The consensus EPS is $4.71, up from $4.20 in the same quarter last year.
‘The company’s financial condition is rather balanced without any exciting indications with a low debt to equity ratio of around 28% and a current ratio of just above 100% ( 108% to be precise) as of 31/05/2023. On the other hand the company is not very popular in terms of paying out dividends with a dividend yield ratio of less than 0.8% making it not very appealing to large investors.’ said Antreas Themistokleous, trading specialist at Exness.
Technical analysis shows the price has resumed its bullish momentum after some losses incurred in mid August and is currently on the move to fully cover these losses. The upper band of the Bollinger bands proved to be a strong resistance level and caused the price to correct to the downside in the recent sessions. The 50 day moving average is trading well above the 200 day moving average while the price continues to trade above the daily bullish trendline pointing to the North for the near short term outlook.
On the other hand the Stochastic is recording extreme overbought levels indicating that a bearish move might be visible in the coming sessions but there are no other signals of a correction so that scenario might not play out at least for now.

COST show a relatively high level of large-scale triangularCOST show a relatively high level of large-scale triangular
This chart shows the weekly candle chart of Costco's stocks over the past year. The top to bottom golden section at the beginning of 2022 is superimposed in the figure. As shown in the figure, Costco's stock peaked in April 2022, plummeted, and began to strengthen in May 2022, showing a relatively high level of large-scale triangular fluctuations and consolidation overall! The stock of Costco Company was suppressed by the top to bottom golden ratio of 1.382 at its high points in July and September this year. Therefore, in the future, this position can be used as the watershed for judging its strength!

COST Costco Wholesale Corporation Options Ahead of EarningsIf you haven`t bought COST ahead of the previous earnings release:
Then analyzing the options chain and the chart patterns of COST Costco Wholesale Corporation prior to the earnings report this week,
I would consider purchasing the 540usd strike price Puts with
an expiration date of 2023-10-20,
for a premium of approximately $6.30.
If these options prove to be profitable prior to the earnings release, I would sell at least half of them.
Looking forward to read your opinion about it.

Earnings JournalAT A GLANCE
Simplistic Analysis: swing back to the trendline.
Earnings Anticipations: positive surprises for EPS & Revenues.
Trade Type: Touch & Go don't wait for a close.
Research Depth: technical glance only.

COST Daily - potential Inverse Head & ShoulderCOSTCO daily seems to be forming Inverse Head and Shoulder Pattern.
I think we either base at 555 or 550 at the minimum to complete the right shoulder and head towards 570.
Costco reports Earnings on 26th September.
Inverse H&S valid as long as we hold 550 on the daily. If we lose 550, cut the trade and will re-enter again if it goes above 550.

Costco Wholesale Corporation (symbol ‘COST’)
Costco Wholesale Corporation (symbol ‘COST’) share price rose by 6% in the quarter ended on 31/08/2023 in a rather steady bullish momentum. The company’s earnings report for the fiscal quarter ending August 2023 is expected to be released on Tuesday 26th of September, after market close. The consensus EPS is $4.71, up from $4.20 in the same quarter last year.
‘The company’s financial condition is rather balanced without any exciting indications with a low debt to equity ratio of around 28% and a current ratio of just above 100% ( 108% to be precise) as of 31/05/2023. On the other hand the company is not very popular in terms of paying out dividends with a dividend yield ratio of less than 0.8% making it not very appealing to large investors.’ said Antreas Themistokleous, trading specialist at Exness.
Technical analysis shows the price has resumed its bullish momentum after some losses incurred in mid August and is currently on the move to fully cover these losses. The upper band of the Bollinger bands proved to be a strong resistance level and caused the price to correct to the downside in the recent sessions. The 50 day moving average is trading well above the 200 day moving average while the price continues to trade above the daily bullish trendline pointing to the North for the near short term outlook.
On the other hand the Stochastic is recording extreme overbought levels indicating that a bearish move might be visible in the coming sessions but there are no other signals of a correction so that scenario might not play out at least for now.

COST - strongest seasonal opportunity on my watchlistI'm sharing a more in-depth update to my Costco post earlier this month. NASDAQ:COST is a top holding that I like to keep a close eye on. 1-2 times a year, we can find decent opportunities to use swing trades to accumulate and I think that we have two of those opportunities in front of us right now. We've got an immediate setup with clear chart pattern and a brief seasonal drawdown, and a larger setup supported by the strongest seasonal trend in my watchlist.
Long term trend:
We observe repetitive price action within the channel for the long term primary trend. COST regularly moves to the top of the channel, undergoes a secondary corrective trend, and executes a measured move on the breakout of the secondary trend. Note that reverting back to the lower portion of the channel should be expected, emphasizing the importance of profit taking to build this position.
Immediate trend and our first setup:
We recently saw COST make a large measured movement on the May break out of a long term symmetrical triangle. It set up a small replay of this pattern from mid August to September, but hasn't completed the measured move. As previously covered, September is seasonally weak for the broader market and this is typically the worst portion of the month. Thus, a throwback to the cradle of the triangle ~$551-553 is probable. Breakouts from symmetrical triangles have high probability to revisit the cradle and this level also aligns to volume weighted average prices (VWAPs) anchored from highs and lows prior to the pattern, as well as the direction of the 50EMA. Note the fib time zone anchored to the May breakout. This has aligned to peaks and troughs and lines up to where we can expect to see a seasonal high (November) and seasonal low (December/January).
This sets up the first setup:
Entry ~551-553 the cradle of the current symmetrical triangle and VWAPs from the the high and low prior to it's formation.
TP $570 at the top of the measured move.
SL $527 which is 1 average true range (ATR) below the VWAPs from the last two lows in the prior symmetrical triangle.
Note - Since I already have a very low cost basis I won't use a SL for the first setup and will instead use a much more aggressive stop loss from the second setup.
Seasonal trend and our second setup
In terms of seasonality, COSTs two consecutive strongest months of the year are October and November. And the lowest performing month December. COST has closed positively in each of the last 10 Novembers with an average return of 5.5%. Expanding to 20 years we see that there are only 2 of 20 Novembers that have had a negative close (one of which was during the great recession).
The confluence between the fib time zone and seasonality anticipate hitting the objective of our first move in the October/November time frame. The December seasonality and January fib time zone confluence project a pullback to open up our second opportunity. However, be aware that macro events or strong guidance in September earnings could shift our pivot points.
Second setup:
Entry - ~$537 which aligns to the 0.382 fib of the extension from the May low to our last high, and aligns to the trending paths of the VWAPs from the April and May lows.
TP - ~$590-600 which align to 1.618 fib of a retrace from the $570 high to our entry, as well as the top of the channel and the prior all time high. Note that this is exceeds the current 12-month consensus price target.
SL - ~$508-510. This should fall 1 ATR below the bottom of the bottom of the channel, as well as the 200SMA.

Great Company, But Getting A Little HeavyI'm a big fan of Costco, but it's trading at 40x and I think the 560 are warrants a pullback.
not financial advice, good luck to all :)

COST: Buy ideaBuy idea on COST as you see on the chart after the breakout with force the resistance line and the vwap indicator by a big green candle with a large green volume. Thanks.

COST pre-earnings updateNASDAQ:COST August sales show a YoY 5% increase. They don't report until the 26th, but this suggests that we'll see a decent quarter. Current analyst 12mo consensus is ~$570.
The breakout from its symmetrical triangle didn't reach the full extension that I had originally drawn. Taking a measured move into the pattern from an area of prior resistance, we can see the where the pattern will tighten within the triangle, and the proportional extension when it exits. The breakout of from this pattern puts COST back into its long term rising channel.
I anchored variable weighted average price from the May dividend, and then two more from two recent pivot points. Right now we can see that price finds support at the VWAP from dividend and is running into resistance at the VWAPs from recent pivots. This suggests that ~530 will remain key support. A close below 530 could retest 509-520. A close below 510 would be cause for concern.
I added a lot below $510, took profits between $550-560, and began reaccumulating at ~$530. Right now I'll plan to keep accumulating between ~530-535, and any opportunities between 510-520. I'll re-evaluate if we see a close below the rising channel.

Double TopIt looks like a double top occurred after COST met the 100% mark for the triangle.
There is also a RSI Divergence at the Double top. Price does not match RSI. There are other indicators folks use to spot Divergences.
Earnings late September.
Dark Cloud Cover candle pattern which is bearish so far today.
Dark Cloud Cover is a candlestick pattern that shows a shift in momentum to the downside following a price rise. The pattern is composed of a bearish candle that higher than the previous session but then closes below the midpoint of the prior bullish candle.
Dark Cloud Cover can morph in to an bearish engulfing candle if much more selling occurs today.
No recommendation

Short, target 529Following daily chart.
Got a short signal
TP - EMA100 or 529
SL - 567.81 - Please wait daily close to stop.

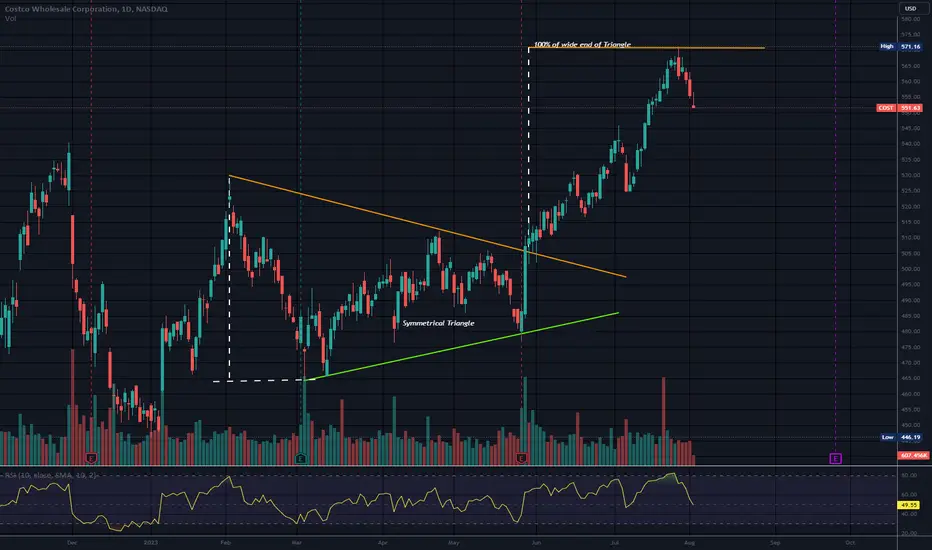
Symmetrical TrianglePrice has reached almost the exact mark of a 100% move from the Triangle.
The measure of the wide end of the triangle is projected from the point of the break to guesstimate targets. This one has reached the 100% mark (dashed line) but it is possible for a triangle to reach a lower or a higher level that 100%
Ugly red candles on daily, weekly and monthly today but this can change.
I just though this was cool when I measure it. LOL
No recommendation
COST the retailing warehouse chain LONGCOST had lackluster earnings two months ago and is due for another report in
late September, Despite the earnings miss, COST immediately uptrended as if
traders and investors were expecting far worse. Since June 1st, COST has been
in an ascending parallel channel bounded by the dynamic support and resistance
of the first and second VWAP standard deviation lines above the mean as anchored
to a date before the earnings. The MACD is currently showing bearish divergence
while COST is at the upper resistance in the channel. As a result I will place
a short trade on COST here with a stop loss above that red dynamic resistance
line. Upon managing the trade, I will close and reopen the trade long when price
meets the lower support blue VWAP line and is likely to reverse.

$COST BreakoutCostco is breaking out on a longer-term time frame and I suspect a catalyst news event will allow it to climb higher. I suspect this will be either a membership price increase, a stock split, or some acquisition which will improve revenue guidance and/or improve profit margins.
