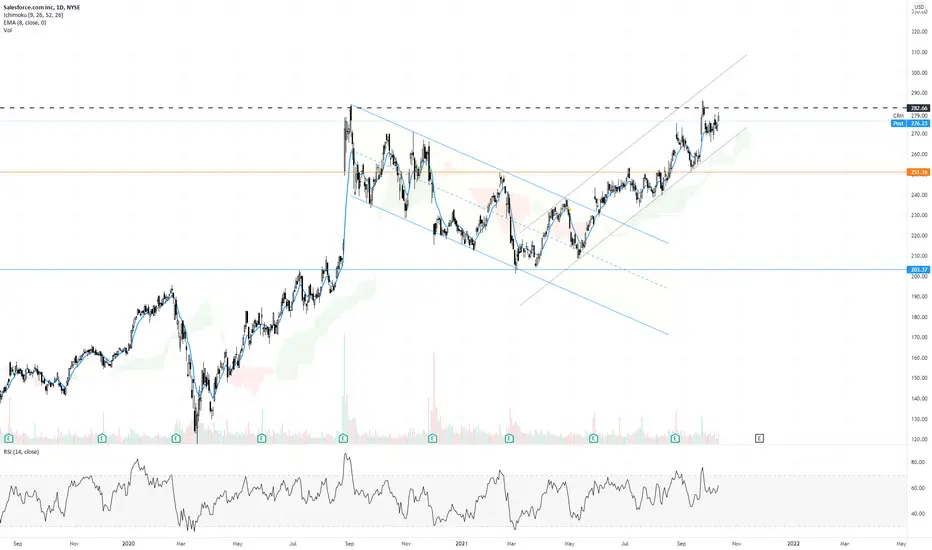
Salesforce.com Dips into Oversold Territory Before EarningsSalesforce.com is showing some potentially interesting patterns ahead of quarterly results tomorrow afternoon.
Notice how CRM’s decline in the last week brought the Dow Jones Industrial Average member under its 50-day simple moving average (SMA) for the first time since August.
Next, prices have revisited the $284.50 area where they peaked in August 2020 and September 2021. Will traders look for old resistance to become new support?
Third, the pullback dragged stochastics into an oversold condition.
Overall, earnings are always a period of uncertainty. But in this case, the pullback to some important levels may have offset some of the risk. That could be especially true considering CRM’s strong results on August 25 and increased revenue guidance on September 23.
TradeStation is a pioneer in the trading industry, providing access to stocks, options, futures and cryptocurrencies. See our Overview for more.
Important Information
TradingView is not affiliated with TradeStation Securities Inc. or its affiliates. TradeStation Securities, Inc., TradeStation Crypto, Inc., and TradeStation Technologies, Inc. are each wholly owned subsidiaries of TradeStation Group, Inc., all operating, and providing products and services, under the TradeStation brand and trademark. When applying for, or purchasing, accounts, subscriptions, products and services, it is important that you know which company you will be dealing with. Please click here for further important information explaining what this means.
This content is for informational and educational purposes only. This is not a recommendation regarding any investment or investment strategy. Any opinions expressed herein are those of the author and do not represent the views or opinions of TradeStation or any of its affiliates.
Investing involves risks. Past performance, whether actual or indicated by historical tests of strategies, is no guarantee of future performance or success. There is a possibility that you may sustain a loss equal to or greater than your entire investment regardless of which asset class you trade (equities, options, futures, or digital assets); therefore, you should not invest or risk money that you cannot afford to lose. Before trading any asset class, first read the relevant risk disclosure statements on the Important Documents page, found here: www.tradestation.com .
CRM trade ideas


CRM Ready to Crash?CRM looks to have lost its bullish momentum. My guess is that it'll consolidate near the $312 resistance before ultimately falling to AT LEAST $287. My bold prediction is that it'll fall to $267 by Dec 10 and use the top of the gap as a support for a bounce but...Only Time Will Tell


Let's all buy a metric shit ton of $CRM and get rich.This is a chart of $CRM. The bars pattern is of $FTNT. You can do this with $ADBE and a number of other tech stocks as well. You'll probably notice $ADBE is leading, I'm betting $CRM will follow. Both will catch up to $FTNT.
The structure is ready, we've been drawing this bull flag forever. We've lost all hope in stocks. Biden flushed everyone out that is scared of a little tax bump but only poors worry about taxes... they sold the bottom. It's time.

CRM Bearish DivergenceBeen expecting CRM to fall for a week or so yet the price continued to slowly rise, but it seems as though the time has come. CRM has created a bearish divergence at an all time high and it may get ugly. CRM created a six dollar gap on this previous uptrend - look for CRM to fill that gap.
Aggressive Entry: $294.84 (look for rejection on a retest)
Conservative Entry: $289.32
Price Target One: $278.27
Price Target Two: $260.61


CRM Channel trade🐻Looking for a rejection off of resistance or 300$ today. Trendline support is at 296 , after that there's split channel support at 287 which is target 1.
Target 1 will be a tough area to short through as you can see the amount off touches and the 21ema is also in that area so look for a bounce there for a fall through to target 2


CRM in uptrend regression channelLooks like CRM could be in a uptrend regression channel.
If this is true, a possible price target might be 0.618 Fibonacci which is ~324$ or ~+10%
Stop loss: 269$ or -8.5%
==> risk/reward ratio a little bit better than 1:1 is not very tempting - so I don't recommend to enter the trade now.
If you're long already you might want to hold for more profit.
This is not financial advice.

CRM POTENTIAL 5 POINT MOVECRM is showing a potential break on the Daily Chart for a short 5 point move to 300.
The 1hr is already showing an entry with initial room to 295 first and if price breaks 295, it has room to 299-300.
Stop loss 289.50.
I like the consolidation back to the 21Ma on the daily chart and the weekly chart isn't bad either.

$CRM - Sky is the limitBreakout from 1-year long rounding bottom on 10/14 allowing for new ATH and has been consolidating for several trading days. Above 10/19 high of 295.53 is a good entry to go long.

CRM BearishCRM has been trending up since last week and now it looks as though investors are getting ready to take profits.
- Slow Stochastic is curving down at the top of channel
+ Slow Stochastic is at 97
+ RSI overbought
+ MACD shows slight slowing
+ gravestone Doji at the top of uptrend (bearish)
October 19 CRM started to trend downwards around mid-day, so momentum is slowing.
Price Target One: $284.54
Price Target Two: $275.44

SalesForce CRM short 15min monitor 5minSalesForce CRM short 15min monitor 5min
1:98
Looks good trade.
Lets monitor.
Small lot size
Disclaimer: just an idea

10/17/21 CRMSalesforce.com Inc. ( NYSE:CRM )
Sector: Technology services (Packaged Software)
Current Price: $291.66
Breakout price trigger: $284.50 (hold above)
Buy Zone (Top/Bottom Range): $289.80-$275.50
Price Target: $332.00-$335.90 (1st), $418.00-$422.00 (2nd)
Estimated Duration to Target: 110-117d (1st), 335-374d (2nd)
Contract of Interest: $CRM 1/21/22 300c, $CRM 1/20/23 400c
Trade price as of publish date: $12.50/cnt, $9.85/cnt


CRM - Buying OpportunityTextbook ascending triangle pattern.
This is what happened...
1) Breakout 2) New all time high 3) Healthy pullback/ retest of breakout level 4) Popped into new ATH's.
It could pull back to around $287, but I'm looking for continuation to $300.

CRM BreakoutCRM made a breakout yesterday
Want to see a follow through today
1 Year long base
Price above 200DMA


CRM is about to RIPCRM is setting up for a huge breakout. RSI & MACD are looking strong. Anticipating a gap and go over resistance tomorrow provided the FED doesn't tank the market today.

Ready for breakoutI haven't been trading this lately but the chart caught my attention. We might be looking at a breakout soon on this.