TradingView Show: New Trade Ideas and The Leap TradeStationJoin us for a timely TradingView live stream with David Russell, Head of Global Market Strategy at TradeStation, as we break down the latest rebound in the markets and what it could mean for traders and investors. In this session, we’ll dive into:
- The upcoming Fed meeting and what policymakers might signal heading into the second half of the year
- Why the 10-year yield nearing 4.5% is important — and how to set alerts to stay ahead of key moves
- Summer trading strategies to navigate slower market conditions and spot emerging opportunities
- A closer look at Latin American equities, with names like Mercado Libre in focus
- The surprising strength in stocks that have doubled since the tariff-driven selloff
- How energy and oil markets are reacting to renewed geopolitical tensions in the Middle East
- And other trends that are shaping the broader investment landscape
Whether you're trading short-term setups or planning longer-term plays, this session will give you fresh insights and practical takeaways to help you stay prepared and informed through the summer months.
Bonus: Discover our latest broker integration update with TradeStation—now supporting equity options trading directly on TradingView. This upgrade brings advanced tools like the strategy builder, options chain sheet, and volatility analysis to your fingertips, making it easier to trade through uncertain market conditions.
This session is sponsored by TradeStation, whose vision is to provide the ultimate online trading platform for self-directed traders and investors across equities, equity index options, futures, and futures options markets. Equities, equity options, and commodity futures services are offered by TradeStation Securities Inc., member NYSE, FINRA, CME, and SIPC.
Disclosures from TradeStation:
tradestation.com/insights/etf-disclosures/
tradestation.com/important-information/
DISND trade ideas

DIS Weekly Options Outlook (Week of 2025-06-09)📈 DIS Weekly Options Outlook (Week of 2025-06-09)
🧠 Multi-Model AI Consensus | NYSE:DIS
This week, multiple AI models show short-term bullish momentum for Disney ( NYSE:DIS ), but technical overbought signals and options market dynamics point to potential pullback risks near $113 into Friday’s expiration.
🧪 AI Model Insights:
🔹 Grok/xAI
• Momentum: Bullish (5-min MACD +, price > EMAs)
• Risk: Daily RSI overbought, MACD histogram red
• Trade: Buy $116C @ $0.73 → PT: $1.095 (+50%), SL: $0.365 (–50%)
• Confidence: 70%
🔹 Claude
• Momentum: Bullish on 5-min + daily RSI (~75), volume up
• Trade: Buy $117C @ $0.40 → PT: $0.80 (+100%), SL: $0.20 (–50%)
• Confidence: 68%
🔹 Llama
• Momentum: Bullish; price > EMAs, MACD up, RSI not extreme
• Note: Max pain pullback risk to $113
• Trade: Buy $116C @ $0.73 → PT: $0.87 (+20%), SL: $0.365
• Confidence: 70%
🔹 Gemini
• Momentum: Strong bullish on 5-min, but daily MACD lagging
• Trade: Buy $117C @ $0.40 on breakout > $115.70
→ PT: $0.80 (+100%), SL: $0.20
• Confidence: 65%
🔹 DeepSeek
• Momentum: Bearish bias due to overbought RSI, MACD divergence
• Trade: Buy $113P @ $0.24 → PT: $0.48 (+100%), SL: $0.12
• Confidence: 65%
✅ Consensus Summary:
Market Bias: 📊 Moderately Bullish, but watch for gravity toward $113 max pain
Best Setup: Long weekly naked calls ($116–$117 strikes)
Strategy Type: Single-leg call
Key Levels:
• Resistance: $118 (heavy call OI)
• Pullback Risk: $113 (max pain zone)
📌 Suggested Trade Setup
🎯 Symbol: NYSE:DIS
📅 Expiry: 2025-06-13
🟢 Strike: 117 CALL
💵 Entry: $0.40
🎯 Profit Target: $0.80
🛑 Stop Loss: $0.20
📈 Confidence: 68%
⏰ Timing: At open or breakout > $115.70
⚠️ Risk Watch:
• Overbought RSI may trigger fade
• Max pain pressure into expiry
• Call-heavy OI at $116–$118 may cap upside

It’s a Buy. DISNEYWeekly entry, strike ATH Great place to take a risk. Weekly hold above 50 and 200 MA

The Walt Disney Stock Future Goes 'Shining Bright as Never'The Walt Disney Company’s stock (DIS) has demonstrated robust performance following its Q2 2025 earnings release a week ago, with both fundamental and technical indicators reflecting positive momentum.
Here’s a detailed analysis:
Fundamental Perspective
Disney’s Q2 2025 results exceeded expectations, driven by strong execution across its entertainment, streaming, and experiences segments. Key financial highlights include:
Revenue Growth. Revenues rose 7% year-over-year (YoY) to $23.6 billion, surpassing estimates of $23.14 billion.
Profitability Surge. Adjusted EPS jumped 20% YoY to $1.45, beating forecasts of $1.20. Net income swung to $3.3 billion from a $20 million loss in Q2 2024.
Streaming Strength. Disney+ added 1.4 million subscribers (reaching 126 million globally), defying expectations of a decline. Combined Disney+ and Hulu streaming operations generated $336 million in profit, a sevenfold increase from $47 million YoY.
Guidance Upgrade. Disney raised its fiscal 2025 adjusted EPS forecast to $5.75 (up 16% YoY), citing confidence in double-digit operating income growth for entertainment and sports, and 6%-8% growth for experiences.
Growth Drivers:
Entertainment. Segment operating income rose $0.5 billion YoY to $1.3 billion, fueled by streaming profitability and box office success (e.g., Moana 2).
Experiences. Theme parks and consumer products saw higher attendance, guest spending, and cruise demand, though international parks faced headwinds in Shanghai and Hong Kong.
Strategic Initiatives. The upcoming Abu Dhabi theme park and ESPN’s direct-to-consumer launch are expected to drive long-term growth.
Technical Perspective
Disney’s stock firstly reacted positive to the earnings beat, reflecting renewed investor confidence:
Price Action. Shares surged 10-12% post-earnings, hitting an intraday high of $103.31. Over the past month, DIS gained 31%, including a 20% rally in five days.
Valuation. The stock trades at 18.4x forward earnings and 2.1x sales, a premium to industry averages but below its historical norms.
Analyst Sentiment. The average price target stands at $126.50 (14% upside), with a Street-high target of $148 (33% upside).
Technical Indicators:
Momentum. The breakout above key resistance levels (e.g., $100) signals bullish sentiment, supported by high trading volume.
Volatility. Beta of 1.01 aligns with market volatility, while short interest remains low at 1.24% of float.
Risks and Considerations
Macroeconomic Uncertainty. Disney acknowledged potential impacts from tariffs and global economic conditions.
Valuation Premium. While growth prospects justify some premium, prolonged macroeconomic stress could pressure multiples.
Investors challenge
Disney’s Q2 2025 results underscore its ability to execute on streaming monetization, theme park innovation, and content-driven growth.
Fundamentally, raised guidance and streaming profitability signal a turnaround, while technically, the stock’s breakout suggests locally bullish momentum.
Following historical patterns we are Bearishly tuned at this time, with targets to fill the gap at $92.17 per share (left after Earnings report), and drilling all the way below.
--
Best wishes,
@PandorraResearch Team
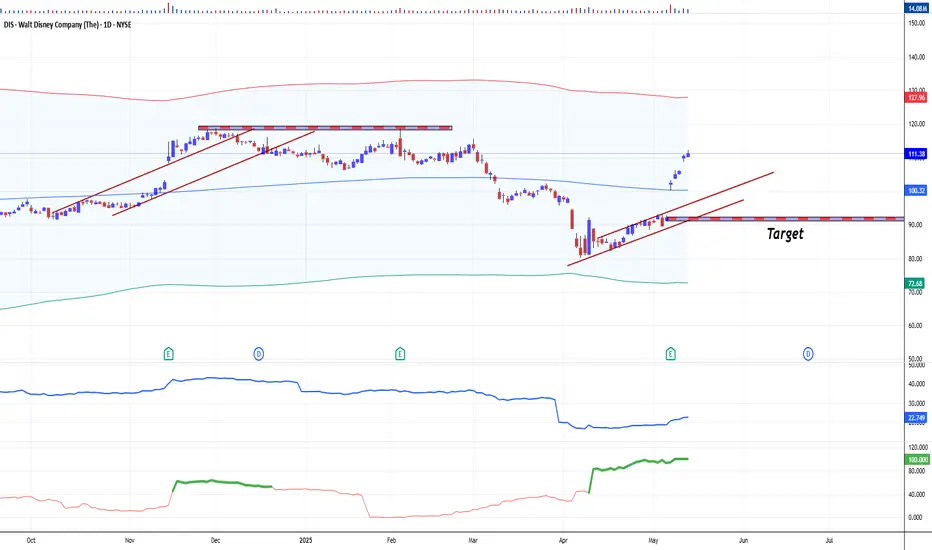
Disney Wave Analysis – 15 May 2025
- Disney rising inside impulse wave (1)
- Likely to reach resistance level 119,00
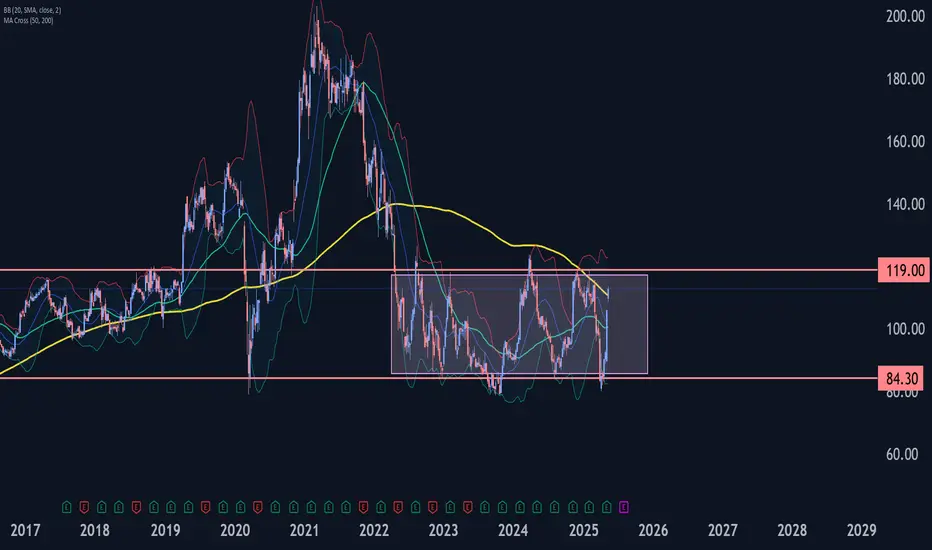
Disney continues to rise inside the sharp weekly upward impulse wave (1), which started earlier from the long-term support level 84.30 (which has been reversing the price from the end of 2022).
The support level 84.30 is the lower boundary of the extended multi-year sideways price range inside which the price has been moving since the middle of July.
Disney can be expected to rise to the next resistance level 119,00, which is the upper border of the active weekly price range.

DIS is already at $96.… Don’t miss the train!🚨 🎢✨Disney (DIS) is pushing up and showing strength — are you watching this move? 👀 We’ve been eyeing entry levels between $91 and $81, but with the price at $96.30, this setup is heating up faster than expected! 🔥
Sometimes the perfect dip doesn’t come — and waiting too long can mean watching the rocket 🚀 from the sidelines. If you’re still tracking DIS, this might be your sign to stay alert and have your strategy ready. 🎯
Potential targets? Still aiming for that juicy $100–$120 range if momentum continues! 📈💰
Let’s see how it plays out — keep your plan tight and emotions out. Are you in, or still waiting? 😎👇
📌 Disclaimer: This is not financial advice. Always do your own research and consider speaking with a financial professional before making any investment decisions.

Walt Disney Co | DISThe Walt Disney Company is reportedly exploring options to sell or find a joint venture partner for its India digital and TV business, reflecting the company's ongoing strategic evaluation of its operations in the region. The talks are still in the early stages, with no specific buyer or partner identified yet. The outcome and direction of the process remain uncertain. Internally, discussions have commenced within Disney's headquarters in the United States as executives deliberate on the most viable course of action. These deliberations signify the company's willingness to adapt and optimize its business operations to align with changing market dynamics. The Wall Street Journal reported on July 11 that Disney had engaged with at least one bank to explore potential avenues for assisting the growth of its India business while sharing the associated costs. This approach suggests a proactive stance by the company to explore partnerships or arrangements that can drive growth while minimizing financial burdens. While it is too early to ascertain the exact direction this exploration will take, the developments in Disney's India business warrant attention, as they may shape the future landscape of the company's presence in this all-important region.
The ongoing shift from traditional TV to streaming has placed Disney and its competitors in a costly and transformative phase. As part of this transition, Disney is actively cutting costs amid macroeconomic challenges that have impacted its advertising revenue and subscriber growth. CEO Bob Iger has been at the forefront of these changes, and his contract was recently extended through 2026 to allow him sufficient time to make transformative changes while strengthening the bench with future leaders of the company.
One of the key considerations for Disney is evaluating its portfolio of TV networks, including ABC and ESPN. Bob Iger has expressed a willingness to be expansive in assessing the traditional TV business, leaving open the possibility of selling certain networks while retaining others acknowledging that networks like ABC may not be core to Disney's new business model. ESPN, as a cable TV channel, is being approached differently. Disney is open to exploring strategic partnerships, such as joint ventures or offloading ownership stakes, to navigate the challenges faced by the sports network. CEO Iger, who had previously expressed pessimism about the future of traditional TV, has found the situation to be worse than anticipated since his return to Disney.
Although the linear networks segment, which accounts for Disney's TV properties such as ABC, National Geographic, FX, and FreeForm, has struggled to grow in the recent past, this segment is still an important part of the company's business, which is evident from the positive operating income reported by this segment in fiscal 2022. As below data reveals, the DTC business and content licensing made operating losses in FY 2022 which were offset by the operating income reported by linear networks. For this reason, investors will have to closely monitor a potential sale of TV assets to evaluate the impact of such a decision on Disney's profitability.
The broadcasting landscape is experiencing a significant shift, with uncertainties surrounding its future and the changing nature of consumer preferences. While linear television channels are not expected to disappear immediately, their consumption continues to decline as viewers increasingly favor OTT platforms. This transition represents a fundamental trend shaping the industry. In terms of business models, subscription video-on-demand (SVOD) services will continue to grow with targeted advertising.
As the ascent of streaming video continues, cable, satellite, and internet TV providers in the United States faced their most significant subscriber losses to date in the first quarter of 2023. Analyst estimates indicate a collective shedding of 2.3 million customers during this period. Consequently, the total penetration of pay-TV services in occupied U.S. households, including internet-based services like YouTube TV and Hulu, dropped to its lowest point since 1992, standing at 58.5%, according to Moffett's calculations.
In Q1, pay-TV services in the U.S. witnessed a nearly 7% decline in customers compared to the previous year, with cable TV operators experiencing a 9.9% decline, while satellite providers DirecTV and Dish Network registered subscriber losses of 13.4%. Virtual MVPDs, which are multichannel video programming distributors, also suffered significant losses, shedding 264,000 customers during the quarter. Comcast, the largest pay-TV provider in the country, lost 614,000 video customers in Q1, and Google's YouTube TV was the only tracked provider to experience subscriber growth, adding an estimated 300,000 subscribers during the period. These trends illustrate the challenges faced by the pay-TV industry, with factors like increasing sports-broadcast fees driving retail prices higher, leading to cord-cutting and subsequent price adjustments by distributors. By 2026, e-Marketer predicts that the number of non-pay TV households will surpass pay TV households by over 25 million.
In efforts to achieve profitability in the streaming business, Disney has implemented significant cost-cutting measures, including saving $5.5 billion through cost reductions and layoffs, and a focus on making Disney+ and Hulu more profitable. Disney aims to enhance Hulu integration, seeing it as a vital component of the company's transition from TV to a streaming-only model. Discussions are also underway for Disney to acquire Comcast Corporation's (CMCSA) stake in Hulu, as Disney currently holds 66% ownership. The company believes that the integration of Hulu and Disney+ will bolster the streaming business and contribute to its profitability. While the negotiations with Comcast over Hulu's valuation are ongoing, the combined offering of Disney+ and Hulu is expected to be available to consumers by the end of the calendar year. Although Disney's plans for ESPN+ and the fate of its other cable channels, such as the Disney Channel, remain uncertain, Bob Iger expects ESPN to eventually move to a streaming-only model, acknowledging the disruptive nature of the traditional TV business model.
The discussions surrounding Walt Disney's TV and streaming business in India come at a critical juncture for the company, as it grapples with intensified competition and significant challenges in the market. The emergence of Reliance Industries' JioCinema streaming platform has posed a considerable threat to Disney's dominance, especially after Reliance secured digital rights for the highly popular Indian Premier League cricket tournament. This strategic move by Reliance, which offered free access to the tournament earlier this year, caused a substantial decline in Disney+ Hotstar's subscribers, a popular streaming service under Disney's India business.
Additionally, Viacom18, which is backed by Reliance and Paramount Global (PARA), made a significant impact on Disney's market position in India. Through its partnership with Warner Bros, Viacom18 secured content rights to popular shows on HBO including Succession, previously aired on Disney's platform. This collaboration forms a formidable alliance challenging Disney's dominance in the Indian market. Reliance's freemium model poses the most significant threat to Disney's current position. By offering content for free on its streaming platform, JioCinema attracted a substantial number of subscribers through the broadcast of IPL. With its ample cash reserves, Reliance has the advantage of focusing on subscriber growth without immediately focusing on monetization strategies. The loss of streaming rights for the IPL, combined with a subsequent decline in paid subscribers, had a profound impact on Disney's reputation in India in the first quarter of this year, which could very well be the most challenging Q1 Disney has had in India for a long time.
A report on video consumption trends in India by Media Partners Asia sheds light on the dynamic landscape of the online video sector in India. For the 15 months that ended in March 2023, total consumption across the online video sector reached a staggering 6.1 trillion minutes. During this period, Disney+ Hotstar emerged as the dominant player in premium VOD, capturing 38% of viewing time. The report attributes Hotstar's success to its strong sports offerings and the depth of its Hindi and regional entertainment content.
During the survey period, Zee and Sony together held a 13% share of the Indian premium video sector viewing time. While the two companies are expected to merge pending regulatory approval, they are projected to operate independently for another year, benefiting from strong engagement across sports as well as regional, local, and international content. Prime Video and Netflix, Inc. (NFLX) collectively accounted for a 10% share of viewership in the premium VOD category. Prime Video also garnered a significant portion of viewership from regional Indian titles. The report emphasizes that local content dominates premium VOD viewership, particularly outside the sports category, while international content leads paid tiers. Catch-up TV is prevalent in the free tier across freemium streaming platforms.
Although Disney was the clear winner in 2022, this report highlights a significant shake-up in the market brought about by the transformation of JioCinema. JioCinema, which previously held a mere 2% share of the premium video market, experienced a major upswing in growth since April. This surge can be attributed to JioCinema's decision to offer free live streaming of the popular IPL cricket tournament, a property that was previously exclusive to Disney-owned media in India. Despite technical glitches impacting user experience, JioCinema witnessed a more than 20-fold increase in consumption in April 2023, enabling it to dominate the premium VOD category. The report raises questions about JioCinema's ability to sustain this growth and scale in the absence of IPL action after June 2023. That being said, this could be an early indication of growth challenges Disney-owned brands may face in India.
Star India, now known as Disney Star following the rebranding last year, is expected to experience a revenue drop of around 20% to less than $2 billion for the fiscal year ending September 2023. Additionally, EBITDA is projected to decline by approximately 50% compared to the previous year. Furthermore, Hotstar is estimated to lose 8 to 10 million subscribers in its fiscal third quarter as well.
Given the current scenario, finding an outright buyer for Disney's India business is expected to be challenging. When Disney acquired the entertainment assets of 21st Century Fox in 2019, the enterprise value of the Indian business was estimated at around $15-16 billion. This high valuation, coupled with the intense competition and declining subscriber base, presents a complex landscape for potential buyers or partners.
I believe Disney stock is attractively valued today given that the company's streaming business has a long runway for growth internationally while its brand assets will continue to drive revenue higher. As an investor, I am both concerned and curious about what the future holds for Disney's linear networks segment. Going by the recent remarks of CEO Iger, major changes are on their way. A strategic decision to divest non-core assets, in my opinion, will trigger a positive response from the market. That being said, a major divestment of TV assets could materially impact the company's profitability in the next 3-5 years until its streaming business scales enough to replace lost revenue from the linear networks segment. Investors will have to closely monitor new developments to identify a potential inflection point in Disney's story.

DIS watch $84.19-84.56: Key support might say "Bottom Is In"DIS struggling to maintain any altitude at all.
Lost all of the tariff relief bump, looking weak.
See if bulls hold key support zone $84.19-84.56

Disney Stock Pops on Strong Earnings Data. Turnaround Working?The Magic Kingdom just pulled a rabbit out of its hat — and Wall Street’s loving it.
Disney stock NYSE:DIS surged 11% on Wednesday, not just for its best day in a year, but for the kind of earnings beat that makes analysts reconsider their entire valuation model while retail traders tweet “ NYSE:DIS to the moon.”
Is the House of Mouse finally finding its footing? Just a day ago, Disney shares were languishing 60% below their 2021 record. Let’s break it down.
♫ Earnings That Deserve Their Own Theme Song
Starting with the headline: adjusted earnings per share clocked in at $1.45 , stomping the $1.20 consensus estimate. Revenue came in at $23.62 billion, a 7% jump from last year’s earnings performance and another beat that sent traders racing for their mouse ears.
After a year of streaming skepticism, cost-cutting, and investor hand-wringing over whether Bob Iger’s encore CEO tour could work magic, this quarter delivered. Bigly.
💪 Streaming Had No Business Going That Hard — But It Did
Wall Street was braced for a Disney+ subscriber drop. Instead, the company added 1.4 million new subscribers to 126 million, easily topping expectations of 123 million.
Not only are people still subscribing despite price hikes, but the direct-to-consumer segment (Disney+, Hulu, ESPN+) posted revenue growth of 8% to $6.12 billion, powered by both higher prices and surprise stickiness. Operating profit in streaming? A cool $336 million, up from $47 million a year ago.
Disney even raised its full-year adjusted EPS guidance to $5.75, a 16% gain from fiscal 2024 — a confident flex in a market where most companies are still managing expectations with surgical pessimism.
⏫ Mickey’s New Best Friend: Margin Expansion
It wasn’t just top-line fireworks — the net income boom was one for the books: $3.28 billion in profits, compared to a $20 million loss a year ago.
Operating margins in streaming are on the rise. Profitability, once seen as an elusive dream for all the big streaming platforms, is suddenly in sight. Disney is guiding toward $875 million in streaming profit for this fiscal year — and based on this quarter, that may end up conservative.
🎡 Parks Still Pay the Bills — With a Sprinkle of Magic
Now let’s talk about the real engine behind Disney’s machine: the parks and experiences division.
Domestic parks posted a 13% profit increase, powered by higher visitor spending and the launch of a shiny new cruise ship.
That’s important in an economy where every other headline screams “recession imminent.” Disney’s park guests are ignoring macro headwinds and enjoying the fantasy — and that’s music to shareholders’ ears.
Worried about tariffs? Sure, but they haven’t shown up on Disney’s balance sheet just yet. And until they do, Disney’s parks remain a cash printer with castles.
🏟️ A Park in Abu Dhabi — Why It May Be Big
Tucked in among the streaming buzz and EPS upgrade was something that made global investors raise an eyebrow: a new Disney theme park in Abu Dhabi.
On the surface, this sounds like a headline for 2031. And sure, it’ll take a few years to plan and build, and a few more to create the commemorative popcorn bucket. But long-term investors should pay attention.
Abu Dhabi isn’t just a tourist destination — it’s a capital backed by one of the world’s largest sovereign wealth funds and a keen interest in diversifying the revenue streams beyond oil. A Disney park there isn’t just another expansion — it’s a geopolitical bet on premium travel.
As Iger put it, it may seem modest now, but it’s quietly huge for the brand’s future footprint.
👀 What’s Behind the Magic? And Can It Last?
So the big question: is this a one-time sugar rush, or the start of a sustained turnaround?
There are reasons to be optimistic. Disney's streaming growth looks increasingly sustainable. Its content pipeline (including ESPN's evolving digital presence) is improving. The parks continue to defy economic gravity. And Iger seems to be rebalancing the business with a more profitable, investor-friendly mix.
But let’s not forget: content costs are still high, competition in streaming hasn’t gone anywhere, and park margins may come under pressure if consumer sentiment shifts. The macro backdrop remains complicated, and even Mickey can't outwit the Fed forever.
Still, this quarter wasn’t just “less bad than feared.” It was actually good — and that's a narrative shift that could power momentum.
🐭 The Mouse Still Got It
Disney’s earnings report, delivered in the heat of the earnings calendar , could be interpreted as a signal that the entertainment giant isn’t just navigating the new entertainment landscape — it might actually be mastering it.
And in a market starved for upside surprises, Disney just reminded investors that storytelling is its business — and this one’s finally got a happy twist.
The question now is whether traders and long-term holders believe in the next chapter. For now, with the stock back above $102 and the Magic Kingdom delivering financial magic, the bulls are back in the castle.
Your turn: Are you buying into Disney’s turnaround? Holding for the next golden age? Or still side-eyeing that subscriber chart? Let’s hear your play on NYSE:DIS below.

Is Disney’s Chart Forming a Bullish Pattern Ahead of Earnings? Walt Disney Co. NYSE:DIS is set to report fiscal Q2 results next Wednesday (May 7) at a time when the entertainment giant’s shares have shed more than 20% since February and some 55% from their 2021 peak. What does the company’s technical and fundamental analysis tell us?
Let’s see:
Disney’s Fundamental Analysis
Looking for earnings growth? Investors might not find much here.
The Street is currently looking for DIS to report $1.21 in adjusted earnings per share and $1.05 of GAAP EPS on roughly $23.15 billion of revenues for the quarter, which ran through late March.
That would compare to an identical $1.21 in adjusted EPS in the year-ago period on $22.1 billion of revenues (representing sales growth of less than 5% year over year).
Meanwhile, investors will want to see if a recent slide in Disney+ subscribers has continued, or even expanded. Management reported in February reported that Disney+’s customer base sank by roughly 700,000 in fiscal Q1 to 125 million users.
On the bright side, the company also said that combined Disney+ and Hulu subscriptions increased by 900,000 to 178 million during the same period.
Direct-to-consumer advertising (excluding India’s Hotstar streaming service) also rose 16% year over year fiscal Q1. But when including Hotstar, advertising contracted by 2%. So, this is a metric that investors will closely watch as well.
Of course, with forward-looking economic activity in some doubt both domestically and globally, Disney’s “Experiences” segment (theme parks, cruises, etc.) will be key to the firm's ability to traverse the future environment.
This segment has been an absolute driver of corporate performance for several years now, but last quarter, Disney’s domestic parks and experiences finally showed some slowing down.
The unit’s operating income contracted 5% year over year overall, although non-U.S. parks and experiences did better, growing 28%. y/y. However, the non-U.S. segment is a smaller business.
Will families be willing to splurge on a Disney vacation or cruise in a tougher economic climate? Disney could soon find out.
Elsewhere, the company’s Entertainment division will also be in focus when Disney reports its latest results.
Disney’s linear cable-TV networks continue to lose market share, while the recent live-action-movie version of "Snow White" was an absolute embarrassment in terms of dreadful financial performance. Forward guidance for this segment will be crucial.
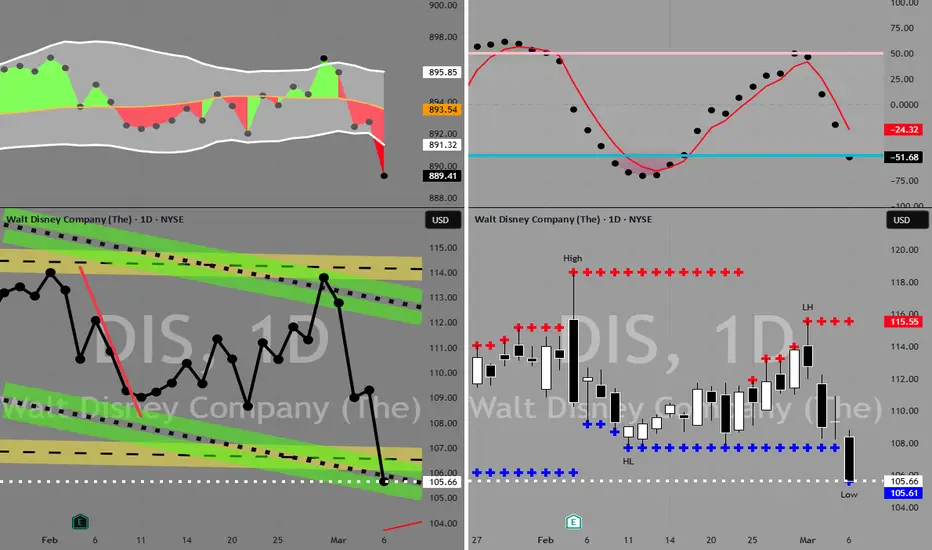
Disney’s Technical Analysis
Now let’s look at Disney’s chart going back to last fall:
Readers will first see the well-developed “double-top” pattern of bearish reversal that spanned from November through early March, as denoted by the “Top 1” and “Top 2” boxes above. This pattern led to a sell-off for Disney that bottomed out in early April.
Now, I might be getting ahead of myself, but I think I also see a partly developed “inverse-head-and-shoulders” pattern under construction at the moment.
Readers will see what looks like a “left shoulder” and “head” pattern in the chart above denoted by purple curving lines at right.
Now Disney was struggling to retake and hold its 21-day Exponential Moving Average (or “EMA,” denoted by the green line above) as I wrote this. A hold above the line could bring some swing traders over to the long side.
And if DIS does hold its 21-day EMA, the stock would next aim technically to make a run at its 50-day Simple Moving Average (or “SMA,” denoted by the blue line at $97.30 in the chart above).
After that, reaching the 200-day SMA (the red line above) would complete an inverse-head-and-shoulders pattern and serve as a bullish sign.
This would put the pattern’s “pivot” or “neckline” almost precisely where Disney’s 200-day SMA currently sits, adding more gravity to the seriousness of retaking or failing at that level.
Meanwhile, Disney’s Relative Strength Index (the gray line at the chart’s top) is currently neutral and literally hints at nothing right now.
That said, the stock's daily Moving Average Convergence Divergence indication (or “MACD,” marked with gold and black lines and blue bars at the chart’s bottom) is improving.
The histogram of Disney’s 9-day EMA (marked with blue bars) moved above zero on April 2 and has remained positive ever since. That’s usually a good sign, but not yet bullish on its own.
Bullish investors would also want to see the 12-day EMA (the black line at the chart’s bottom) move above the 26-day EMA (the gold line), with both above zero.
The 12-day EMA is , in fact, above the 26-day EMA in the chart above. However, both lines must be above zero (as must be the 9-day EMA) to represent a truly bullish signal in historical terms.
Right now, the 12- and 26-day indicators are both below zero, but are moving in a northerly direction.
Am I saying that this is a bullish chart? Not necessarily; we might still be early.
But this chart seems to have great potential. A bullish set-up looks close to being in place. The rest might be up to Disney’s earnings release and guidance next week.
(Moomoo Technologies Inc. Markets Commentator Stephen “Sarge” Guilfoyle had no position in DIS at the time of writing this column.)
This article discusses technical analysis, other approaches, including fundamental analysis, may offer very different views. The examples provided are for illustrative purposes only and are not intended to be reflective of the results you can expect to achieve. Specific security charts used are for illustrative purposes only and are not a recommendation, offer to sell, or a solicitation of an offer to buy any security. Past investment performance does not indicate or guarantee future success. Returns will vary, and all investments carry risks, including loss of principal. This content is also not a research report and is not intended to serve as the basis for any investment decision. The information contained in this article does not purport to be a complete description of the securities, markets, or developments referred to in this material. Moomoo and its affiliates make no representation or warranty as to the article's adequacy, completeness, accuracy or timeliness for any particular purpose of the above content. Furthermore, there is no guarantee that any statements, estimates, price targets, opinions or forecasts provided herein will prove to be correct.
Moomoo is a financial information and trading app offered by Moomoo Technologies Inc. In the U.S., investment products and services on Moomoo are offered by Moomoo Financial Inc., Member FINRA/SIPC.
TradingView is an independent third party not affiliated with Moomoo Financial Inc., Moomoo Technologies Inc., or its affiliates. Moomoo Financial Inc. and its affiliates do not endorse, represent or warrant the completeness and accuracy of the data and information available on the TradingView platform and are not responsible for any services provided by the third-party platform.

Walt Disney LongWalt Disney
Fundamental:
+ Trading at 10Y P/E low = 27 ($86), while average P/E >50 ($180)
+ Expected EPS is likely double, making with average P/E the price to reach $280
+ EPS and Revenue is steadily growing
0 Fair P/E (Lynch) 15x ($45) however the price almost never goes there.
0 # of Shares is fluctuating but no major dilution
Technnical:
+ Below 200D VWMA
+ Bullish volume increase, while Bearish is less
+ At Yearly ATR low
0 Oscillator: 1W Reversal although further downward move possible
- Volume profile: Below PoC, Potential downside to 50 is possible
Entry:
- E1: 80 = $1x
- E2: 60 = $2x
- E3: 50 = $1x
Take:
- 125
- 150
- 200
- 250!
Stop:
< 50

Long-Term Opportunity Amid Volatility: Buy DIS on Weakness for R
-Key Insights: Disney faces near-term headwinds from weak consumer discretionary
performance, inflation risks, and macroeconomic uncertainties. However, its
strong intellectual property portfolio, diversified revenue streams, and
historical resilience in downturns make it an attractive long-term investment.
Investors should consider dollar-cost averaging to build positions during
valuation dips while monitoring quarterly updates for operational strategies and
park performance.
-Price Targets: Based on current market conditions and professional insights,
next week trading levels are as follows:
T1 (Target 1): $85.50
T2 (Target 2): $88.50
S1 (Stop 1): $78.50
S2 (Stop 2): $76.00
-Recent Performance: Disney has historically traded in line with consumer
discretionary sector trends, which have been under pressure due to inflation,
geopolitical risks, and reduced discretionary spending. Although recent
performance is not explicitly noted in the transcript, its stock tends to lag
during recessions before regaining momentum as macroeconomic conditions improve.
-Expert Analysis: Analysts emphasize quality stocks with durable fundamentals
amid volatility; Disney fits this profile due to its global brand dominance and
vast intellectual property portfolio. Recession expectations and housing
weakness may dampen consumer spending, affecting theme park attendance and
streaming subscriptions. Long-term investors will likely benefit from Disney’s
recovery driven by international market growth, cost management improvements,
and strong franchise popularity.
-News Impact: Trade wars and tariffs, especially in China, pose operational
challenges for merchandise and streaming expansion. Rising costs and consumer
spending constraints could impact hospitality revenues and park attendance,
particularly in key domestic locations like Florida and Texas. Geopolitical
developments and earnings updates will play a crucial role in dictating near-
term stock movement.

DIS: Does it deserve its 26x valuation?We’re in what feels like a bear market, where stock ownership demands sharper scrutiny. Valuations are under the microscope, and I want the companies I invest my hard-earned money in to take actions that boost earnings. My investments need to outpace inflation, not lag behind.
Disney’s current P/E ratio is around 27, based on a share price of $83 and trailing twelve-month EPS of $3. I question whether an entertainment company, struggling with money-losing content—contrary to what an entertainment giant should do—merits such a premium. A business with declining margins, stagnant growth, and unprofitable projects doesn’t scream “27x multiple” to me.
Looking back, Disney’s P/E was as low as 12-13 in March 2019, with a share price of $111 and EPS of $9. Over the past decade, Disney’s multiple has inflated while earnings growth has lagged. A P/E of 27 today feels rich compared to its 10-year median of ~23 especially given weaker fundamentals.
If sentiment sours further, I can see Disney’s share price sliding below $80, potentially to $55 (implying a P/E of ~19, assuming EPS holds) or even $45 (P/E of ~13). These levels would align better with a company facing headwinds.
That said, nothing is set in stone. Businesses pivot, and markets shift. Disney could course-correct with sharper strategies or cost discipline. However, after a decade of trading in this range with little earnings progress, I’d be cautious. As a shareholder, I’d consider looking elsewhere for better opportunities.
No trade advice.

DISNEY for sale?Under the 1974 trend line there’s absolutely no bullish argument. Already retraced a 62% of the whole upside movement since the 70’s. Once too big to fall, now maybe it’s a too big to move company. I am aware of the whole books to market ratio, but still see it as a value trap: over exposed to Asia and Europe, streaming isn’t going that well, parks suffering from slowing demand caused by inflation…

Disney in 6M chart (an update for the previous idea).Hello
Please read this article.
I posted my first and last idea of Disney symbol about 6 month ago and I told that this trend is bearish (exactly when there was a powerful bullish candle) and I got "welcome" comments for that. I do not care about your sarcastic comments my friends and I'd told you that I am not ganna to continue this page and I have already terminated my subscription because I am so busy (not for the sake of your comments or TradingView problems).
From the first day of this page I have been trying to change your mind set because this platform is not good place for trading courses and the idea of this forum is to share ideas and not a place for show off.
To be short, please change your beliefs because market never and ever care about what you think and you believe and most of the time trend goes where you do not expect and is not possible.
Note: I am not saying that you should get in sell positions, and please consider that a monthly chart like this is not a good place to decide about daily trades. It can give you a bigger view of what may happen (probably) in the future.
Wait for your confirmations/Invalidations.
Thanks

A short discussion in Disney ChartHello
Please take time and read it.
The notice I want to explain is crystal clear for most Elliott and technical chartists but it is so important that needs to be mentioned again.
Most of you know that a hard time in trading is when you do not know this trend that has started to move wants to stop here or there (or where).
VERY VERY IMPORTANT:
when a wave 3 wants to correct with an ABC its target is wave 4 in lower degree.
It means when traders want to cash their shares and get their profits make a correction (wave 4) that usually has the power to correct just last powerful stops in the wave 4 of lower degree.
It is easier to clarify it in this DIS chart.
As you can see our bullish trend in Millennium counting ended as wave (3) in 203.02 price and then we went to a correction. The question is that "How far will we go down in this declined correction?"
The answer is very easy:
There 2 scenarios :
1- If sell power is not to much so correction wave will go just to the level of last wave 4 in lower degree.
2- If sellers (Buyers for bearish trend) tend and have enough power to break the powerful support zone (Last wave 4 in lower degree) so just wave A of this correction stops in the area of wave 4 (of lower degree) and after wave B this correction will continue its direction more down (commonly to the last wave 4).
In our trend now, it seems that sellers are powerful enough and only wave A of ABC of wave 4 stoped in the area of last wave 4 and wave C (for now we are in wave B of ABC of wave 4) will break down the support level and go more down (potentially to the level of wave 4 Sub-millennium.
I promise you if you consider what I explained you will be more confident in the control of your chart.
Thanks

$DIS - Only for the brave soulsNYSE:DIS Potential head-and-shoulders formation.
$86 to $79 area has not broken since $2015.
Anyone who wants to play the bounce must set a tight stop.👀


Snow White's very low ratings - Bullish Disney stock ?The SnowWhite IMDB rating can't get any worse - could the same be said of Disney stock?
Price is the ultimate proof but buying the shares of a well established company when sentiment is at a low point can be a fruitful endevour.
The poor box office showing + very weak ratings for Snow White - maybe a contrarian buy signal ?
A) The stock is attempting a long term double bottom via is 2020 + 2023 lows
B) A breakout over the downtrend line (orange) could confirm a bullish trend change
Bottom of the ratings ➡️ Bottom in the stock? NYSE:DIS

$DIS keeping it simple, fake pump to $102 ishSimple chart. Seeing some NYSE:DIS flow coming in to the upside short term. Chart looks ok. Giving $100c 4/17 a try. Fill at $3.25.
WSL

DIS in Buy ZoneMy trading plan is very simple.
I buy or sell when at three of these events happen:
* Price tags the top or bottom of parallel channel zones
* Money flow spikes beyond it's Bollinger Bands
* Stochastic Momentum Index (SMI) at near oversold overbought level
* Price at Fibonacci levels
So...
Here's why I'm picking this symbol to do the thing.
Price in buying zone at bottom of channels
Stochastic Momentum Index (SMI) at oversold level
Money flow momentum is spiked negative and under bottom of Bollinger Band
Entry at $105.63
Target is upper channel around $112.50
Looking for the $90 level on DIS?🚀 Looking for the $90 level on DIS? 🎯
Disney (DIS) could be gearing up for a solid move! If you're looking for an entry, key levels to watch are $90, $85, and $80—potential opportunities for those waiting for a dip. 📉💡
On the upside, targets are set at $100, $105, and even $120, offering an exciting profit potential if momentum kicks in! 📈💰
With market conditions always changing, keeping a close watch on price action and overall trends is key. Will DIS find support and bounce back? Stay sharp and trade smart! 🔥✨
📌 Disclaimer: This is not financial advice. Always do your own research and consider consulting with a financial professional before making investment decisions. 🚨
