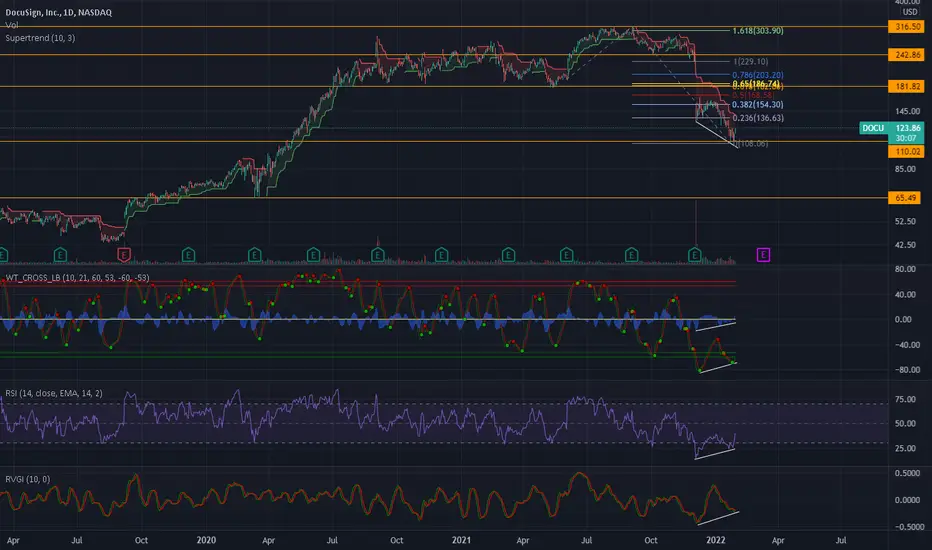
DOCU-Oversold on the 1W chart (not shown).
-Oversold on the daily with lots of bullish divergence showing up in the indicators I like.
-This is worth watching for a reversal, imo, especially if price prints an inverted head and shoulders pattern, which it may be about halfway through printing now.
-We may see support and consolidation around the $110 level before a reversal.
-If a new uptrend starts, my long-term price targets are $155, $180, $230, and $300. There's pretty good confluence between my horizontal support/resistance zones and fib extension levels to support those targets.
-Whatever happens next, I'm keeping my eye on this one. I think it has a lot of potential once it completes a reversal and begins a long-term uptrend.
Never trade based on someone else's ideas.
Have fun, and good luck!
DOCUD trade ideas
Script to monitor MA by multi timeframe to strict BUYI created a simple script "Moving Average MTF - Binancash" based on MA multi-timeframe and Super Trend CCI to strict BUY.
This script is a study case to monitor stock when the market is bearish
Let's use Support & Resistance and stop-loss if you want to try to trade.


DocuSign: Significant breakdown confirms long term reversalDocuSign - Short Term - We look to Sell at 220 (stop at 245)
The continuation lower in prices through support has been impressive with strong momentum and shows no signs of slowing. We have a Gap open at 227 from 03/12 to 06/12. Further downside is expected although we prefer to sell into rallies close to the 220 level. The reaction lower is negative and highlights a clear reversal. Intraday rallies continue to attract sellers and there is no clear indication that this sequence for trading is coming to an end.
Our profit targets will be 140 and 105
Resistance : 180 / 227 / 290
Support : 135 / 105 / 65
Disclaimer – Saxo Bank Group. Please be reminded – you alone are responsible for your trading – both gains and losses. There is a very high degree of risk involved in trading. The technical analysis , like any and all indicators, strategies, columns, articles and other features accessible on/though this site (including those from Signal Centre) are for informational purposes only and should not be construed as investment advice by you. Such technical analysis are believed to be obtained from sources believed to be reliable, but not warrant their respective completeness or accuracy, or warrant any results from the use of the information. Your use of the technical analysis , as would also your use of any and all mentioned indicators, strategies, columns, articles and all other features, is entirely at your own risk and it is your sole responsibility to evaluate the accuracy, completeness and usefulness (including suitability) of the information. You should assess the risk of any trade with your financial adviser and make your own independent decision(s) regarding any tradable products which may be the subject matter of the technical analysis or any of the said indicators, strategies, columns, articles and all other features.
Please also be reminded that if despite the above, any of the said technical analysis (or any of the said indicators, strategies, columns, articles and other features accessible on/through this site) is found to be advisory or a recommendation; and not merely informational in nature, the same is in any event provided with the intention of being for general circulation and availability only. As such it is not intended to and does not form part of any offer or recommendation directed at you specifically, or have any regard to the investment objectives, financial situation or needs of yourself or any other specific person. Before committing to a trade or investment therefore, please seek advice from a financial or other professional adviser regarding the suitability of the product for you and (where available) read the relevant product offer/description documents, including the risk disclosures. If you do not wish to seek such financial advice, please still exercise your mind and consider carefully whether the product is suitable for you because you alone remain responsible for your trading – both gains and losses.

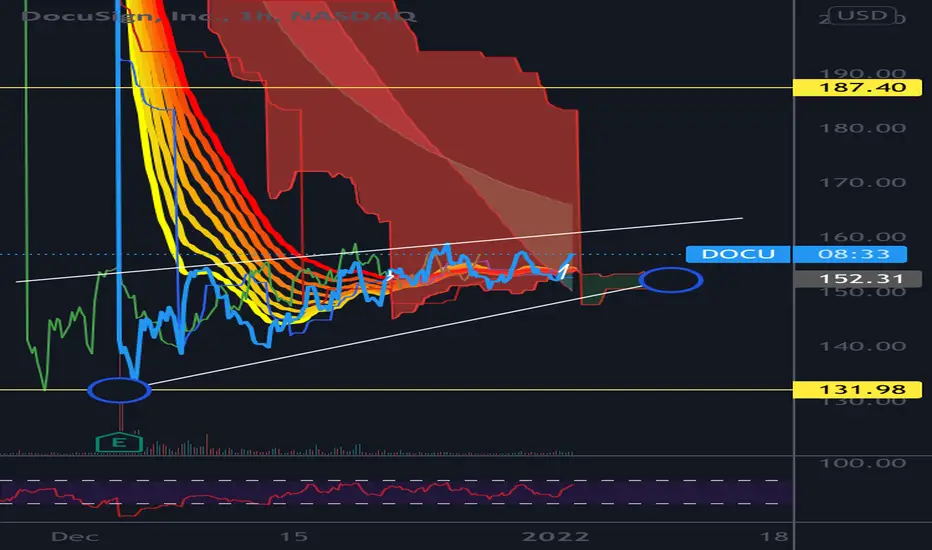
DOCU Yeah that risinf wexge we were speculating could have a bullish break strictly base off of this huge irrational move down as well as the potential of being over sold and just in fact at an excellent buying point Howver as stated a rising wedge is a bearish pattern and breaks down 70% of the time. Once we lost support we dropped to the bottom of the wedge, which is the target of a rising wedge. This setup DOCU for a potential double bottom. Now the main area I am watching for is roughly 154$ as this would be the previous resiatnce line that head price action up during that upward considation. This is a short term idea, doesn’t have to make it Howver that would be a confluence area I would target. Wheather you’d decide to open a short upon backtesting confirmation of a rejection, or not that is a pretty logical idea. Playing this rip up to 154 could be a nice safe target to play. Just my idea I currently have no postion but I am speculating if we clear 148 and hold or rip through I would open a long with 154 area as a take profit zone. Recent wick a buy back at 140 could insinuate a strong buyer there, which could be a great area to place a stoploss below. 20-30 cents velow


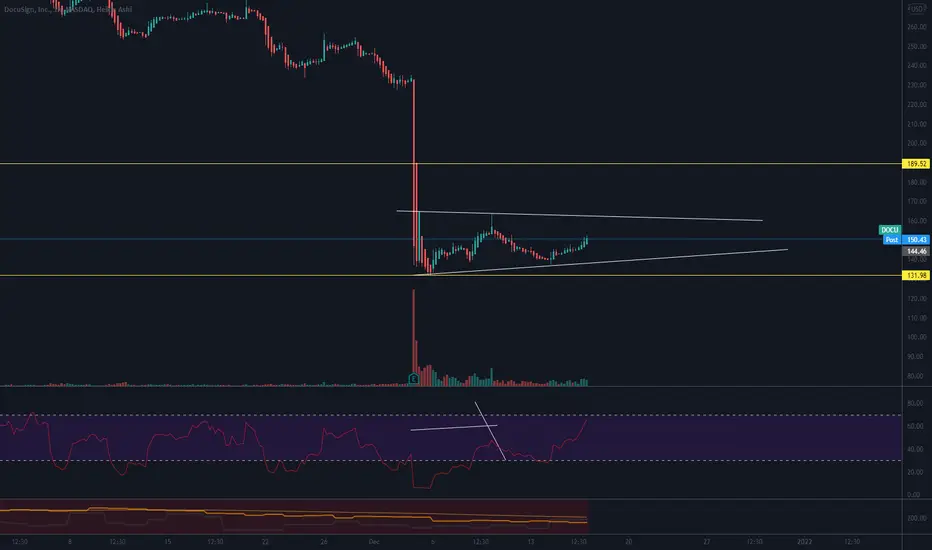
DOCU bearish?DOCU with straight 40% down in one day after ER, consolidating. RSI was oversold on that 40% down and RSI did dead cat bounce in this consolidation phase.
multiple tries to break the consolidation but no luck. I assume, if it breaks the ascending triangle, another hit to 135 is possible or even lower.

$DOCU getting real close to testing the gap.. DOCU trying to inch up towards the gap.. Definitely keep on watch

DOCU Potential rising wedge. Resiatnce 161 and if we were to have a bullish breakout f that resiatnce on 1 hour at 165-166 I’m in an active cal postion
Docusign - Reversal to 160 nearWe can see a strategic reversal for Docusign. Please note the rebound levels carefully.

$DOCU - Coiling Under the GapThis ticker has the potential to make an extremely explosive move over the coming weeks. Price is slowly and steadily increasing while also tightening, meaning we're due for a move.
I'm biased to play this name towards the downside, but the volume gap above CANNOT be ignored. A break of 164 can aggressively send us upwards for the gap fill, resulting in some INSANE profits.
Will keep this one on the watchlist, and will let price dictate how I play it.

DOCUAfter a big drop, slowly coming up. Formed an ascending triangle with a breakout, which reversed but I still think a potential move to the up side is pending with TA supporting it.

DOCUSIGN - Could Be Due For A Bounce, 10-15% Possible Soon?DOCU- May be a bit oversold considering it's still a viable company. And fundamentally they have out-competed everyone in this seemingly simple industry. They have good contracts with big companies and everyone uses DOCU. Maybe I am wrong but if nothing else we have a scalp opportunity with a gap above.This could take a week or so to play out but I think it will be sooner than later. NFA, DYOR

Docu sign dead cat bounce overIn my last most I told you that docu would dead cat bounce and form a bear flag before heading lower and as you can see it has formed its flag or pennant. No it is not an ascending triangle. Why? because an ascending triangle entry forms from below and this entry was formed from the massive gap down. So consider the length of that gap down as the the length of the pole. Why is the length of the pole important ? Its important because the fall out of the bear flag usually matches the length of the pole.

DOCU Quick PutI'm looking for DOCU to the downside come Monday, RSI super overbought and MACD showing signs of big reversal potential


$DOCU bullish reversal$DOCU plunges after earnings. DocuSign (DOCU) late Thursday reported adjusted EPS of $0.58 in fiscal Q3, up from $0.22 a year earlier, and beating analyst estimates of $0.46 in a Capital IQ survey.
the fiscal year, it now projects revenue of $2.083 billion to $2.089 billion, compared with the Street estimate of $2.09 billion for revenue. In September, the company expected revenue of $2.078 billion to $2.088 bill.
Despite the drop. i think the company is doing ok and for large investors this is just profit taking for them to sell.
i this is a good dip buy opportunity if you look at their 3yr chart. i think the company is doing well despite the covid and inflation.
buy call above 160 Take profits at 165-167+
buy puts below 151.90 take profits at 148.89-146.89
always take profits as you see one. always follow your plan and risk management.
Hello everyone,
welcome to this free technical analysis . ( mostly momentum play )
I am going to explain where I think this stock is going to go over the next day or week play and where I would look for trading opportunities.
If you have any questions or suggestions which stock I should analyze, please leave a comment below.
If you enjoyed this analysis, I would definitely appreciate it, if you smash that LIKE button and maybe consider following my channel.
Thank you for stopping by and stay tune for more.
My technical analysis is not to be regarded as investment advice. but for general informational proposes only.

Watching for breakout confirmation 🍿docu is finally finding some support after the recent drop. Recently created a higher low which shows bulls are regaining control.
over 165 local resistance we can target 180.69-195.55
like and follow for more 💘

A bear trap for $DOCU?Zoom out on daily and weekly chart for $DOCU,
And we can see the congestion area, broken out to downside, which was quickly reversed by upside course! - Bear Trap!
Upside course hit above the earlier long trading range, and is dangling around the same range!
Well, it didn't reverse quickly enough on daily or hourly chart, but we're looking at weekly chart, given the long term period, the upside reversal was quick enough!
I think it makes sense to rather wait for certain signals.
Price hits:
1. 255 - soft confirmation to the downside reversal
2. 210 - strong confirmation to the downside reversal
3. 320 - strong confirmation to the long term bullish trend, perhaps a breakout after 330-340!
Looking at analyst ratings, company's performance, and with digitisation on fire everywhere, I'd be interested to be bullish!
But, I'd rather wait for confirmations using 3 ranges stated above!!!

$DOCU still not getting into the gap...This name to be added to the Nasdaq 100 around Dec 17... worth keeping an eye on if it can begin to push into the gap with volume...

DOCU halfway there The difference between a correction, crash and a bubble pop? A correction is about 10-30% drop, A crash is 30-50%. What's happening to Docu,Zm,Pton,Chewy, SE,Upst,Roku and Wayfair is a bubble pop.
I wouldn't reccomend buying this, any bounce back is a temporary technical bounce.. If you look at the daily structure of the last 7 candlesticks you'll see a bear flag forming.when a stock nose dives so harshly, and becomes oversold on the weekly it'll bounce and give the perception that's everyone (Arkk) is buying the dip. Just look at the action on Pton and ZM after they tanked , there was a buy up for about a week and then a further downslide.
I expect Docu sign to be in the 60-70$ range by next summer if not sooner..
Check out the links below for examples

Idea about DocuSignDocuSign, Inc. is an American company that organizes and manages electronic agreements. DocuSign offers electronic signature services on a variety of devices. Founded in 2003. Headquarters in San Francisco, California. Revenue $ 0.545 billion (III quarter of 2021). Capitalization $ 30.4 billion
A trade on the breakdown of the resistance level of $ 155.
The instrument of the evening added more than 10% and did not roll back near the close. The direction of movement of the tool is up. It is reasonable to expect further growth.
1) Close of the daily candle near the level.
2) Close of the daily candle just below the HIGH.
3) Compression on the day TF.
4) Accumulation near the level.
5) Above, a large power reserve.
Long above $ 156.1 (entry with a limit order)
Goal 1: $ 165
Goal 2: $ 180
Stop below $ 153
If, after breaking through the resistance and entering the position, the instrument starts rolling back to the entry point, you need to close the position without hesitation.
NOT IRR
