DOW Dupont Chemical: Value play (6% yield)Graph says all. PE = NMF, they're losing money and stock's been in down channel for quite a while; but the dividend yield at $44 is 6.4%; analyst expectations estimates agree DOW is going to earn more next year in FY 2020 with resizing and trimming, efficiency improvements &tc. Revenue is growing; From $3.4 RPS FY 2019 is expected to go to $4.4 RPS next year and may become profitable again thereafter. Mean target price = $54 based on these estimates. Still paying the >6% dividend; they pay you to wait, and you can sell weekly or monthly calls every month forever. I did a buy-write on just 200 shares/2 Oct calls.
Will add more if we get a full correction; support is around $40, so you can sleep at night holding these over long-term. It's a "Dogs of the Dow" theory value play!
This is not investment advice, just a pretty darn good trade idea IMO; trade at your own risk and consult a certified financial advisor before you plunge in here; GLTA!
DOWD trade ideas


$DOW LONG TARGETING 53 BULLISH PATTERN WITH VOLUMEVery good volume on last session . forming very nice bullish pattern targeting main resistance at 53

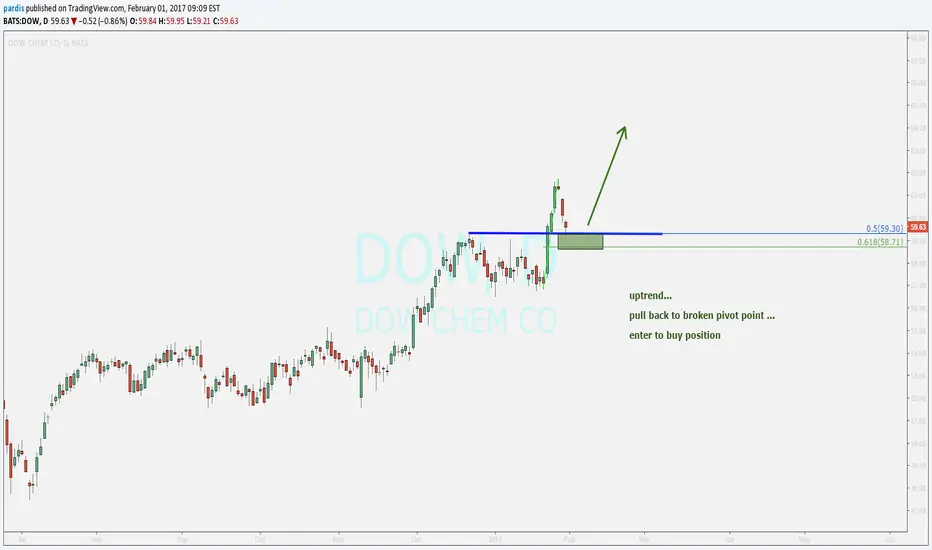
19% gains in DOW INC but long or short. Wednesday trade idea.Currently sitting at a pivot point just below a strong downtrend, a 19% trade is in play up or down.
Wednesdays rate decision is surely going to either make or break this market, so keep DOW on your watch-list for a long or short.
AVERAGE ANALYSTS PRICE TARGET $54
AVERAGE ANALYSTS RECOMMENDATION OVERWEIGHT
YIELD 5.7%
SHORT INTEREST 1.5%
COMPANY PROFILE
Dow, Inc. materials science company, combining science and technology to develop innovative solutions. It operates through three business segments: Performance Materials & Coatings, Industrial Intermediates & Infrastructure, and Packaging & Specialty Plastics. The Performance Materials & Coatings segment includes industry-franchises that deliver a wide array of solutions into consumer and infrastructure end-markets. The segment consists of two global businesses: Coatings & Performance Monomers and Consumer Solutions. These businesses primarily utilize Dow's acrylics, cellulosics- and silicone-based technology platforms to serve the needs of the architectural and industrial coatings, home care and personal care end-markets. The Industrial Intermediates & Infrastructure segment consists of two customer-centric global businesses Industrial Solutions and Polyurethanes & CAV that develop important intermediate chemicals that are essential to manufacturing processes, as well as downstream, customized materials and formulations that use advanced development technologies. The Packaging & Specialty Plastics segment consists of two global businesses: Hydrocarbons & Energy and Packaging and Specialty Plastics. The company was founded on August 30, 2018 and is headquartered in Midland, MI.


Investors getting weary with DOW stock performance. The complicated Dow spin off was supposed to create and unlock value for investors, despite a early rally action has turned bearish with no sign of a reversal, yesterday's downgrade by BMO capital brought more hurt and a 5% drop. It very much looks like the lows of $48-$46 will be tested once more until the China trade war finds some clarity.
AVERAGE ANALYSTS PRICE TARGET $59.52
AVERAGE ANALYSTS RECOMMENDATION OVERWEIGHT
COMPANY PROFILE
Dow, Inc. is a holding company, which engages in the development and provision of material science solutions. The company was founded on August 30, 2018 and is headquartered in Midland, MI.

The DOW Chemical Co. (DOW) On April 1, 2019, DowDuPont (DWDP) completed the spinoff of Dow Inc., its core chemical operations. It also replaced DowDuPont in the Dow Jones Industrial Average. The company is trading at a reasonable valuation, and we belive that there is an interesting 3 to 5 year appreciation potential.
Total debt: 19 Bilions
Total annual profits (2018): 3.1 Bilions
Dividend yeld: 5.47%

Bearish Movement Ahead For Dow Chemical (DOW)Dow Chemical has been in a bullish trend since 2009. It has been in a narrower bullish trend since January 2016. On a few occasions through this trend, three of the technical indicators discussed below are at similar levels that they are at now. These instances have resulted in short-term losses for the stock. I have also conducted further analysis based on other historical information and readings that confirm a pending drop for Dow Chemical which are laid out below.
When we look at technical indicators, the relative strength index (RSI) is at 50.1024. I personally use anything above 75 as overbought and anything under 25 as oversold. Currently the RSI is neutral having been moving down with the stock. The positive vortex indicator (VI) is at 0.9986 and the negative is at 0.9208. The positive and negative levels have been moving in a manner consistent with downward movement for the stock. The stochastic oscillator K value is 69.1107 and D value is 82.6903. This is a cyclical oscillator that is highly accurate and can be used to identify overbought/oversold levels as well as pending reversals and short-term activity. I personally use anything above 80 as overbought and below 20 as oversold. When the K value is higher than the D value, the stock is trending up. When the D value is higher that the K value the stock is trending down. The stochastic is beginning its downward movement from overbought levels.
SPECIFIC ANALYSIS
I have created an algorithm (called the SAG gauge) which signals when stocks are truly overbought and oversold. The algorithm indicates when a particular stock meets multiple criteria which culminates in an oversold or overbought alert. That signal occurred June 21 when DOW was truly overbought.
Upon back-testing this indicator, it has signaled overbought status 99 times dating back to 1972. Eighty percent of the time the stock drops at least 2.5% over the following 35 trading days after the indicator date. Seventy percent of the time, the stock drops 3.5% and fifty percent of the time drops 5.75%.
Since 2011, this stock always drops a minimum of 3.93% when the RSI, positive and negative VI are simultaneously at their current level and moving in their current direction. This additional study requires the stochastic at the bottom of the chart above to be overbought as it is today too. Eight similar instances were found going back to 2011. The minimum days of movement and percentage dropped are outlined in the chart above with a yellow rectangle (9 days, 3.93%). The median movement and percentage are represented by the light blue rectangle (23.5 days, 8.95%).
One of the occasions above, the SAG gauge fired the overbought signal two days prior to the RSI, VI, and stochastic lining up. This identical scenario is possibly playing out again. I do not fully trust one data point, but I will not ignore it either. On this occasion, the stock dropped 17.76% over the following 13 trading days.
The final level studied which is most strongly dictating my conservatively placed projection is a Fibonacci retracement. According to Investopedia, "Fibonacci retracement is created by taking two extreme points on a stock chart and dividing the vertical distance by the key Fibonacci ratios of 23.6%, 38.2%, 50%, 61.8% and 100%." The 61.8% retracement level from the bottom to the top of the most recent movement falls within all of the potential movement windows. If the stock were to give back 100% of its most recent movement (May 18 low of 59.29 to June 19 high of 65.47) the stock would drop to 59.29. 61.8% of this movement would have the stock drop to 61.65 which is where my projection lies.
Considering the RSI, VI, stochastic levels, SAG gauge and historical similarities favors a move to the downside. Based on historical movement compared to current levels and the SAG gauge, the stock could drop at least 2.87% over the next 35 trading days if not sooner.


We're In An Everything Bubble. The Sell Off BeginsWe are looking at the top of the decline here--we will see highs--but this may be the start of a correction of a very long uptrend.


uptrendpassing of a price since 02/2005...
after that its a pullback...
buy after a sure trigger as a big bullish candle on daily time frame


Possible Dow Chemical multi-decade breakoutDOW broke out 17-month triangle last week and today confirmed break with test of the trendline.
Decisive weekly close above 2005&2015 all time highs would clear way to strong multidecade breakout.
First support at 55.00. Anticipatory long in today at 55.35. Will add if all time high cleared. SL weekly close below triangle.
Have a look also at the weekly chart.

