EBay Holds an Old HigheBay rallied earlier this year, and now some investors may see opportunity in its latest pullback.
The first pattern on today’s chart is the July 2023 high of $49.48. EBAY tested this level on April 17 and held it again last week. Has old resistance become new support?
Second is the rally between February 27 and late March. Notice how the online-auction stock held a 50 percent retracement of that move last week.
Third, the 50-day simple moving average (SMA) had a “golden cross” above the 200-day SMA in early March. That may suggest its longer-term trend is getting more bullish.
Finally, the stock just completed a bullish inside week. That may suggest a pullback phase is nearing its end.
TradeStation has, for decades, advanced the trading industry, providing access to stocks, options and futures. See our Overview for more.
Past performance, whether actual or indicated by historical tests of strategies, is no guarantee of future performance or success. There is a possibility that you may sustain a loss equal to or greater than your entire investment regardless of which asset class you trade (equities, options or futures); therefore, you should not invest or risk money that you cannot afford to lose. Online trading is not suitable for all investors. View the document titled Characteristics and Risks of Standardized Options at www.TradeStation.com . Before trading any asset class, customers must read the relevant risk disclosure statements on www.TradeStation.com . System access and trade placement and execution may be delayed or fail due to market volatility and volume, quote delays, system and software errors, Internet traffic, outages and other factors.
Securities and futures trading is offered to self-directed customers by TradeStation Securities, Inc., a broker-dealer registered with the Securities and Exchange Commission and a futures commission merchant licensed with the Commodity Futures Trading Commission). TradeStation Securities is a member of the Financial Industry Regulatory Authority, the National Futures Association, and a number of exchanges.
TradeStation Securities, Inc. and TradeStation Technologies, Inc. are each wholly owned subsidiaries of TradeStation Group, Inc., both operating, and providing products and services, under the TradeStation brand and trademark. When applying for, or purchasing, accounts, subscriptions, products and services, it is important that you know which company you will be dealing with. Visit www.TradeStation.com for further important information explaining what this means.
EBAY trade ideas

EBAY 10/1/2023Ebay.
Bid on this.
Ebay was in an uptrend that reached its peak in September '21 when the price entered a distribution stage in the form of a Double Top pattern.
In December '21, the price broke down from the Double Top pattern and entered a downtrend.
he downtrend persisted, making lower lows and lower highs from December '21 through October '22.
The price found support and bounced from the October '22 lows of $36, attempting to break through the previous lower high of August '22. However, the price failed to break the previous lower high and was rejected.
It continued moving sideways and has formed what appears to be a Rising Wedge Pattern. A wedge in a downtrend indicates a continuation of the previous trend.
There is a breakdown of the wedge’s support level, and the price continues to build up at the breakout point. This will be my entry.
Entering trade short.
Entry: 44.11
Stop Loss: 46.28 (-4.92%)
Target #1: 36.16 , +18.02%, 3.66 RR ratio
Target #2: 28.01, +36.5%, 7.42 RR ratio

eBay: Is the Big Turnaround Coming?
Looking at the eBay chart, we believe that Wave (1) and (2) were completed at $4.17, as well as Waves (3), (4) and (5). However, we've had some uncertainties regarding the positioning of Wave (3). Nonetheless, where we've positioned Waves (3) and (4) makes the most sense to us. Regardless, it could still be considered that Wave (5) and the overarching Wave I have truly peaked at $81.19. Zooming in on the 4-hour chart, it seems more like we are dealing with an extended Wave II rather than a different downward correction. Thus, we don't believe that $81.19 marks the position of Wave (3), as we're dealing with a 5-wave impulse downwards. This could indicate we're looking at a zigzag movement, broadly marked as (A), (B), then (C).
We believe we have already seen the subordinate Waves A and B, and now we should be developing a 5-wave impulse upwards to complete Wave C and the overarching Wave (B) between 61.8% and 78.6%. Afterward, we should see another significant drop. For eBay, we're operating on a higher timeframe, so this process will take longer. However, once we reach there, it will present excellent entry opportunities for us to build a long-term position.

EBAY Stock Chart Fibonacci Analysis 031224Trading Idea
1) Find a FIBO slingshot
2) Check FIBO 61.80% level
3) Entry Point > 47/61.80%
1) Find a FIBO slingshot
2) Check FIBO 423.60% level
3) Hit the top = 57/423.60%
Chart time frame : D
A) 15 min(1W-3M)
B) 1 hr(3M-6M)
C) 4 hr(6M-1year)
D) 1 day(1-3years)
Stock progress : A
A) Keep rising over 61.80% resistance
B) 61.80% resistance
C) Hit the bottom
D) Hit the top
Stocks rise as they rise from support and fall from resistance. Our goal is to find a low support point and enter. It can be referred to as buying at the pullback point. The pullback point can be found with a Fibonacci extension of 61.80%. This is a step to find entry level. 1) Find a triangle (Fibonacci Speed Fan Line) that connects the high (resistance) and low (support) points of the stock in progress, where it is continuously expressed as a Slingshot, 2) and create a Fibonacci extension level for the first rising wave from the start point of slingshot pattern.
When the current price goes over 61.80% level , that can be a good entry point, especially if the SMA 100 and 200 curves are gathered together at 61.80%, it is a very good entry point.
As a great help, tradingview provide these Fibonacci speed fan lines and extension levels with ease. So if you use the Fibonacci fan line, the extension level, and the SMA 100/200 curve well, you can find an entry point for the stock market. At least you have to enter at this low point to avoid trading failure, and if you are skilled at entering this low point, with fibonacci6180 technique, your reading skill to chart will be greatly improved.
If you want to do day trading, please set the time frame to 5 minutes or 15 minutes, and you will see many of the low point of rising stocks.
If want to prefer long term range trading, you can set the time frame to 1 hr or 1 day.

EBAY Options Ahead of EarningsIf you haven`t bought EBAY in the Buy area:
nor sold before of the previous earnings:
Then analyzing the options chain and the chart patterns of EBAY prior to the earnings report this week,
I would consider purchasing the 47.5usd strike price Calls with
an expiration date of 2025-1-17,
for a premium of approximately $4.00.
If these options prove to be profitable prior to the earnings release, I would sell at least half of them.

Looking for a long leap on EBAY at close of this month!Thank you as always for watching my video. I hope as always you learned something educational!

EBay Beats Earnings Estimates on Strong U.S. Holiday SpendingE-commerce behemoth eBay ( NASDAQ:EBAY ) has surpassed market expectations for quarterly revenue and profit, buoyed by robust U.S. holiday spending and the sustained strength of key focus categories.
The company's stellar performance was underscored by a revenue of $2.56 billion, surpassing analysts' estimates and reflecting a strategic emphasis on value-driven consumer segments such as refurbished goods and auto parts. Shares of eBay ( NASDAQ:EBAY ) surged approximately 7% in extended trading, signaling investor confidence in the platform's ability to capitalize on shifting consumer preferences and market dynamics.
According to eBay ( NASDAQ:EBAY ) CFO Stephen Priest, the uptick in business activity towards the end of November, particularly in the U.S., mirrored consumers' penchant for value-conscious purchases amid constrained holiday budgets. This trend underscores eBay's pivotal role as a marketplace that caters to a diverse array of buyers and sellers, facilitating transactions across borders and driving sustained growth.
The company's proactive measures to enhance shareholder value were further evident with the authorization of an additional $2 billion share repurchase program, reflecting management's confidence in eBay's long-term prospects and commitment to capital allocation strategies that maximize returns for investors.
Despite the upbeat results, eBay CEO Jamie Iannone acknowledged challenges in certain international markets, notably the UK and Germany, which experienced sluggish e-commerce growth. In response to evolving market conditions, eBay implemented cost-saving measures, including a workforce reduction of approximately 1,000 roles, signaling a proactive approach to streamline operations and mitigate risks associated with an uncertain economic landscape.
eBay ( NASDAQ:EBAY ) remains cautiously optimistic, forecasting revenue for the first quarter in the range of $2.50 billion to $2.54 billion, exceeding analysts' estimates. The company's projected adjusted earnings per share between $1.19 and $1.23 further underscore its confidence in delivering sustained profitability amidst market volatility.
Key industry metrics, such as gross merchandise volume, rose by 2% to $18.59 billion in the fourth quarter, highlighting eBay's resilience and ability to adapt to changing market dynamics while maintaining its position as a leading player in the global e-commerce landscape.
As eBay ( NASDAQ:EBAY ) navigates the complexities of a rapidly evolving market, its ability to leverage consumer trends, optimize operational efficiencies, and drive innovation will be pivotal in sustaining its growth trajectory and delivering value to shareholders in the long run.
In an era defined by economic uncertainty and shifting consumer behavior, eBay's impressive earnings performance serves as a beacon of stability and resilience, reaffirming its status as a cornerstone of the digital marketplace and a trusted destination for buyers and sellers worldwide.

EBAY is expected to report earnings to $1.03 per share on Feb 27The last earnings report on September 30 showed earnings per share of $1.03, beating the estimate of $1. P/B Ratio (3.871) is normal, around the industry mean (17.683). P/E Ratio (8.837) is within average values for comparable stocks, (77.417). Projected Growth (PEG Ratio) (3.347) is also within normal values, averaging (3.530). Dividend Yield (0.023) settles around the average of (0.032) among similar stocks. P/S Ratio (2.356) is also within normal values, averaging (4.177). With 7.12M shares outstanding, the current market capitalization sits at 22.84B.

EBAY 22724 UH-TEN-TION!Ebay is on the verge of a monstrous breakout if history can prove correctly. Why? The monthly flipping green on the macd. Previous times its rallied 100-600 percent. Its a very easy 2x but likely to rip to new highs. Ebay really is THE marketplace atm.

EBAY 22123If you shop often. You know that ebay is the spot rn for everything. I find the best deals, best product, and best prices all day. I can see this very easily moving back up to the top and test ath. prob a hundred dollar stock. nfa. im just a degenerate. dont follow me for entertainment only.

EBAY 3d Q1-Q2 2024Looking at EBAY continuing to show weakness throughout the last year after it topped in Q3 2021.
Barring some crazy event for the company in the next few weeks, I am expecting it to go sub-$40, into the red zone that has acted as reliable support since it "bottomed" on October 2022.
Until it can break above the upper red $43-45 zone, this remains bearish to me.

EBAY's Down Trend From 80.59 To 41.89--
Ebay NASDAQ:EBAY is down trending and this makes it a good shorting position
type of stock
--
To find this stock we did the following 3 things:
--
#1- Used The CCI indicator
#2- Used the trend line
#3- Used the reversal market psychology
--
Disclaimer: Always remember to do your own research before you trade. This is not financial advice.
--
Do not buy or sell anything i recommend to you.
--
Rocket boost this content to learn more.

EBAY @ $41.48A penny stock is a stock priced below $1.
As a chartist you dont need indicators.
You want to stay within volume.
When you become a chartist it doesnt matter what industry you are in.
In penny stocks make sure the price is affordable.
In case look at the top left to the bottom right.
Be a chartist and look at price direction.
As Timothy Sykes says dont buy more than 1000 shares
Rocket boost this content to learn more.
At most dont go beyond 2000 shares.
--
**Disclaimer:**
The information provided above is for educational and informational purposes only.
It does not constitute financial advice, and trading always involves
a risk of substantial losses, regardless of the margin levels
used. Before engaging in any trading activities, it is crucial to
conduct thorough research, consider your financial situation,
and, if necessary, consult with a qualified financial advisor. Past
performance is not indicative of future results, and market
conditions can change rapidly. Trading decisions should be made
based on careful analysis and consideration of individual
circumstances. The user is solely responsible for any decisions made
and should be aware of the inherent risks associated with trading in
financial markets.

Ebay: Brief touch 👉The price of eBay stock recently ventured into the green target zone (coordinates: $37.48 - $29.58) with a candlestick. However, the dip into the zone did not last long, as the stock immediately rebounded by 11%. Our primary scenario is for the price to drop back into the zone and anchor the low of the green wave (B) a little lower. However, it should be noted that the minimum requirement for a correction has already been met with the 90% retracement at $37.48, and a direct start would thus theoretically be possible. An imminent attack on the resistance at $45.54 would lead us to believe that we are already in the green wave alt.(2), which we consider to have a 40% probability.

EBAY Options Ahead of EarningsIf you haven`t sold EBAY before the previous earnings:
or here:
Then analyzing the options chain and the chart patterns of EBAY prior to the earnings report this week,
I would consider purchasing the 40usd strike price Puts with
an expiration date of 2023-12-15,
for a premium of approximately $1.65.
If these options prove to be profitable prior to the earnings release, I would sell at least half of them.
Looking forward to read your opinion about it.

Ebay Inc Down 5.03% Despite Market's Bullish TrendThe company reported earnings on an adjusted basis, so it may not be directly comparable to analyst estimates or prior periods.
On the revenue line, the company reported $2.5 billion, beating estimates by $140 million. In the same quarter a year ago, the company earned $1 per share on revenue of $2.4 billion.
The stock is down 5.03% to $38.01 after the report. Ebay Inc's revenue expanded at a faster pace than earnings, signaling a decline in profit margins.
Ebay Inc has performed a little below average during the past few months. The firm was recently trading at a 52-week low of $37.93 on October 27, 2023 and set a 52-week high on February 2, 2023 at $52.23.
eBay operates one of the largest e-commerce marketplaces in the world, with $87 billion in 2021 gross merchandise volume, or GMV, rendering the firm the sixth- largest global e-commerce company. eBay generates revenue from listing fees, advertising, revenue-sharing arrangements with service providers, and managed payments, with its platform connecting more than 147 million buyers and roughly 20 million sellers across almost 190 global markets. eBay generates just north of 50% of its GMV in international markets, with a large presence in the U.K., Germany, and Australia.
Price Momentum
EBAY is trading near the bottom of its 52-week range and below its 200-day simple moving average.
What does this mean?
Investors have been pushing the share price lower, and the stock still appears to have downward momentum.

EBAY: closing the gap?A price action above 44.00 supports a bullish trend direction.
The bullish trend might increase in strength above 45.00.
The first target price is set at 46.00.
The second target price is set at 49.00.
The gap in the price action might be filled.
Remains a risky trade.

EBAY LongI believe there is huge potential to bounce back and make the new top in EBAY. with tight stop it could be good option to open position on it

TurnaroundPast Friday we've seen another attempt to leave the downward trend prevailing since end July.
It failed again and the selloff was impressive on Monday . It continued yesterday and we've opened today with a gap down. The window has been closed and the way for a continued fall is open.

Ebay: Tug of War 🪢The Ebay share is currently experiencing a tug of war between bears and bulls. In our primary scenario, the bears should prevail and push the price to the green target zone between $37.48 and $29.58 as part of the green wave . Having placed the low, the price can then rise above the resistance at $52.23.

Open WindowOn 27th July already we opened a downward window. The attempt to close it was not not successful on Monday.
At the opening we have opened another window today and in little upward correction it could not be closed yet as well.
The failure to close the big July window, however suggests a continuation of the decline.
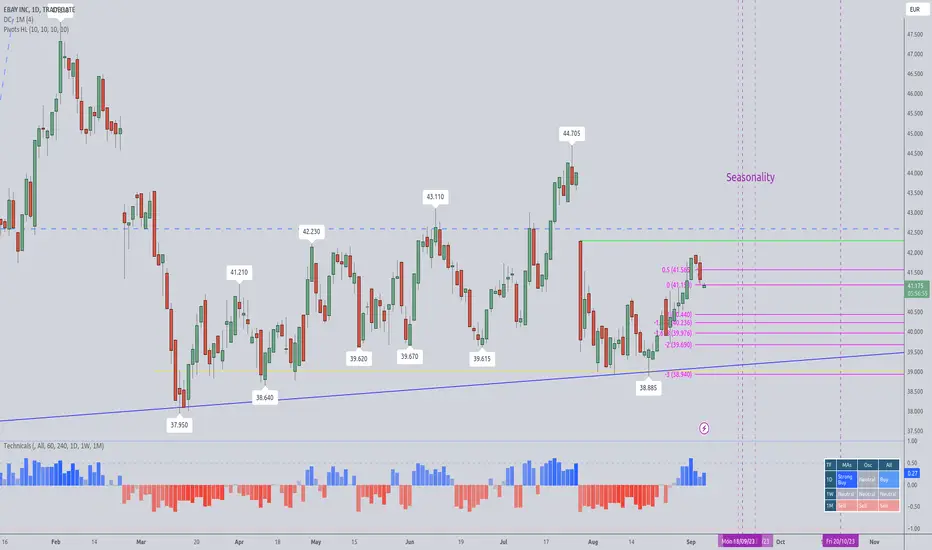
EBAY Stock Chart Fibonacci Analysis 091123 Trading Idea
1) Find a FIBO slingshot
2) Check FIBO 61.80% level
3) Entry Point > 43.6/61.80%
Chart time frame : B
A) 15 min(1W-3M)
B) 1 hr(3M-6M)
C) 4 hr(6M-1year)
D) 1 day(1-3years)
Stock progress : B
A) Keep rising over 61.80% resistance
B) 61.80% resistance
C) Hit the bottom
D) Hit the top
Stocks rise as they rise from support and fall from resistance. Our goal is to find a low support point and enter. It can be referred to as buying at the pullback point. The pullback point can be found with a Fibonacci extension of 61.80%. This is a step to find entry level. 1) Find a triangle (Fibonacci Speed Fan Line) that connects the high (resistance) and low (support) points of the stock in progress, where it is continuously expressed as a Slingshot, 2) and create a Fibonacci extension level for the first rising wave from the start point of slingshot pattern.
When the current price goes over 61.80% level , that can be a good entry point, especially if the SMA 100 and 200 curves are gathered together at 61.80%, it is a very good entry point.
As a great help, tradingview provide these Fibonacci speed fan lines and extension levels with ease. So if you use the Fibonacci fan line, the extension level, and the SMA 100/200 curve well, you can find an entry point for the stock market. At least you have to enter at this low point to avoid trading failure, and if you are skilled at entering this low point, with fibonacci6180 technique, your reading skill to chart will be greatly improved.
If you want to do day trading, please set the time frame to 5 minutes or 15 minutes, and you will see many of the low point of rising stocks.
If want to prefer long term range trading, you can set the time frame to 1 hr or 1 day.

