F 5M Long Daytrade Aggressive CounterTrend TradeAggressive CounterTrend Trade
- long impulse
- unvolumed T1
+ resistance level
+ biggest volume 2Sp-
+ weak test
+ first bullish bar below close entry
Calculated affordable stop market
T2 5M take profit
1H CounterTrend
"- long impulse
- unvolumed T1
+ resistance level"
1D CounterTrend
"- long impulse
- unvolumed T1
+ resistance level"
1M CounterTrend
"+ short impulse
- exhaustion volume
+ T2 level
+ resistance level
- unvolumed interaction bar
- reaction bar looks to close bullish in 6 days"
1Y CounterTrend
"+ long impulse
+ volumed T2 level
+ volumed 2Sp+
+ 1/2 correction
+ weak test"
F trade ideas

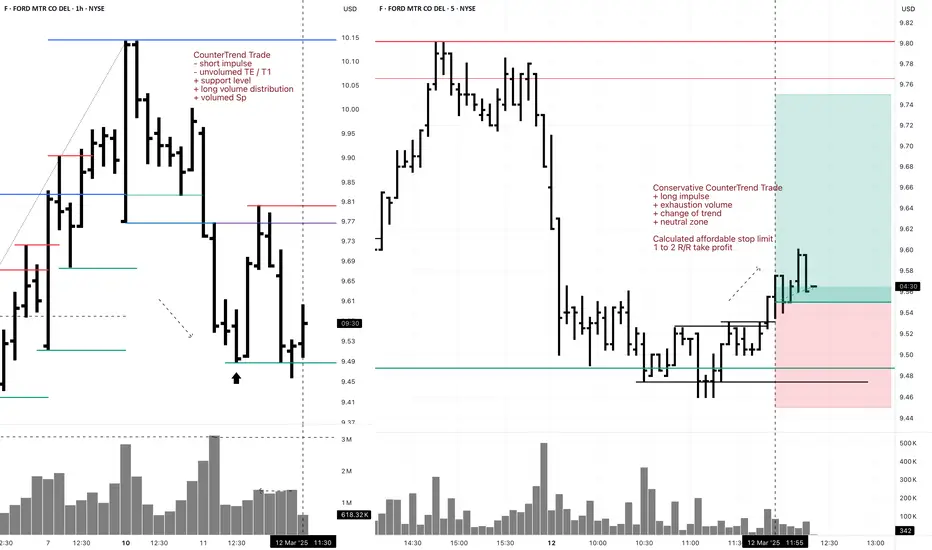
F Investment 1D Conservative CounterTrend TradeConservative CounterTrend Trade
+ long impulse
- before 1/2 correction
+ expanding T2
+ support level
+ biggest volume 2Sp-
+ weak test
+ first bullish bar close entry
Calculated affordable stop limit
1 to 2 R/R take profit
Monthly CounterTrend
"- short impulse
+ 1/2 correction
- unvolumed T2
- resistance level
+ unvolumed interaction bar"
Yearly Trend
"+ long impulse
+ volumed T2 level
+ volumed 2Sp+
+ 1/2 correction
+ weak test"

Bearish flag on Ford
Ford has been forming this bearish flag since August of last year. When this flag breaks, that would take Ford down to a trendline that goes back almost 20 years, that connects through the 2008 lows as well as the covid lows. I expect this area to likely contain the lows for Ford for the current bear market.

Ford Stock Rises Over 5% Following Earnings ReportFord's stock gained more than 5% in the latest session after the company’s earnings were released following the close of yesterday’s trading. For now, investor confidence remains strong, as the company reported earnings of $0.14 per share, significantly beating expectations of $0.02, and revenue of $37.42 billion, above the estimated $36.21 billion.
In addition, although the company mentioned it expects tariff-related costs of $2.5 billion, it also stated it plans to offset at least $1 billion of these additional costs. This has contributed to a more optimistic outlook for the stock over the coming months, allowing bullish pressure to remain strong during the current session.
Short-Term Bullish Channel
Since early April, a steady bullish channel has been forming, pushing Ford’s stock back to the $10 per share level in the short term. At the moment, buying momentum is facing a key resistance at the 200-period simple moving average. If the price manages to break through this level, it could strengthen the current upward trend seen on the chart.
Technical Indicators:
ADX: The ADX line has started to show a consistent upward slope and is approaching the neutral 20 level. If this level is crossed, it could indicate increased volatility, which—if the current trend holds—could favor continued bullish movement.
TRIX: The TRIX line has crossed the zero level, signaling that the average strength of the moving averages has turned bullish, which may indicate growing buying momentum in the short term.
Key Levels:
$9.55 – Nearby Support: Aligns with recent zones of indecision. A move back to this level could jeopardize the current bullish formation and trigger a relevant bearish bias.
$10.30 – Current Resistance: Aligns with the 200-period simple moving average. Sustained movement above this level could extend the bullish channel currently shown on the chart.
Written by Julian Pineda, CFA – Market Analyst

Bearish Setup???FORD has a hit an historical resistance which was combined with it's 200 EMA(in orange). Key Levels to keep an eye on are the 10.39 price level; bullish activity from there would invalidate the current hypothetical bearish set up; an bearish action to the 10 EMA(blue) and 50 EMA (purple) would validate bearish setup.

Ford +50%Ford, which in recent years had diverged 150% from its main industrial benchmark, is one of the beneficiaries of Trump’s tariffs. Despite its heavy reliance on imported parts, Ford remains a symbol of domestic car manufacturing.
While the market is losing trillions, Ford stays almost unmoved compared to the broader market.
Cash outflows from everywhere can’t just be parked in bonds — investors need stocks like Coca-Cola.
Ford is going to be one of the first to rise, with at least a 50% increase.
Ford is NOT Tesla)

Ford (NYSE:F) Drop 5%+ as Tariffs Threaten Auto Industry marginsFord Motor Company (NYSE: F) is facing a challenging market environment as its stock price fell 5.27% to $9.61 as of 3:24 PM EDT. This drop comes amid declining sales and the looming threat of new tariffs from the Trump administration. In the last 52 weeks, Ford's stock has traded within a range of $9.06 to $14.85.
On Tuesday 1st April, Ford reported a 1.3% decline in total vehicle sales year-over-year, delivering 501,291 vehicles in Q1 2025. Despite this decline, retail sales rose by 5%, with a strong 19% surge in March, signaling that buyers may be accelerating purchases ahead of the impending tariffs.
General Motors (GM) posted strong results with a 17% increase in sales, delivering 693,353 vehicles in Q1 2025. The company achieved double-digit growth across all its brands, marking its best first-quarter performance since 2018. While GM shares remained stable, Ford shares saw further declines.
Tariffs Add Uncertainty for Automakers
The auto industry is preparing for the impact of a 25% tariff on foreign cars and parts. The Trump administration confirmed on Wednesday that his 25% global car and truck tariffs would take effect as scheduled on Thursday and that duties on automotive parts imports will be launched on May 3rd.
Although Ford manufactures most of its vehicles in the U.S, many essential parts are imported. Higher production costs could push car prices higher, affecting demand.
Ford executives have stated they are assessing the impact of these tariffs on their business operations. Chairman William Clay Ford Jr. assured shareholders that the company is prepared to handle geopolitical uncertainties. Despite this, investor sentiment remains cautious, contributing to the recent stock price decline.
Technical Analysis
Ford’s stock has been trading within a narrow range of $9 to $10 in the last three months. A strong resistance level at $11, tested several times from August to November 2024, remains unbroken. Since failing to break the resistance level, the stock has since then declined.
Currently, the price is testing a double support level at $9 comprising of a horizontal key support and a descending trendline. If this support holds, Ford’s stock may attempt another bull phase toward the $11 resistance level. On the other hand, a break below $9 could push the price lower, with the next potential support level at $8.45.
The 50-day, 100-day and 200-day moving averages are positioned above the current Market price, at $9.74, $10.08 and $10.70 respectively. This indicates strong bearish pressure, limiting bullish momentum in the near term.
Thoughts Moving Forward
With tariffs and the auto industry facing supply chain disruptions, Ford’s stock is likely to remain under pressure. The bearish sentiment could persist in the short term, especially if the price breaks below the key $9 support level.
If support holds, Ford could see a short-term bounce toward $11. However, sustained bullish momentum would require strong demand and improved market sentiment. This would be witnessed if its earnings report, set to be released between April 22nd and April 28th, 2025, is favorable. Until then, geopolitical and economic uncertainties weigh on the stock.

Ford’s 30+ Year ConsolidationWill this wedge break fords consolidation since 1989?? Long term this is a trade/investment to hold onto and collect dividends. I Measured the potential up move by the last bull run Ford had. I’m a firm believer auto’s are gonna jump fast in the coming future. Tell me your thoughts or am I crazy!!

Ford (F) Share Price Drops Following Trump's TariffsFord (F) Share Price Drops Following Trump's Tariffs
President Trump has fulfilled his promise to impose tariffs on foreign car manufacturers, introducing a 25% tariff on all cars and light trucks not made in the United States, as well as on "certain auto parts."
As reported by Yahoo Finance: "This will continue to drive growth like you've never seen before," Trump stated from the White House on Wednesday while signing the tariff order. The 25% tariffs are set to take effect on 2 April, adding to existing duties. The White House announced that $100 billion in annual tariffs would be collected.
Why Have Ford (F) Shares Fallen?
Trump’s decision has led to a sharp drop in car manufacturers’ share prices, particularly in Europe. However, shares of American automakers have also declined. Ford (F) shares, according to the price chart, fell by approximately 4% yesterday.
This decline is due to the fact that Ford (as well as GM and Stellantis) has manufacturing facilities in Canada, Mexico, and China, which now means higher costs due to the impact of tariffs on supply chains.
Technical Analysis of Ford (F) Share Price Chart
As we noted when analysing Ford (F) shares on 6 March, Trump's tariff policy previously helped the price recover from a four-year low.
However, it now seems that “the pendulum has swung the other way.” Examining the price chart, we can identify three levels that actively interact with the price (some key reversals are marked with an arrow), with the middle level appearing to act as a median for the "pendulum" of market sentiment.
From this perspective, we can reasonably assume that:
→ The $10.25 level continues to act as resistance;
→ The $9.66 level, acting as a median for Ford (F) price fluctuations, may "attract" the price.
This article represents the opinion of the Companies operating under the FXOpen brand only. It is not to be construed as an offer, solicitation, or recommendation with respect to products and services provided by the Companies operating under the FXOpen brand, nor is it to be considered financial advice.

ford in the next few weeksFord stock is undervalued and now at strong support
we will see bullish movements in the next few days

$F Electric Vehicle (EV) Strategy:
Broadened Electrification: Ford is expanding its EV lineup to include more affordable electric commercial vans, mid-sized trucks, and hybrid SUVs, aiming to enhance profitability and reduce CO₂ emissions.
New EV Platform: The company plans to introduce a cost-efficient electric vehicle platform by 2027, facilitating the launch of multiple vehicle styles for both retail and commercial customers.
Analyst Projections:
Price Targets: Analysts have set price targets ranging from $8.00 to $14.00, with an average target of $10.31, indicating a potential upside from the current price.
Forecasts: Some forecasts predict modest growth, with the stock potentially reaching $10 by mid-2025 and $12 by the end of 2027.
Market Position and Challenges:
Competitive Landscape: The automotive industry is highly competitive, with challenges such as slow growth, technology disruptions, and overcapacity affecting traditional automakers.
Strategic Shifts: Ford is adjusting its EV strategy to focus on hybrids and affordability, aiming to meet changing market conditions and consumer preferences.
Conclusion:
While Ford's strategic initiatives in electrification and affordability may position it for growth, the automotive industry's inherent challenges and competitive pressures warrant careful consideration. Potential investors should conduct thorough research and assess their individual investment goals and risk tolerance before making investment decisions.
Triple Bottom off a DOWNTREND

Ford’s Potential Big Up MoveFord showing a break out from the previous daily consolidation. Monthly minor trend in down but the major trend is going up to resistance at $15. We could see that big move up before it falls to $7. Let’s see how it plays out.

F 1H Swing Long Conservative Trend TradeConservative Trend Trade
- long impulse
- volumed T2
+ support level
+ 1/2 correction
+ biggest volume Sp
Calculated affordable stop limit
1 to 2 R/R take profit
Day Trend
"+ long impulse
+ 1/2 correction
- neutral zone
- context direction short"
Month CounterTrend
"- short impulse
+ 1/2 correction
- unvolumed T1
+ support level
+ long volume distribution
+ biggest volume manipulation"
Year Trend
"+ long impulse
+ volumed T2 level
+ volumed 2Sp+
+ 1/2 correction
+ weak test"

$F: Ford Motor Company – Driving Profits or Stalling Out?(1/9)
Good afternoon, everyone! ☀️ NYSE:F : Ford Motor Company – Driving Profits or Stalling Out?
With F at $10.18, is this auto giant revving up with EVs or sputtering in the market? Let’s shift gears and find out! 🔍
(2/9) – PRICE PERFORMANCE 📊
• Current Price: $ 10.18 as of Mar 18, 2025 💰
• Recent Move: Slight uptick in March, per data 📏
• Sector Trend: Auto sector mixed, EV demand growing 🌟
It’s a road with twists—let’s see where it leads! ⚙️
(3/9) – MARKET POSITION 📈
• Market Cap: Approx $45B (4.4B shares) 🏆
• Operations: Global auto manufacturer, focusing on EVs ⏰
• Trend: EV push with F-150 Lightning, per data 🎯
Firm in its lane, with electric acceleration! 🚗
(4/9) – KEY DEVELOPMENTS 🔑
• Q1 2025 Earnings: Expected soon, EV sales in focus 🌍
• EV Sales: F-150 Lightning gaining traction, per data 📋
• Market Reaction: Stock reflects cautious optimism 💡
Shifting to electric, eyes on the horizon! ⚡
(5/9) – RISKS IN FOCUS ⚡
• Economic Slowdown: Impact on auto sales 📉
• Competition: Tesla, GM, VW in EV race ❄️
• Supply Chain: Geopolitical tensions affecting parts 🛑
It’s a competitive race—buckle up! 🚦
(6/9) – SWOT: STRENGTHS 💪
• Brand Power: Iconic auto brand 🥇
• EV Strategy: F-150 Lightning leading the charge 📊
• Undervalued: Low P/E ratio, strong cash flow 🔧
Got the engine to roar! 🏁
(7/9) – SWOT: WEAKNESSES & OPPORTUNITIES ⚖️
• Weaknesses: Traditional auto sales vulnerable to economic shifts 📉
• Opportunities: Growing EV market, new models 📈
Can it charge ahead or run out of juice? 🤔
(8/9) – POLL TIME! 📢
F at $10.18—your take? 🗳️
• Bullish: $12+ soon, EV boom drives growth 🐂
• Neutral: Steady, risks balance out ⚖️
• Bearish: $9 looms, market stalls 🐻
Chime in below! 👇
(9/9) – FINAL TAKEAWAY 🎯
F’s $10.18 price tags potential value 📈, but volatility’s in the air 🌿. Dips are our DCA fuel 💰—buy low, ride high! Gem or bust?

F 5M Daytrade Long Aggressive Trend TradeAggressive Trend Trade
- short impulse
+ volumed TE / T1 level
+ support level
+ long volume distribution approach
+ biggest volume 2Sp+
- no test
Calculated affordable stop limit
1 to 2 R/R take profit before 5M T2
Hour Trend
"- long impulse
- volumed T2
+ support level
+ 1/2 correction
+ biggest volume manipulation"
Day Trend
"+ long impulse
+ 1/2 correction
- neutral zone
- context direction short"
Month CounterTrend
"- short impulse
+ 1/2 correction
- unvolumed T1
+ support level
+ long volume distribution
+ biggest volume manipulation"
Year Trend
"+ long impulse
+ volumed T2 level
+ volumed 2Sp+
+ 1/2 correction
+ weak test"

F 5M DayTrade Long Conservative CounterTrend TradeConservative CounterTrend Trade
+ long impulse
+ exhaustion volume
+ change of trend
+ neutral zone
Calculated affordable stop limit
1 to 2 R/R take profit
1H CounterTrend
"- short impulse
- unvolumed TE / T1
+ support level
+ long volume distribution
+ volumed Sp"
1D CounterTrend
"+ long impulse
- biggest volume on correction
- below SOS test level
- below support level
+ 1/2 correction"
1M Trend
"- short impulse
+ 1/2 correction
- unvolumed T1
+ support level
+ reverse volume approach
+ volumed manipulation"
1Y Trend
"+ long impulse
+ volumed T2 level
+ volumed 2Sp+
+ weak test"
F 5M Daytrade Conservative CounterTrend TradeConservative CounterTrend Trade
+ long impulse
+ T1 level
+ support level
+ 1/2 correction
+ volumed 2Sp-
Calculated affordable stop limit
1 to 2 R/R take profit
1H Countertrend
"- short impulse
- unvolumed TE / T1
+ support level
+ long volume distribution
+ volumed Sp
+ test"
1D Trend
"+ long impulse
- biggest volume on correction
- below SOS test level
- below support level
+ 1/2 correction"
1M CounterTrend
"- short impulse
+ 1/2 correction
- unvolumed T1
+ support level
+ reverse volume approach
+ volumed manipulation"
1Y Trend
"+ long impulse
+ volumed T2 level
+ volumed 2Sp+
+ weak test"

F 5M Long Conservative Trend DayTrade Conservative Trend Trade
+ long impulse
+ SOS level
+ 1/2 correction
+ support level
+ biggest volume 2Sp+
Calculated affordable stop limit
1D T2 take profit
1H Trend
"+ long impulse
- before 1/2 correction
+ SOS test level"
1D Trend
"- short impulse
+ exhaustion volume
+ volumed TE / T1 level
+ biggest volume 2Sp+
+ test"
1M CounterTrend
"- short impulse
+ 1/2 correction
- unvolumed T1
+ support level
+ reverse volume approach
+ volumed manipulation"
1Y Trend
"+ long impulse
+ volumed T2 level
+ volumed 2Sp+
+ weak test"

Ford is looking at an upside after prolong range since 2022NYSE:F Ford is looking at a possible resumption of upside after the stock broke above the downward sloping line of the descending triangle. Furthermore, the stock has 1.) Clear closure above the bearish gap with strong bearish candle 2.) Inverted head and shoulder is in the picture.
Ichimoku is showing early signs of a bullish reversal.
Long-term MACD is showing positive histogram and a crossover at the bottom.
Stochastic Oscillator has confirmed the Oversold crossover. 23-period ROC crosses above the zero line and has formed a bullish divergence.

Ford (F) Stock Price Rises Following Trump's DecisionFord (F) Stock Price Rises Following Trump's Decision
The White House announced on Wednesday that automakers will receive a one-month exemption from tariffs on imports from Mexico and Canada for vehicles that comply with the free trade agreement between these two countries and the United States.
White House Press Secretary Karoline Leavitt stated that this move came in response to a request from the heads of Ford Motor, General Motors, and Stellantis. The American Automotive Policy Council expressed gratitude to President Trump in a statement and noted that companies would work with the administration to boost vehicle production in the U.S. and expand exports.
This fundamental backdrop triggered a bullish momentum in the stock market for these automakers. In particular, Ford (F) shares rose by more than 6%, while the S&P 500 (US SPX 500 mini on FXOpen) gained about 1.1%.
As shown in Ford (F) stock's price chart today, the stock has rebounded from a four-year low.
Technical Analysis of Ford (F) Stock Chart
As we noted in our February 7 analysis of Ford (F) stock, special attention should be paid to the level marked by the blue line. This area, around $9.65–$9.75, acted as support in 2023 and 2024 (indicated by arrows), preventing bears from pushing the price below the psychological threshold of $10 per share.
We also highlighted the "Trump factor" and the fact that the newly inaugurated president could drastically alter the landscape for the iconic American automaker by imposing tariffs on foreign car manufacturers. The impact of this price driver on Ford (F) shares is visible on the chart: a sharp upward reversal (marked by a curved arrow) indicates that the bears’ attempt to push the stock below its previous low has failed.
It is reasonable to assume that bulls now have the initiative. If they manage to push Ford (F) stock above the resistance of the blue line, this level could turn into future support.
Ford (F) Stock Price Forecasts
Analysts remain cautious in their assessments. They may believe that one month is too short a period to significantly alter supply chains and relocate production to the U.S., where, according to Trump's statements, no tariffs would be imposed.
According to TipRanks:
→ Only 4 out of 14 analysts recommend buying Ford (F) stock.
→ The average 12-month price forecast for Ford (F) is $10.76.
Trade on TradingView with FXOpen. Consider opening an account and access over 700 markets with tight spreads from 0.0 pips and low commissions from $1.50 per lot.
This article represents the opinion of the Companies operating under the FXOpen brand only. It is not to be construed as an offer, solicitation, or recommendation with respect to products and services provided by the Companies operating under the FXOpen brand, nor is it to be considered financial advice.

Ford 1D Investment Aggressive CounterTrend TradAggressive CounterTrend Trade
- short impulse
+ exhaustion volume
+ 1/2 correction
Calculated affordable stop limit
Take profit:
1/3 to 1/2 Month Trend
1/3 to Month T2
1/3 to Year 1/2
Sell F Limit at $14.95 (Good 'til Canceled)
Sell F Limit at $11.57 (Good 'til Canceled)
Sell F Limit at $10.21 (Good 'til Canceled)
Monthly CounterTrend
"- short impulse
+ 1/2 correction
- unvolumed T1
+ support level
+ reverse volume approach
+ volumed manipulation"
Yearly Trend
"+ long impulse
+ volumed T2 level
+ volumed 2Sp+
+ weak test"

Ford seems to easy of a buyThoughts on the Ford recall vs price action
I'm personally watching as buying is heating up

Ford Motor Company: LONG TRADE EV etc for me all overrated. Tesla also...they are selling you lit. battery tech that will diminish after some time...
You are going a long journey and have to stop by a charging station and wait before you keep going...Are you joking me ! !
With EV this is what happened...For years car companies had been spending money on ARGE...Finally they had to profit, with the help of the governments, they are turning it into profits.
5 years later they will be speaking for hydrogen cars or back to petrol or something.
My thought above has got nothing to do with Ford :)
But Ford Price will increase in short term.
None of my positions are investment or trading advise. Do your own analysis.
