FALL of FORDFord will fall.
Two times price rejection. MA20 support level is weakening.
This could be a distribution phase.
FD trade ideas

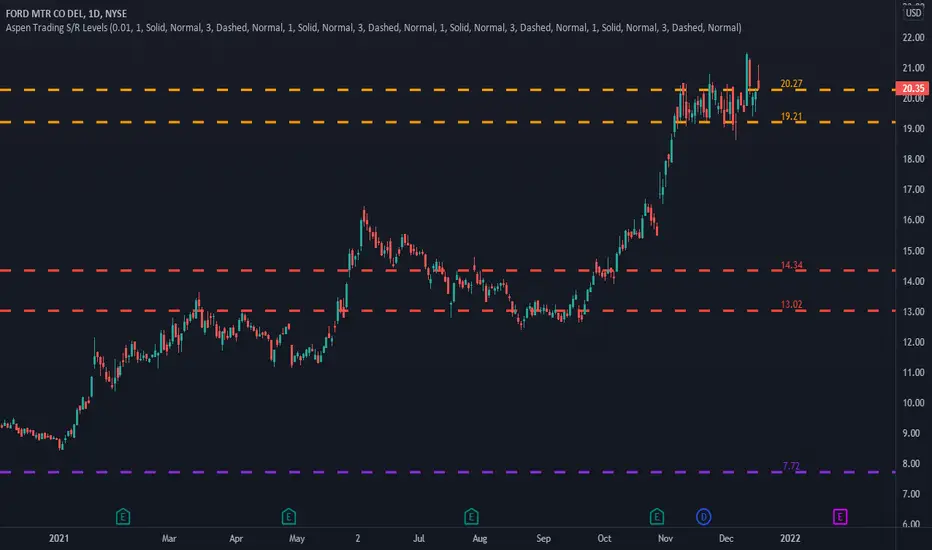
Ford Set To Race HigherFord (F) has been doing a dance with the ORANGE zone for about a month now. I'm expecting prices to hold above 20.27 and definitely 19.21 (stop-loss) on the path to higher levels.
-------------
In Trading, Objectivity Trumps Subjectivity
“Every trader is a steaming hot bowl of bias stew and must maintain self-awareness and lucidity behind the screens as the trading day oscillates between boredom and terror.”
The above quote is from a good friend of mine and veteran FX trader Brent Donnelly. It completely nails the biggest challenge for new and even experienced traders: being as objective as possible when making trading decisions.
Yes, as you become more experienced, subjectivity, market feel and experience are part of one’s decision-making matrix, but early on you do not have that luxury.
If you start each day knowing that price action in the market is random it will remind you to think objectively. There are, however, repeatable patterns that occur again and again…..it’s your job to identify them.
That’s where Support & Resistance levels come in.
Definitions: “Support” and “Resistance” Levels
Many technical indicators and tools can be subjective and challenging to learn. This is not the case with support and resistance levels.
Support and resistance are terms for two price levels on a chart that appear to limit the security’s range of movement.
The “support level” is where the price regularly stops falling and bounces up.
The “resistance level” is where the price normally stops rising and dips back down.
The more frequently a price hits either level, the more reliable that level is likely to be in predicting future price movements.
Understanding Support and Resistance Levels
Remember, the more informed and objective we can be with numbers, the more confident we can be with our trades. That’s important because, although price action is random (a fact that has been proven time and time again), there are repeatable patterns we can use to get an edge.
Two of those objective data points we can use to gain an edge are support and resistance levels. These are two of the best tools we have when it comes to swing trading. Why? Because they give us strong data points that suggest where an instrument is likely (and unlikely) to go.
But this is really key: Arbitrarily cataloging each price level that appears to be relevant as a support or resistance level isn’t going to get you far. That’s why Aspen Trading takes a unique approach to support and resistance levels.
With Aspen’s Support & Resistance Levels, we measure where trades (prices) occur in terms of frequency. This gives us a sense of where market participants are wagering prices may go.
That’s about as raw and unfiltered as you can get in terms of displaying what has taken place. There’s no room for interpretation - this is raw data that can be used to get a sense of where prices may be heading.
Learning The “Four Sets” of Support and Resistance Levels
There are four sets of support and resistance levels that are part of Aspen Trading’s S/R framework.
Each set of support and resistance levels is unique to a specified period of time. We display each of them in different colors on our charts when we analyze trades to make it easy for us to understand the data as we get comfortable reading charts.
You’ll see each of these levels on display in the charts that follow below. The four sets of support and resistance levels are classified as follows:
There are four sets of support and resistance levels that are displayed by Aspen Trading’s S/R Analysis Tool. Each one is unique to a specified period of time that we then display directly on the chart. The levels are classified as follows
- Intra-day & short-term traders love the GREEN levels
- Swing traders gravitate towards the ORANGE levels
- Medium-term traders like to see RED
- And those longer-term folks dig PURPLE
IMPORTANT:
These lines will change/adjust until the end of the specified observation period is complete.
Once the observation period is complete, that range will then be displayed on the chart as a set of dotted lines that is shaded in to serve as a reference point for traders to know the key levels from the prior lookback period. This can often be very helpful.
What’s the distinction between the 4 color levels?
Essentially think of these levels on a rising scale of importance. While GREEN levels are certainly key, they do not hold the same level of significance as the PURPLE levels.
ford is in the top of the channel and 50 % CORRECTION the stock will follow could be touch the bottom of the channel
the RSI has divergence

F/TSLA Beta Hedge , Just took a small starter in this trade .I think that there is a good possibility that , with Farley at the helm at Ford , which has also recently broken out of a 20 year base and just on Friday ( Dec 10th, 2021) broke out of a smaller base too, that we will likely begin to see F outperform TSLA . I am not saying that TSLA is going to capitulate or anything like that , but I am betting that Ford is going to become a pretty notable challenger for EV dominance and give TSLA a run for its leader status in the industry .
I think that TSLA is going to have some difficulties keeping the same levels of growth up we have seen in its former years and whereas Ford is just getting started in the EV sector really and that is currently not priced in well to it's share price. So, I personally believe that the market is very inefficient in pricing Fords true value but that it eventually will correct this inefficiency .
I could be wrong but even if I am , this trade probably has a pretty low probability of loss overall .
I like the market caps vs share price of the two .
TSLA - $ 966.55 per share with a cap of 979 billion .
F - $ 20.68 per share with a cap of 89 billion .
Ford is a sleeping giant here . Also , I really like Farley too and that's a big part of why I have high hopes for Fords future .
Nothing against Musk either :) This is about making money though and I think it's a trade that has potential for profit greater than loss .
If this goes the way I am hoping I will add when it shows us some more strength in the highlighted area on the chart .

$F - Walking up the ChannelFord has been an awesome name to trade recently.
You can consistently enter a trade when we're at the bottom of the trade, and wait to catch a rip to the top.
Even on a volatile day like today, we were safely given an opportunity to enter the channel and ride it back up to the top.
I'll be looking to exit my position around 21.2!

Fakeout city on F 🦉Hello traders! today I will be going over what a fakeout breakout is and why Its important to wait for resistance to break AND hold if you are playing the breakout.
What is a fakeout breakout? this occurs when the price has a nice move past a strong resistance or support zone! but quickly goes back where it was before :(
On my ford chart I pointed out how it has had fakeout breakouts to both sides!
I hope you learned something/enjoyed this post! like and follow for more 💘

F ATH Break Weekly Options PlayDescription
F has chopped around in this congestion pattern, a Rectangle, for 31 days following it's ATH run-up after the break on 28OCT.
The Rectangle carries the same price implications as the Symmetrical Triangle, representing an equal balance between buyers and sellers, until one side eventually wins out and pushes the price beyond the upper or lower boundary indicating a shift in supply & demand.
This particular rectangle is confined in a very tight range, slightly broadening and displays descending volume throughout (good indication of proper congestion pattern).
Although the broadening is characteristic of the current market environment, this weakens the general technical strength of the pattern.
Using Long Calls to maintain a positive vega.
Long Call
Levels on Chart
SL < 20.5
PT : No price target set for the ATH , looking for a sharp move.
The entry is a daily close over 20.5 .
*Stops based off underlying stock price, not mark to market loss
The Trade
BUY
12/31 21C
R/R & Breakevens vary on fill.
Manage Risk
Only invest what you are willing to lose

Which pattern could be more effective?At the first glance, You may find both patterns correct and justify both!
But adding ATR to the chart may reveal the hidden truth!
ATR only measures volatility and not the direction of an asset's price.
Pattern 1: Broadening Formation or Megaphone
What Is a Broadening Formation?
A broadening formation is a price chart pattern identified by technical analysts. It is characterized by increasing price volatility and diagrammed as two diverging trend lines, one rising and one falling. It usually occurs after a significant rise, or fall, in the action of security prices. It is identified on a chart by a series of higher pivot highs and lower pivot lows.
Pattern 2: Corrction/consolidation
In this situation, we expect lower changes in ATR readings!
Best,
Moshkelgosha
DISCLAIMER
I’m not a certified financial planner/advisor, a certified financial analyst, an economist, a CPA, an accountant, or a lawyer. I’m not a finance professional through formal education. The contents on this site are for informational purposes only and do not constitute financial, accounting, or legal advice. I can’t promise that the information shared on my posts is appropriate for you or anyone else. By using this site, you agree to hold me harmless from any ramifications, financial or otherwise, that occur to you as a result of acting on information found on this site.
Reference Articles:
www.investopedia.com
www.investopedia.com
www.investopedia.com

Is Ford (F) going for another run for ATH?The Friday's candle broke the channel was a very bullish one with a high volume. The TTM Squeeze is also about to get out of the squeeze which will trigger another high. (I used the "real licensed" TTM Squeeze in another platform) Ford has a chance to run $27.
PS: I am not a financial advisor. This is only for education and entertainment purposes.

$F | 12/13-12/17 | Watchlist #1 $F 21.2 bounce
(Bounce level off demand for Calls)
Technical analysis: Bull flag on the daily chart
News catalyst: Ford announced Friday afternoon that it aims to make 300,000 Mustang Mach-E crossovers for North America and China by 2023.

$F beginning to outperform peersF compared to the etf CARZ which represents the overall auto industry has broken with strength a long downward trend in the performance of F in comparison to the industry and it has done so with gusto. I believe this trend in Ford's outperformance will continue.
F-150 Lightning will be one of the number one selling EV's. Ford sold 780,000 F150's in 2020 alone despite the supply chain/chip issues and pandemic. It's going to be a monster of a profit puppy.
There also appears to be an emerging golden cross on the 1-month chart.

FORDAction - Reaction Chart On Ford
Bearish Divergence
Coming into a possible reversal area
Possible top
NO ADVICE GIVEN

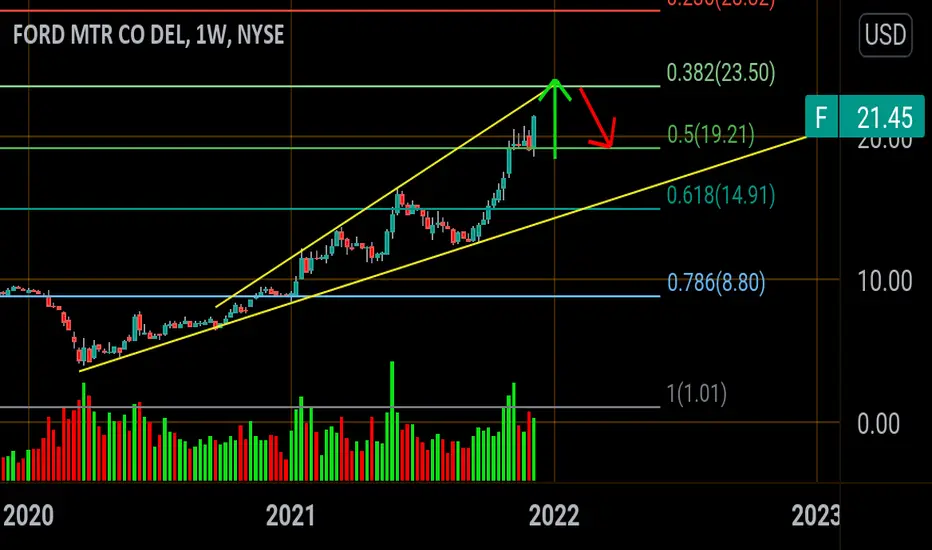
Ford to 23 and pullbackBroke out of a Range Friday on a catalyst news of order on the electric mustang. I think for will Rally up to fibonacci .382 which aligns with the trendline resistance . From there I think we'll pullback and my reasoning for that is that we are overbought on some major time frames.
On the monthly chart , were overbought on MFI and outside of our bollinger bands.
on the weekly chart same issue with the MFI and we're ridining the top of the Bbands.
If you look at the weekly and monthly chart you'll see that in 1999 23.50 was strong support. That support has become strong resistance... If and when Ford breaks over that area there will be I'd look for a new entry
Ford Breaking Out of Consolidation? Fib Levels Explained!F
Fords most recent 1 month consolidation as seen below:
In this video I review the fib levels that were respected throughout the trading day on Friday Dec 10th, 2021. Ford has now attempted a breakout of consolidation and has witnessed an increase in trading volume and bullish call volume. I would like to focus on the TA portion of Fridays bull run, specifically the fib levels and noting that the .618, .382, and .286 were mostly used upon retracement.


F big break - looking for 25 by MarchPretty fantastic move today with a clear breakout from previous range 18.5-20.5. MACD starting to turn upwards. Buy on any touches of the thick 'green' uptrend line here. downside danger starts under 20.5 and stop out around 18.5.


FORD Megaphone pattern!The price may reflect the random disagreement between investors
Megaphone patterns show higher volatility is coming!
A broadening formation is a price chart pattern identified by technical analysts. It is characterized by increasing price volatility and diagrammed as two diverging trend lines, one rising and one falling. It usually occurs after a significant rise, or fall, in the action of security prices. It is identified on a chart by a series of higher pivot highs and lower pivot lows.
Broadening formations are generally bearish for most long-term investors and trend traders since they are characterized by rising volatility without a clear move in a single direction. However, they are good news for swing traders and day traders, who attempt to profit from volatility rather than relying on directional movements in a market. These traders rely on technical analysis techniques, such as trendlines or technical indicators, to quickly enter and exit trades that capitalize on short-term movements. The trendlines help them anticipate turning points where they are able to profit from trading decisions if they time the trade successfully or to cut their losses short if the price moves against their position.
Keep it on your watchlist for Options day trading!
ou can see the most important support (green lines) and resistance (red lines) to watch in the coming days in these charts!
Best,
Moshkelgosha
DISCLAIMER
I’m not a certified financial planner/advisor, a certified financial analyst, an economist, a CPA, an accountant, or a lawyer. I’m not a finance professional through formal education. The contents on this site are for informational purposes only and do not constitute financial, accounting, or legal advice. I can’t promise that the information shared on my posts is appropriate for you or anyone else. By using this site, you agree to hold me harmless from any ramifications, financial or otherwise, that occur to you as a result of acting on information found on this site.

F! Swing trade F is looking great. Breaking consolidation. We can see ATH and a great move ahead.
If YOU NOT a hater and support others like this post! It does MAKES A DIFFERENCE
This one Falls In our research on swing set ups with a good ratio of Risk and Reward.
As always er put quality over quantity, don’t forget to follow us for SWING trades research on risk and Reward Ratio.
Subscribe and don’t miss OUT the next research.
Swing trading is great because you can create a lot wealth in % by risking less $$. Compound Gains.
Thank you for the Love, I really appreciate those likes, makes a difference and pushes me to keep on posting more of these!

F TECHNICAL ANALYSIS bullish flag pattern on the daily chart.
i got caught in a bad play earlier in the week due to being impatient.
when it breaks, it can run up to the 23.50 level.
if it breaks the flag pattern towards the downside it can run down to fill the previous gap.
gap level
-15.75 - 16.50
feel free to give feedback and/or advice on anything.

Attractive RRFord is in consolidation, but poised to move upward with attractive risk reward. Analysis will be invalidated once it breaks below pivot. Manage risk accordingly.

Ford continues to sit in ConsolidationNYSE:F Ford continues to sit in Consolidation and is working itself into 2 different patterns: A Falling Wedge and a Bull Flag (Parallel Channel). Volume has been decreasing this week, but the options chain is heating up on Ford. Ford has been on the Hot Chains list on Unusual Whales this week, and continues to be a hot buy. Bullish on Ford (Still)

Ford Consolidating. Ford has been the most successful trade for me as of late. The daily chart on Ford looks great and i remain bullish on Ford for the long term as the company has made it clear of their intentions to change the business model to Electric. This new COO has really changed things for the company and with the push to make America more electric Ford will definitely give tesla a run for there money. Daily chart looks very bullish as it is clear that Ford is consolidating, and with recent news that Bill Ford purchased about 2 million shares at current prices i remain bullish and give Ford a 50-dollar price target for the long run.
