GE Short before LongI have price testing the resistance zone which is going on now. I can see price dipping down $10.63 - $10.99 which is a support zone to then testing $11.60 and up. For this company, it seems as if price always tests a resistance before dipping. We might be on pattern. I dont expect nothing crazy like Gamestop but get in where you fit in! Two opportunities coming up at market entry!
Let me know what you think!
GE trade ideas

Long Butterfly call for GEGe normally finds a range to trade on for a few months. with the new change in price, the range changes aswell. iIm looking for price tos stay below 14.25 and above 9 dollars. price staying between 10.50 and 12 would be optimal. this position if executed correctly could bring a decent boost to portfolio.
side note keep the butterfly call strategy close its great for steady rangebound stocks and is short strategy.

General Electric Stock AnalysisThe Idea is to go long but only if the 10.4 USD support level will not be broken.
NYSE:GE


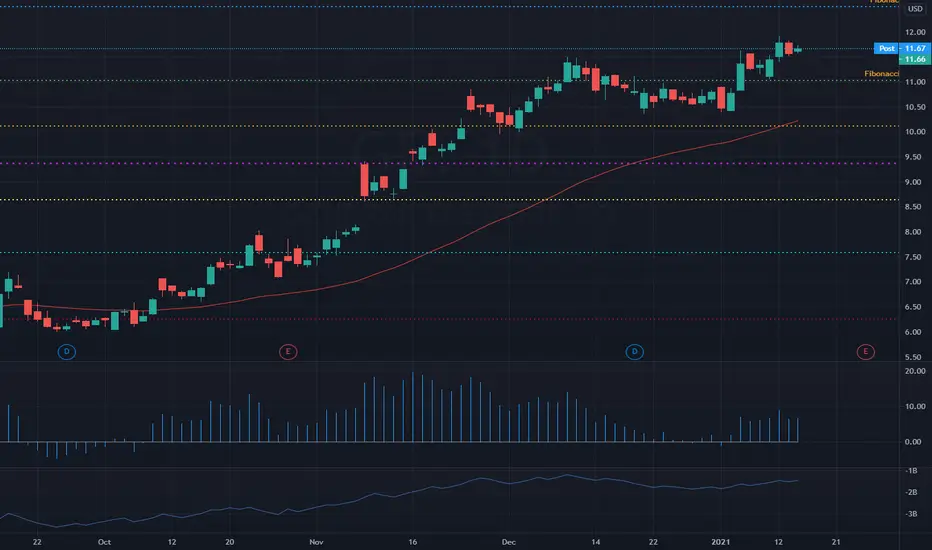
GE Gap FillAfter retracement to the golden zone between 0.618-0.65, GE looks to head for a gap fill for wave 3. There is bullish divergence on the RSI on the hourly and with a solid hammer candle on the daily. A break above $11.15-11.20 would confirm a breakout. Break below $10.70 would invalidate wave count

GEGE, 1-2 week horizon
GE has been trading in a channel for the past month or two.
1. Price currently near the bottom channel support and if it holds, we might be looking for another bullish move.
2. The bottom channel support is quite close to the 50ema which means that there is a chance that price could break thru channel support but bounces up at the 50ema. When this happens, we might be looking at a sideways channel movement.
I am still for the most part bullish on GE because if you look at the weekly time frame, price action has been using the 8ema as support. and MACD seem to be over all bullish.
Cut loss once 50ema support breaks and price action goes below the last two swing low.
Disclaimer
I am not a registered investment advisor and do not offer investment advice and recommendation. All my post is not a recommendation, advise nor a suggestion and should not be used as a replacement for investment advice from a qualified licensed professional. All my post is for, information and entrainment purposes only. You, the reader, bear full responsibility for your own investment and trade decisions and should seek the advice of a qualified securities professional before making any investment or trade.

Elliott Wave View: General Electric (GE) Has Further Downside inShort Term Elliott Wave view in General Electric (ticker: GE) suggests the rally to January 13 high at $11.91 ended wave (3). The stock is now in wave (4) pullback and the internal is unfolding as a double three Elliott Wave structure. Down from wave (3) peak, wave ((w)) ended at $11.25, bounce in wave ((x)) ended at $11.65, and wave ((y)) lower ended at $10.87. This completed wave W in higher degree.
Stock then bounced in wave X which ended at $11.33 as a zigzag Elliott Wave structure. Up from wave W at $10.87, Wave ((a)) ended at $11.18, and wave ((b)) pullback ended at $11.11. Wave ((c)) higher ended at $11.33, which completed wave X. GE then turned lower and broke below wave W at $10.87, suggesting the next leg lower has started. Near term, while rally fails against $11.33 in the first degree, expect further downside in the stock. Potential target lower in wave (4) is 100% – 161.8% Fibonacci extension from January 13 peak which comes at $9.65 – $10.29. Once the stock completes wave (4) pullback, it can then resume higher again in wave (5) to a new high above wave (3) at $11.91.

GE long in to earningsGE typically trades with air lines and BA as the main provider of turbines etc. but this year I believe GE will be an epic turn around story.
I like GE for MANY reasons but as the new administration comes in with a focus on clean energy we know GE will be a huge player when it comes to wind energy. I don't believe this is factored in to the stock. Internally, there's also major turn around going on and the new leadership's changes are just now starting to gain traction. This entry point should be good for both long term holds and short term trades.

big breakout coming to theaters near youi have shares in my longterm portfolio but id consider taking some leaps on a breakout over this downtrend line over 12.10 we can target 14-15. consider taking some profit there before a small pullback! goodluck friends :)


GE Possible Inverse Head and ShoulderNot feeling great about this but the options are so cheap it is worth a shot.

Long | GENYSE:GE
Possible Scenario: LONG
Evidence: Price Action
This is my idea and could be wrong 100%
$GE 2021-JAN-14𝙄𝙎 𝙂𝙀 𝘼 𝙂𝙊𝙊𝘿 𝘽𝙐𝙔?
With it's latest round of earnings due in 2 weeks, GE has broken through back above it's prior support. For a chart that has long been in decline, this rounded bottom offers a lot of positive signs for a powerhouse brand. It should be no surprise, as the new US administration starts to take shape, that some of the renewable investments made by GE over the last few years are set to pay off.
From a more technical standing, the recent retest helped reset the RSI which gives the mid term growth more room to breath. The rising trend is quite sharp, and usually we would expect this to shallow out - but this market is bubbling over right now so tried and true rules need not apply.


General Electric 1day MACD CrossingHello World,
The MACD crossing is an indication that $GE Pump hasn't begun it has just begun. Will Keep you fellow traders informed.


GE Elliott Wave?GE in a mid-Elliott wave. We are going into a "C" correction wave which potentially means a correction to ~8.5%. Thoughs?

$GE - golden crossAlready holding options. This is like watching paint dry for it to get it's pump. But I do think it is coming.


GE Trade IdeaNice flagging here, would enter above trendline break with nice volume, stop loss at 10.20.


General Electric, Buy position at $8I see a reversal taking place, against a bearish long-term trend.
TP 1 will possibly hit.
TP 2 will take a long, long time to hit
TP 3, I honestly think, will not hit for at least 5 years or something.
If you are a short term trader, take profits at the Red Resistance line at $18.55.
If you manage to catch a long at $8.09 and take profits at $18.55, you should walk away with approximately 132% return on that trade, after factoring in spread costs.
I haven't included holding charges for holding stock, if you are leveraging.
I see this as a high risk stock *it has lost a lot of it's market capitalization over the years*, quite volatile, so would use a low lot size, or avoid leveraging for good risk control.
-Divit-

The gap is filledI see here a filled gap and short potential - 11.30 is a significant resistance.
In the next weeks it could be triggered again to rise, maybe a bit higher.
