GE WEEKLY OPTIONS SETUP (2025-07-28)
### ⚙️ GE WEEKLY OPTIONS SETUP (2025-07-28)
**Mixed Signals, Bullish Flow – Can Calls Win This Tug-of-War?**
---
📊 **Momentum Breakdown:**
* **RSI:** Falling across models → ⚠️ *Momentum Weak*
* **Volume:** Weak 📉 = Low conviction from big players
* **Options Flow:** Call/Put ratio favors bulls 📈
* **Volatility (VIX):** Favorable for directional plays
🧠 Model Consensus:
> “Momentum weak, but bullish flow + low VIX = cautiously bullish.”
> Some models recommend **no trade**, others suggest **tight-risk long call**.
---
### ✅ WEEKLY SETUP AT A GLANCE
* 🔍 **Volume:** Weak (distribution risk)
* 📉 **Momentum:** RSI fading
* 💬 **Options Sentiment:** Bullish bias (calls > puts)
* ⚙️ **Volatility:** Favorable
**Overall Bias:** 🟡 *Moderate Bullish*
---
### 💥 TRADE IDEA: GE \$275C
* 🎯 **Strategy:** Long Weekly Call
* 🔵 **Strike:** 275.00
* 📆 **Expiry:** Aug 1, 2025
* 💸 **Entry:** \$1.10
* ✅ **Profit Target:** \$1.80
* 🛑 **Stop Loss:** \$0.55
* 📈 **Confidence Level:** 65%
* 🧮 **Risk Level:** Medium (momentum divergence = tread carefully)
* ⚠️ **Support Watch:** Monitor for drop below \$268–270 for potential exit.
---
### 📦 TRADE\_DETAILS (Algo/Backtest Ready JSON)
```json
{
"instrument": "GE",
"direction": "call",
"strike": 275.0,
"expiry": "2025-08-01",
"confidence": 0.65,
"profit_target": 1.80,
"stop_loss": 0.55,
"size": 1,
"entry_price": 1.10,
"entry_timing": "open",
"signal_publish_time": "2025-07-28 12:08:59 UTC-04:00"
}
```
---
### 📌 NOTES FOR TRADERS
* 🤖 Models split between *no trade* vs *tight-risk long*
* 🚨 **Momentum divergence** is real – don’t oversize
* 🧭 **Watch Friday theta decay** — manage exits accordingly
* 🔍 Chart check: Watch price action near \$275 and \$268
---
**#GE #OptionsTrading #WeeklyPlay #CallFlow #UnusualOptionsActivity #GEcalls #AITrading #RiskManagement**
GED trade ideas

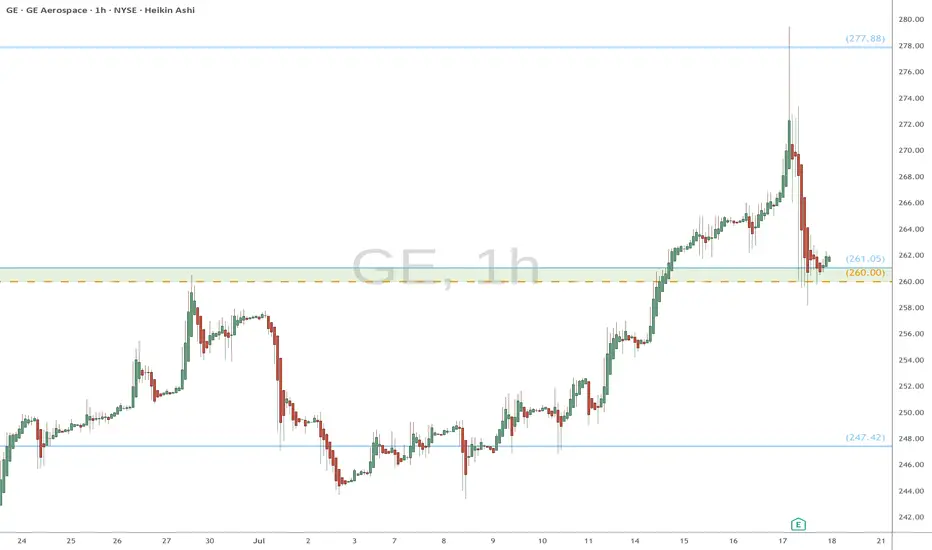
GE watch $260-261: Key support to maintain strong UptrendGE has been in a strong uptrend for a couple of years now.
Earnings report dropped it to support zone at $260.00-261.05
This zone is now clearly visible to everyon, so Do-or-Die here.
Long entry here with tight stop loss just below zone.
======================================================
.
Soaring High: What Fuels GE Aerospace's Ascent?GE Aerospace's remarkable rise reflects a confluence of strategic maneuvers and favorable market dynamics. The company maintains a dominant position in the commercial and military aircraft engine markets, powering over 60% of the global narrowbody fleet through its CFM International joint venture and proprietary platforms. This market leadership, coupled with formidable barriers to entry and significant switching costs in the aircraft engine industry, secures a robust competitive advantage. Furthermore, a highly profitable aftermarket business, driven by long-term maintenance contracts and an expanding installed engine base, provides a resilient, recurring revenue stream. This lucrative segment buffers the company against cyclicality and ensures consistent earnings visibility.
Macroeconomic tailwinds also play a crucial role in GE Aerospace's sustained growth. Global air travel is steadily increasing, driving higher aircraft utilization rates. This directly translates to greater demand for new engines and, more importantly, consistent aftermarket servicing, which is a core profit driver for GE Aerospace. Management, under CEO Larry Culp, has also strategically navigated external challenges. They localized supply chains, secured alternate component sources, and optimized logistics costs. These actions proved critical in mitigating the impact of new tariff regimes and broader trade war tensions.
Geopolitical developments have significantly shaped GE Aerospace's trajectory. Notably, the U.S. government's decision to lift restrictions on exporting aircraft engines, including LEAP-1C and GE CF34 engines, to China's Commercial Aircraft Corporation of China (COMAC) reopened a vital market channel. This move, occurring amidst a complex U.S.-China trade environment, underscores the strategic importance of GE Aerospace's technology on the global stage. The company's robust financial performance further solidifies its position, with strong earnings beats, a healthy return on equity, and positive outlooks from a majority of Wall Street analysts. Institutional investors are actively increasing their stakes, signaling strong market confidence in GE Aerospace's continued growth potential.
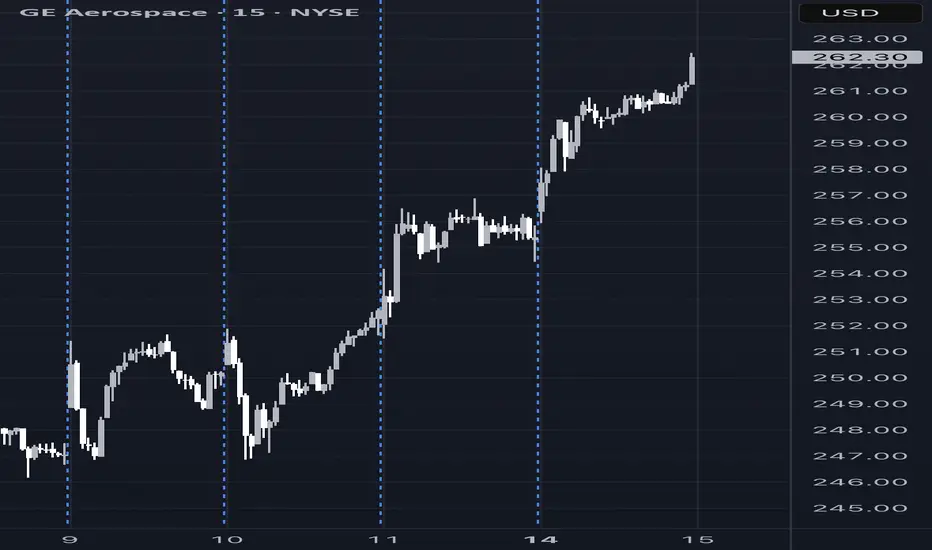
GE Weekly Options Trade Setup – 07/14/2025 $290C | Exp. July 18
📈 GE Weekly Options Trade Setup – 07/14/2025
$290C | Exp. July 18 | Bullish Catalyst In Play
⸻
🔥 BULLISH MOMENTUM CONFIRMED
✅ All 5 major AI models (Grok, Claude, Gemini, Llama, DeepSeek) agree:
GE just broke out — strong momentum, price above MAs, MACD bullish.
📰 Catalyst: Citigroup Upgrade 💥
Low implied volatility + analyst boost = ideal environment for calls.
⚠️ Caution: RSI is overbought, signaling possible short-term pullback. This is a fast trade, not a swing.
⸻
🎯 Trade Plan – High Conviction Setup
Entry at open, ride breakout continuation 🚀
{
"ticker": "GE",
"type": "CALL",
"strike": 290,
"exp": "2025-07-18",
"entry": 0.89,
"target": 1.78,
"stop": 0.45,
"size": 1,
"confidence": "70%",
"entry_timing": "market open"
}
🔹 Entry: $0.89
🎯 Target: $1.78 (+100%)
🛑 Stop: $0.45 (-50%)
📅 Expiry: 07/18/25
📈 Confidence: 70%
💼 Strategy: Naked Call
⸻
📌 Why $290C?
High strike = low cost, great R/R. High OI, and supported by breakout levels from DeepSeek & Grok models.
🧠 Model Sentiment:
“Moderately Bullish” – All point to upside, but suggest smart risk management due to hot RSI.
⸻
💡 Quick Notes
⚠️ Overbought ≠ reversal — just be quick.
📊 Citigroup news is driving flows — but don’t hold into chop.
💬 Tag someone who’s been sleeping on GE 👇
#GE #OptionsTrading #BreakoutPlay #CallOption #AITrading #WeeklySetup #FlowWatch #0DTE #tradingview
Pullback in GE AerospaceGE Aerospace has been rallying, and now it’s pulled back.
The first pattern on today’s chart is the steady advance in April and May that established GE at its highest levels since 2001. Is an accumulation phase underway?
Second is the May 23 close of $232.79. The industrial stock tested and held it yesterday after lingering above it all last week. That could mean new support is in place.
The pullback also represented approximately a 50 percent retracement of the move following the breakout.
Next, stochastics are turning up from an oversold condition.
Finally, the 8-day exponential moving average (EMA) has stayed above the 21-day EMA. That may reflect a bullish trend.
Check out TradingView's The Leap competition sponsored by TradeStation.
TradeStation has, for decades, advanced the trading industry, providing access to stocks, options and futures. If you're born to trade, we could be for you. See our Overview for more.
Past performance, whether actual or indicated by historical tests of strategies, is no guarantee of future performance or success. There is a possibility that you may sustain a loss equal to or greater than your entire investment regardless of which asset class you trade (equities, options or futures); therefore, you should not invest or risk money that you cannot afford to lose. Online trading is not suitable for all investors. View the document titled Characteristics and Risks of Standardized Options at www.TradeStation.com . Before trading any asset class, customers must read the relevant risk disclosure statements on www.TradeStation.com . System access and trade placement and execution may be delayed or fail due to market volatility and volume, quote delays, system and software errors, Internet traffic, outages and other factors.
Securities and futures trading is offered to self-directed customers by TradeStation Securities, Inc., a broker-dealer registered with the Securities and Exchange Commission and a futures commission merchant licensed with the Commodity Futures Trading Commission). TradeStation Securities is a member of the Financial Industry Regulatory Authority, the National Futures Association, and a number of exchanges.
TradeStation Securities, Inc. and TradeStation Technologies, Inc. are each wholly owned subsidiaries of TradeStation Group, Inc., both operating, and providing products and services, under the TradeStation brand and trademark. When applying for, or purchasing, accounts, subscriptions, products and services, it is important that you know which company you will be dealing with. Visit www.TradeStation.com for further important information explaining what this means.

GE AERO WHERE WILL THE PRICE GOTRENDS and Price targets marked.
Price appears to be in "danger zone" or high side with not many price targets left.
There are both support and rejection trends trading down in the short term.
These both lead to a support trend.
Good luck.
Follow for more charts like this.

Taking profit on GE Aerospace stock to buy in lower after summerIt's clear NYSE:GE has hit overbought, it's the perfect time to take profits now. Less stress managing stocks over the summer too lol...
$196 is the 0.618 level I'm aiming to re-enter, there's also decent support near that level $190 to $200

GE Weekly Options Trade – Bearish Setup After Breakdown (2025-0📉 GE Weekly Options Trade – Bearish Setup After Breakdown (2025-06-12)
Ticker: NYSE:GE | Strategy: 🔻 Naked PUT (Short Bias)
Bias: Moderately to Strongly Bearish
Confidence: 75% | Entry Timing: Market Open
Expiry: June 13, 2025 (Weekly)
🔍 Technical & Options Snapshot
• Trend:
– Daily: Bearish (below 10-EMA and Bollinger midline)
– 5-Min: Short-term bounce, but still under key EMAs
• MACD (Daily): Bearish
• Sector Catalyst: Negative headlines related to Boeing engine issues
• Max Pain: $242.50 → could slow full downside but not reverse bias
• OI Hotspot: $237.50 PUTs — strong volume + liquidity
🧠 Model Agreement Summary
✅ All 4 AI Models (Grok, Llama, Gemini, DeepSeek):
• Agree on bearish direction
• All favor puts at or around the $237.50 strike
• Daily breakdown confirmed; news pressure adds downside weight
⚠️ Gemini suggests: more aggressive $235 PUT → but $237.50 strike has better liquidity and balance of risk/reward
✅ Recommended Trade Setup
🎯 Direction: PUT
📍 Strike: $237.50
📅 Expiry: 2025-06-13
💵 Entry Price: $0.83 (ask)
🎯 Profit Target: $1.25 (+50–65%)
🛑 Stop Loss: $0.42 (–50%)
📈 Confidence: 75%
📏 Size: 1 contract
⏰ Entry Timing: Market Open
⚠️ Risks to Watch
• 🔁 Bounce risk: Short-term rally may challenge entry
• 📰 Unexpected good news could reverse momentum
• 💸 Bid/ask spreads may widen at open — use limit orders when possible
• 🎯 Max pain magnet at $242.50 could suppress full downside extension
📉 GE downside continuation or oversold bounce incoming?
💬 What’s your take — buying puts, calls, or staying flat? Drop your thoughts ⬇
📲 Follow for daily AI-backed trade signals and market breakdowns.

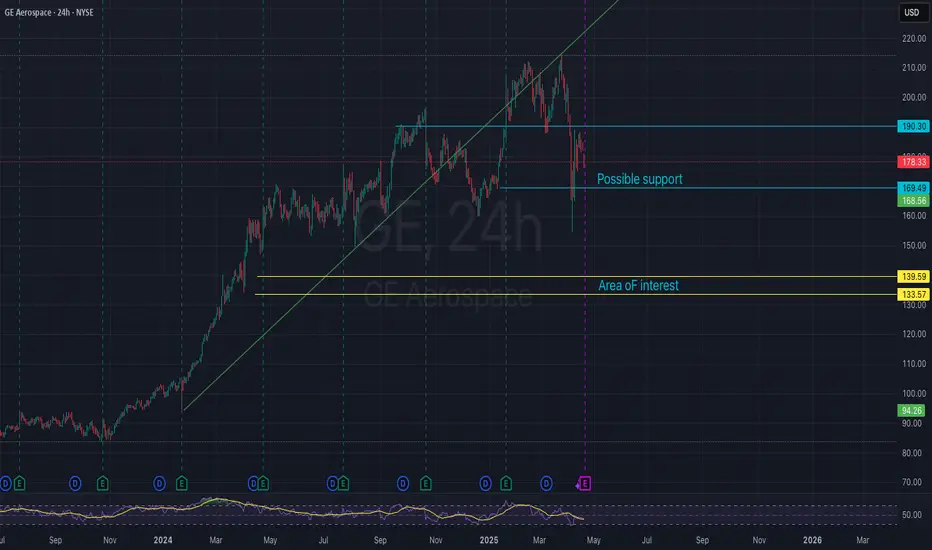
GE Daily Chart: Corrective Pullback Towards Key Support LevelOverview:
GE has experienced a significant bullish run since early April, forming a well-defined ascending channel. However, recent price action indicates a potential corrective pullback after failing to sustain above the upper boundary of this channel. The stock is currently trading below the lower trendline of its previous upward channel, suggesting a short-term weakening of momentum.
Key Observations & Analysis:
1. Ascending Channel (April - June): From early April to early June, GE demonstrated a strong, consistent uptrend, respecting the boundaries of a well-defined ascending channel. This indicated strong bullish sentiment and controlled accumulation.
2. Recent Break Below Channel: In the past few days, the price has clearly broken down below the lower trendline of this ascending channel. This is a significant technical event, often signaling a potential deeper correction or a pause in the previous strong uptrend.
3. Current Price Action: GE is currently trading around $239.72, having pulled back from its recent highs near 255-to- 258. The red candlesticks confirm the ongoing selling pressure in the short term.
Identified Support Levels:
We have identified two crucial support zones where buyers might step in, based on previous price action and potential demand areas:
• 1st Support Zone (230 - 238): This is the immediate and first line of defense for the bulls. This zone aligns with previous consolidation areas and could act as a strong demand zone if the selling pressure subsides.
• Key Support Zone (215 - 220): Should the 230-238 support level fail to hold, the 215-220 zone represents a more significant "Key Support." This level appears to be a stronger historical demand area that could provide a more robust bounce opportunity.
Potential Price Scenarios & Target:
Based on the current pullback and identified support levels, two primary bullish rebound scenarios are outlined:
• Scenario 1 (Shallow Pullback): The price finds strong support within the 230-238 range. From there, we could see a rebound, potentially retesting previous highs.
• Scenario 2 (Deeper Pullback): If the 1st support fails, the price extends its correction to the 215-220 Key Support zone. A strong bounce from this level would then be anticipated.
In both scenarios, the projected upside target for a rebound is the 250 - 258 Target zone. This target range aligns with the previous highs and the upper boundary of the now-broken ascending channel.
Invalidation:
A sustained close below the 210 level would be a significant bearish development, invalidating the immediate bullish rebound thesis and potentially opening the door for further downside.
Conclusion:
GE is currently undergoing a healthy corrective pullback after a strong rally. Traders should closely monitor the price action around the identified support zones (230−238) and (215−220) for potential bullish reversal signals. A successful bounce from either of these levels could see GE aiming for the 250−258 target.
Disclaimer:
The information provided in this chart is for educational and informational purposes only and should not be considered as investment advice. Trading and investing involve substantial risk and are not suitable for every investor. You should carefully consider your financial situation and consult with a financial advisor before making any investment decisions. The creator of this chart does not guarantee any specific outcome or profit and is not responsible for any losses incurred as a result of using this information. Past performance is not indicative of future results. Use this information at your own risk. This chart has been created for my own improvement in Trading and Investment Analysis. Please do your own analysis before any investments.

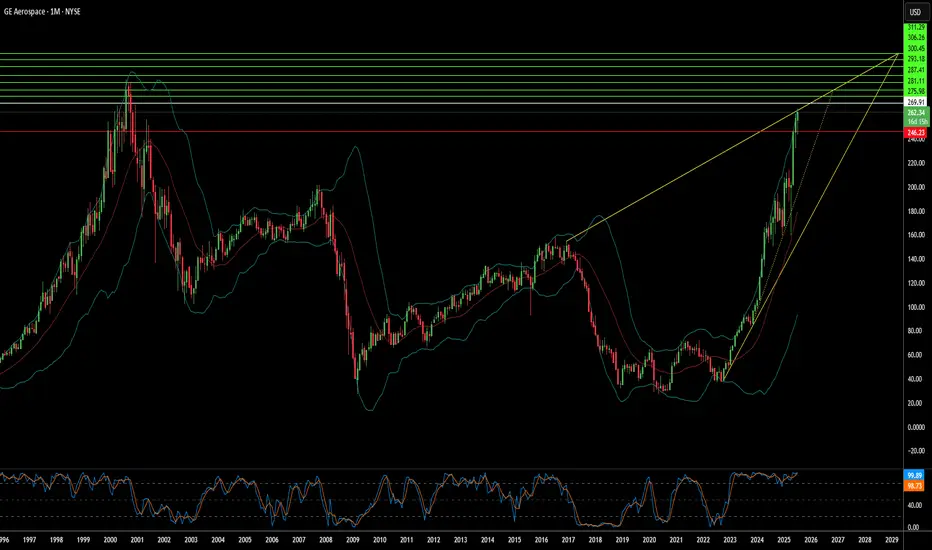
These 2 Signals Made Members 80% Profit!NYSE:GE has had a massive rejection off of Monthly chart rejection.
We issued an alert to members om June 6th 2025. We entered a 245 Put (July 3) $5 con
We closed out our contracts today at $9 and roughly 80% gain.
This chart demonstrates the power of multiyear monthly chart resistance. Trades like these don't come around often but when they do you have to execute and forget about the noise!
This chart proves that technical trendlines do have power!

GE Aerospace: How to go to the moon!GE's stock is soaring due to strong earnings and optimistic future guidance from its aerospace division.
1. Blowout Earnings: GE Aerospace reported earnings per share of $1.75, far exceeding analysts' expectations of $1.10.
2. Surging Orders: The company saw a 46% increase in orders last quarter, signaling strong demand for its products.
3. Revenue Growth: GE generated $10.8 billion in revenue, beating forecasts of $10 billion.
4. Wall Street Optimism: Analysts are raising price targets, with some predicting the stock could climb even higher.
5. Industry Momentum: The aerospace sector is experiencing a boom, with GE positioned as a key player.
I'm betting we are close to a pullback and then catapult to New ATH!

General Electric ($GE)Tradespoon model generated long signal for NYSE:GE . Predicted range: $226.89–$238.04. Trend: +0.04%.

General Electric Wave Analysis – 16 May 2025
- General Electric broke resistance zone
- Likely to rise to resistance level 240.00
General Electric recently broke the resistance zone between the key resistance level 212.00 (which stopped the previous waves 3 and b) and the resistance trendline of the weekly up channel from the end of 2023.
The breakout of this resistance zone accelerated the active minor impulse wave 5 of the intermediate impulse wave (5) from the middle of 2024.
Given the clear weekly uptrend, AT&T can be expected to rise to the next resistance level 240.00, which is the target price for the completion of the active impulse wave (5).

OptionsMastery: Break and Retest on GE.🔉Sound on!🔉
📣Make sure to watch fullscreen!📣
Thank you as always for watching my videos. I hope that you learned something very educational! Please feel free to like, share, and comment on this post. Remember only risk what you are willing to lose. Trading is very risky but it can change your life!


GE Aerospace Wave Analysis – 28 April 2025General Electric: ⬆️ Buy
- GE Aerospace broke resistance area
- Likely to rise to resistance level 205.00
GE Aerospace recently broke the resistance area between the round resistance levels 200.00, 193.60 and the 61.8% Fibonacci correction of the downward impulse from March.
The breakout of this resistance area accelerated the active short-term impulse wave 3 from the start of April.
GE Aerospace can be expected to rise toward the next resistance level 205.00 (former top of wave b from the end of March).

GE Aerospace Wave Analysis – 28 April 2025- GE Aerospace broke resistance area
- Likely to rise to resistance level 205.00
GE Aerospace recently broke the resistance area between the round resistance levels 200.00, 193.60 and the 61.8% Fibonacci correction of the downward impulse from March.
The breakout of this resistance area accelerated the active short-term impulse wave 3 from the start of April.
GE Aerospace can be expected to rise toward the next resistance level 205.00 (former top of wave b from the end of March).

GE - Reports TomorrowHow do you think tomorrow's earnings will go? With 125% tariffs i can't imagine forward earnings will be able to impress. Let's see if we can hit some targets. GL
GE down trend It is expected to move down to less than 120 in next months as it has started losing uptrend momentum.

GE on the Rise: Bullish Momentum in an Ascending Channel!Current Price: $187.31
Stop Loss: $166 (below key support).
TP1: $195 (near-term resistance).
TP2: $210 (channel resistance).
TP3: $230 (analyst high target).
🚀Why GE is a Bullish Opportunity
1️⃣ Strong Earnings Potential (Jan 23, 2025)
Analysts expect: EPS: $1.03 and Revenue: around $9.85 billion, showcasing year-over-year growth.
2️⃣ Aerospace Momentum
Projection: GE Aerospace is on track to achieve an operating profit of $6.7 billion to $6.9 billion for 2024, benefiting from robust demand in both commercial and defense sectors.
3️⃣ Bullish Technicals
Technical Indicators: GE stock is trading within a strong upward channel. Indicators like Stochastic (potentially showing bullish crossover), RSI (at a balanced level of 51, suggesting room for growth), and MACD (indicative of bullish momentum) support this view.
4️⃣ Analyst Sentiment
Consensus Price Target: Analysts have set an average target of $209.78, with some forecasts reaching up to $230, offering an upside potential of 15% to 23% from the current price of $187.31.

GE - all time high broke more highs incoming.GE - Stock broke all time highs today but closed below $212.15 resistance level. Stock has next resistance at $220 and $235 above that level. calls above $212.50 would be a good idea. Stock is decent on indicators. Stock is making V shaped reversal on daily time frame.

Early Sign on General Electric Pivot. GEAnother profitable take last time, despite entertaining a wrong Elliott count. the last idea is linked in to this one
A constellation of factors again on a pivot.
1. Impulse wave completion.
2. MIDAS, BB%PCT cross.
3. vWAP/US combo aligned and bearish.
4. Suspect RSX divergence, now out of OBOS territory.
5. VZO and Stochastic indicator crossed to bearish a while ago.
There are many more interesting things on the chart as far as indicator alignment goes, but its not a listing competition here. Five is generally enough for me to consider putting a position down bullish or bearish.

Potential Short Opportunity for GE Aerospace (GE)GE Aerospace (GE) may be a good short opportunity here, as the hourly chart shows some nice negative divergence within a nice-looking rising wedge formation. If Ge breaks the wedge, short-term support will be around the $205 level. If they break that level, then I would be watching that $199.13 support level. If $199.13 were to fail, I would then watch to see if we could get a third reaction on the possible rising trend line highlighted in light blue.
