GILDBroke through double bottom neckline and EMAs curling upwards convincingly. This is looking very bullish.
GILD trade ideas


GILD - LongMy average price on this is 76.49, so I'm down a little currently, but I think it finally might be ready to move higher.

GILD for a Long PlayShares of GILD have recently broken out above resistance around $74 and have since successfully tested and held it as support (dashed green line) on two different occasions.
They look destined to at least test the falling trend line (red line), and I think there's a good chance we break through that resistance to establish a new trend higher.
I'm a buyer via calls, specifically the November $80 calls because they will carry me through the next earnings report. That's not to say I'll hold them through the release, but I suspect premiums will elevate leading in to the report and that should help bolster the bullish position.


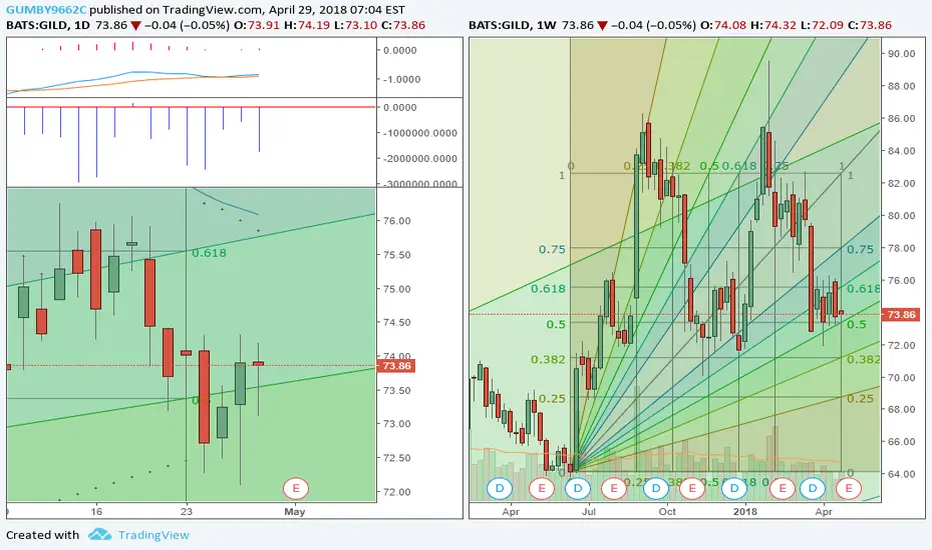
GILD - Turns on supportTurns on support 71.90$ , support FIB 0.5 = 71.64$
resistance MA200 D =73.80$

GILD: No such thing as Double Bottoms? Im a Rookie so dont hateOn weekly chart seeing a trend line from the high as strong resistance and has 2 touches and looks like might be a 3rd to confirm it. Also, on TD the count is on 8 which means we should see a slow down which gives me more faith in the trend line. The Daily on the TD is on a corrective sate completing a 9 and into couple days of correction so i think it coincides with the weekly, we should see another 9 days of up and then should run into the weekly 9 and then another correction.
My thoughts is it touches the trend @ 78.60 ish goes down to test support @64 and then a decision is made if it holds or breaks.

Could we be on course for a major collapse in GILD?I think so. My analysis points to a rapid decline to the 55 region by Feb next year


Gilead Sciences: fighting competitive headwinds?One of the things that analysts are watching out for is the impact of patent expirations on the company's revenue and margin. Gilead's HIV franchise saw the first important patent expirations in 2017, and the firm needs to convert patients to newer products like Genvoya and Biktarvy to avoid a significant hit to sales.
Gilead generates stellar profit margins with its HIV and HCV portfolio, which requires only a small salesforce and inexpensive manufacturing. What Gilead needs to drive business further is HCV market stabilization, strong continued innovation in HIV, solid pipeline data, and smart future acquisitions to return to growth.
www.finstead.com

GILD. LongAnalyst concensus PT $86.5, and breaking the most recent $77.00 resistance. An 8.43 upside from recent support.


GILD - wave 5 in progressIf this is not a perfect demonstration of Elliott Wave Theory, I don't know what else would be.
- Wave 2 measures exactly 61.8% of wave 1
- Wave 3 is exactly at 161.8% of 1
- Wave 4 is exactly at 38.2% of wave 3.
- Inside zigzag 4, c is exactly 123.6% of a.
- Plus the yellow resistance box failed to break out.
- Plus OBV was going no where when price moved from 64 to 72 (labeled as 4).
It looks like wave i of 5 is forming as a leading diagonal and not a bullish flag (in which case resistance will be broken and stop loss will need to trigger).
Stop loss can be placed very tightly at 72.50
Traditional target for wave 5 is just below 60.

GILD - Stock falling to 57 handleSetup:
It was noted that GILD could be dropping to 73.878
Our setup is complemented by the following:
1. Multiple timeframe analysis
2. Divergence
Approach:
Our trade strategy is as follow: We will open two consecutive trades, they will both have the same stop loss but different take profits.
Trade 1:
Entry: 71.94
SL: 74.35
TP: 62.39
Entry: 71.94
SL: 74.35
TP: 57.46
It should be noted that once TP1 is hit, we will move the stop loss of trade 2 to breakeven.
Risk & Reward:
Total Risk:
2%
Total Reward:
10.2%
Good Luck :-)

Pullback and UpBeen following GILD for a while and missed the leg up after the consolidation. Now its the time to short for a small profit and then move to the other side of the trade for the leg up.

Gilead Sciences - Channel breakout!Gilead Sciences has recently double-bottomed and rallied sluggishly for the past month. This week however, there is back-to-back good news for the former Wall Street darling. With the decline of their hepatitis C franchise, GILD has been expanding into oncology and bolstering their HIV pipelines to makeup for lagging sales in their once stellar hepatitis core-business. Just this week Kite, a recent Gilead acquisition, reported positive data in their phase I trial for Human Papillomavirus (HPV) related cancers and is in trials to expand the use their approved Yescarta CAR-T therapy from lymphoma to hematologic cancers. This poised Gilead for breakout of the down-channel it has been in following the acquisition of Kite, which was met with enthusiasm, and perhaps some over-exuberance from investors.
Today, Gilead announced they have entered into a research collaboration and license agreement with Hookipa Biotech AG. Gilead will own exclusive rights to Hookipa's TheraT and Vaxwave arenavirus immunization technologies for hepatitis B virus (HBV) and human immunodeficiency virus (HIV). This gave the stock the momentum to break out of the down-channel with good volume today, finishing with a very strong candle on the daily chart. Look to enter positions on any profit taking after open tomorrow, but don't be afraid to buy into strength on this one.
Channel resistance breakouts tend to break out to 100% of the size of the channel width. www.investopedia.com As such, I have cloned and placed the Chanel width to the break out point to arrive at my price target of $80, which is just above the 0.618 Fibonacci level. Fibonacci resistances tend to bend and snap back, allowing nimble traders or those with well placed limit-sell orders to take profits a few points higher, before a danger of rejection off the resistance line. As such, these are two indicators that the price will: 1) achieve the price target and 2) allow for profit taking and a slightly lower re-entry point for the swing traders or active traders bullish on Gilead.
Stops can be placed fairly aggressively, as there should be good support at the point of the breakout, and if this fails, the breakout is invalidated. On the chart I have placed a stop at $69.30, though, if you enter this trade it is your responsibility to manage your position and risk.
The engineered T-cell therapy has the potential to disrupt oncology. Gilead, with its massive war chest and history as a disruptive, industry-leader is well positioned to be at the forefront of this cancer treatment revolution. Please note, this is a short-term trading price target. The potential for Gilead to rally much higher is certainty there, that's what I note in the above paragraph that re-entering after a pullback from the channel breakout / 0.618 Fibonacci target.
As always, the responsibility for managing your position is your own. I am not a financial adviser nor is any content in this post intended to be financial advice. The information presented is my opinion, based on tools I have learned from others sharing their opinions and my experience in the markets. I share these ideas to generate discussion and have others critique my analysis because, as always, I am still learning. With that in mind, the outcome could be quite different than what I am predicting and this is for informational purposes only. It should not be considered financial or investment advice of any kind. Readers should consult with a financial or investment professional to determine what may be best for their individual needs.

too nice area for swing tradingGILD has been in a bear market lately, i think its time for a double bottom bounce!

GILD reporting this weekThe reaction ti earnings the past year not so good. BIIB this week was nothing to get excited about for sure. Biotech is definitely out of favor with declining avg weekly volumes in the sector. This is yet another example where up side earnings movement is likely to get sold into.
Earnings play - Long GILDEntry: $73.50 (options Call exp May 4).
Bullish.
1st target: $76.26
2nd target: $79.17


GILD Bearish bounce off $76 resistance levelThe bearish DailyPlay we chose for Tuesday, April 24th is Gilead (GILD). GILD recently bounced lower off its $76 resistance level and trends have turned bearish with weak moneyflow. Look for a continuation lower towards $69 support level as our target. We suggest using put vertical spreads to take a bearish view with limited risk.
OptionsPlay Example: GILD Jun 01 67.5/75 Put Vertical @ $276 - View this Trade: app.optionsplay.com
Cost: $276
Max Reward: $474
Max Risk: $276
POP: 45.20%
Breakeven: $72.24
As a stop loss, if GILD was to trade above $76 for multiple days, this would invalidate our analysis and suggest getting out of the trade.
