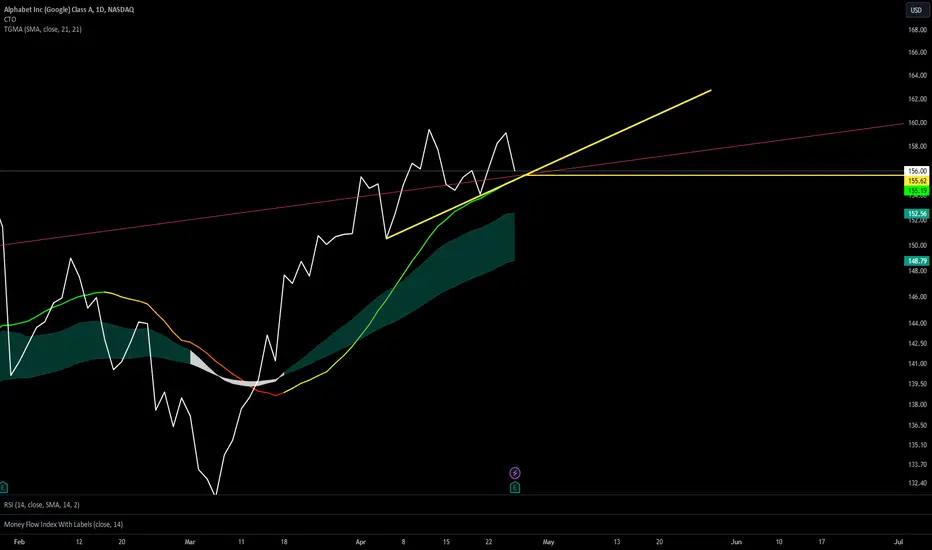
GOOGL April 3, 2024: Price Target This Time?On April 1, 2024, NASDAQ:GOOGL broke out to a new high, as mentioned in my post in the related ideas section. I entered my first position there on that candle.
Now, what is the target price?
I don't use target prices much in my trading because I am a trend-following trader, and I am trying to hold on to a position for as long as possible until the uptrend ends.
But let's try to use some pattern for a prediction.
The target price was shown on the chart.
GOOGL trade ideas

Googl - Complete rounding bottom pattern, what's next ? Google successfully bounce from 127 support with Monring Star reversal
It's now completed and breaks Rounding Bottom chart pattern
150-153 zone will be new support to look for BoD (Buy on Dip) opportunity.
Based on Rounding Bottom target calculation, next long term target will be at 217
Expect some turbulance around 176-192 zone.

Alphabet trade updates (+101%)Alphabet Inc., the parent company of Google, has just released its financial results for the first quarter of 2024, and the numbers are nothing short of impressive. With the tech industry undergoing rapid evolution, all eyes were on Alphabet to see how it navigated this dynamic landscape.
Here's a breakdown of the key highlights from Alphabet's recent earnings report:
1. Revenue Surge: Alphabet reported a significant increase in revenue compared to the same period last year. Despite various global challenges, Alphabet's revenue soared, reflecting the resilience and adaptability of its business model.
2. Strong Performance in Advertising: Advertising remains the primary revenue driver for Alphabet, and Q1 2024 saw continued strength in this segment. Google's advertising platforms, including Google Search, YouTube, and Google Ads, delivered robust performance, reaffirming their status as preferred channels for advertisers worldwide.
3. Cloud and Other Bets: Alphabet's diversification efforts beyond advertising, particularly in cloud computing and other innovative ventures, continued to show promise. The company's cloud division witnessed steady growth, fueled by increasing demand for cloud infrastructure and services. Additionally, Alphabet's investments in ambitious moonshot projects underscore its commitment to driving innovation across various domains.
4. Focus on Innovation and Sustainability: Alphabet remains at the forefront of technological innovation, with ongoing investments in cutting-edge technologies such as artificial intelligence, machine learning, and quantum computing. Moreover, the company has reaffirmed its commitment to sustainability, with initiatives aimed at reducing its environmental footprint and promoting renewable energy.
5. Forward-Looking Outlook: Looking ahead, Alphabet remains cautiously optimistic about its future prospects, acknowledging the evolving nature of the global economic landscape. With a strong foundation built on innovation, resilience, and adaptability, Alphabet is well-positioned to navigate challenges and capitalize on emerging opportunities in the tech industry.
The trade:
100% achieved, next week I'll take home 50% of the profit.


Goog: Is that a bullish blowout or blow off top?Today's candle on google is a doozy. Way gap up and drop till the end of the day, closing way above Bollinger bands and extreme volume spike; all making of a blow off top condition. Next week, we could see some strength to go a bit higher, but, it should run out of steam first. These conditions call for a short, but have to be careful on a massive blowout situation. Next week, a small portion on a Put fly at the open might not be a crazy idea. Target back to $162 - $158 retest, with a hedge on the upside if it makes it to $182. Eventually, we might see the $144 gap close before the final leg up towards next year.

GOOG Alphabet Options Ahead of EarningsIf you haven`t bought the dip on Alphabet:
Then analyzing the options chain and the chart patterns of GOOG Alphabet prior to the earnings report this week,
I would consider purchasing the 165usd strike price Calls with
an expiration date of 2024-6-21,
for a premium of approximately $5.50.
If these options prove to be profitable prior to the earnings release, I would sell at least half of them.

Still Holding Support Till Further Notice...Every article on google is bearish just like every other time it has gapped down aggressively.
This GAP is almost 100% going to fill. When, I do not know.
I think it could consolidate here and pop to 155 to create triple negative divergence AND produce a lower high even after a gap fill.
If we fall and loose this red 55 day MA, the algorithm will flip to bearish.

Google Takes Flight: Soaring Valuation, Strong Earnings, and RewAlphabet Inc., Google's parent company, is experiencing a period of phenomenal growth. The tech giant is on the cusp of a historic milestone – a market capitalization approaching $2 trillion. This achievement comes alongside impressive quarterly earnings that surpassed analyst expectations, solidifying investor confidence. Further sweetening the deal for shareholders, Alphabet recently distributed its first-ever dividend and announced a substantial $70 billion stock buyback plan.
The meteoric rise in market value reflects investor optimism about Google's future. The company's core advertising business remains robust, fueled by the ever-increasing reliance on digital marketing. Google's dominance in search and its expansive network of online properties continue to generate significant advertising revenue. But Google's ambitions extend far beyond traditional advertising.
The company is at the forefront of artificial intelligence (AI) development. Its investments in AI research and applications are paying off, with innovations like Google Assistant and DeepMind showcasing the transformative potential of this technology. AI is being integrated across various Google products, enhancing user experiences and driving new revenue streams.
Another key driver of growth is Google Cloud. This segment, often overshadowed by the advertising juggernaut, is steadily gaining traction. Cloud computing is a rapidly expanding market, and Google Cloud is well-positioned to capture a significant share. With its robust infrastructure, suite of cloud services, and focus on security, Google Cloud is attracting major corporations looking for reliable and scalable solutions.
The recent surge in stock price also reflects the success of Alphabet's first-ever dividend payout. This move signals a shift in the company's strategy, acknowledging the growing base of long-term investors seeking regular returns. The dividend, coupled with the sizable stock buyback program, demonstrates Alphabet's commitment to rewarding shareholders and returning value. The buyback plan will reduce the number of outstanding shares, potentially driving up the stock price further.
However, Google's path to continued dominance isn't without challenges. Regulatory scrutiny over data privacy and antitrust concerns remain significant hurdles. The company faces intense competition from other tech giants like Apple and Amazon, all vying for dominance in the digital landscape. Additionally, the broader market environment could impact Google's performance. Economic downturns or fluctuations in interest rates could dampen investor confidence and affect advertising spending.
Despite these challenges, Google's future appears bright. The company has a proven track record of innovation, a diversified business model, and a strong financial position. With its recent stellar earnings report, soaring market value, and commitment to rewarding shareholders, Google is well-positioned to maintain its position as a tech leader for years to come.

Apr 26: Near a medium-term topThe huge gap up post-earnings on Friday is near the finals of the rally from Jan 2023 in the weekly chart.
A closer look at the 4-hour chart with the help of stochastic and RSI shows that one more high is needed early next week (Apr 29 - May 3) to establish a medium-term top before a sizeable drop will begin. I believe the earnings gap will be filled in the subsequent drop.
This will sync with the relief rally of NASDAQ:QQQ AMEX:SPY

Forecasted to Reach New All-Time High with +14% Upside PotentialHi Realistic Traders, let's delve into the technical analysis of NASDAQ:GOOG
Google has rebounded three times on the EMA200 Line with upward impulsive movement, indicating a continuation of the bullish trend. Additionally, it has formed a bullish chart pattern known as a falling wedge pattern. In March 2024, it broke out of the falling wedge pattern with a bullish full-body candlestick and higher-than-average 7-day trading volume . This higher-than-average trading volume is significant as it suggests increased market participation and conviction behind the price movement, reinforcing the validity of the breakout. Moreover, the MACD has made a bullish crossover, signifying a shift towards upward momentum. A bullish crossover in the MACD is a crucial signal in technical analysis, indicating a potential reversal from bearish to bullish sentiment. This occurrence is significant as it suggests strengthening buying pressure, often foreshadowing further upward movement in the price. Analyzing these technical factors, we forecast a potential upward movement to our designated target.
It is essential to note that the analysis will no longer hold validity once the target/support area is reached.
Disclaimer:
"Please note that this analysis is solely for educational purposes and should not be considered a recommendation to take a long or short position on GOOG."
Please support the channel by engaging with the content, using the rocket button, and sharing your opinions in the comments below!

Google Inc. ($GOOG) Stock Surged 10.4% on Earnings Beat In a landmark moment for the tech industry, Alphabet Inc. ( NASDAQ:GOOGL ), the parent company of Google, has surpassed Wall Street's expectations and made history by announcing its inaugural dividend and a staggering $70 billion stock buyback program. The groundbreaking move comes as Google's first-quarter earnings and revenue far exceeded analyst forecasts, igniting investor optimism and propelling Google stock to new heights.
Unprecedented Growth Amidst AI Revolution
Google's remarkable performance in the first quarter of 2024 has reinforced its position as a powerhouse in the tech landscape. With earnings per share soaring by an impressive 61% year-over-year to $1.89, and gross revenue climbing 15% to a staggering $80.54 billion, the company has demonstrated robust growth across its diverse portfolio of businesses. Analysts had anticipated earnings of $1.51 per share on revenue of $78.7 billion, but Google's stellar results surpassed even the most bullish forecasts.
AI-Powered Success Across Business Units
Its thriving cloud computing and YouTube units are fueling Google's stellar performance, which exceeded expectations and showcased the transformative impact of artificial intelligence (AI) innovations. Advertising revenue surged by 13% to $61.66 billion, driven by Google's unmatched data and distribution advantages. YouTube, in particular, reported a remarkable 21% increase in ad revenue, buoyed by the platform's burgeoning subscriber base and expanding content ecosystem.
Market Response and Future Outlook
In the wake of Google's stellar earnings report, NASDAQ:GOOGL stock surged by an impressive 10.4% in early trading, reaching $172.24. Investor sentiment is overwhelmingly positive, with the stock surging with a Relative Strength Index (RSI) of 73 which is within the overbought region. While concerns over capital spending have lingered, particularly amidst intensified competition in the AI landscape, analysts remain bullish on Google's ability to navigate these challenges and sustain its momentum in the years ahead.
Pioneering the Future of Tech
As Google ( NASDAQ:GOOG ) continues to lead the charge in AI-driven innovation, the company's groundbreaking achievements underscore its unwavering commitment to shaping the future of technology. With its visionary leadership, formidable resources, and relentless pursuit of innovation, Google ( NASDAQ:GOOG ) is poised to redefine the boundaries of possibility and create enduring value for shareholders, consumers, and society at large. As the tech giant embarks on this transformative journey, the possibilities are limitless, and the future is undeniably bright.

GOOG MAJOR TOP FORMING We are now entering an area of HIGH RISK 180 to 193 I would stand aside as the blowoff in this stock is rather clear in formation

Google Share Price Rose Post-market to a New All-time RecordGoogle Share Price Rose Post-market to a New All-time Record
Yesterday, after the close of the main trading session, a report on activities for the 1st quarter of Alphabet Inc. (Google's parent company) was published. The report was strong, exceeding investors' expectations.
→ Quarterly EPS = USD 1.89 (expected = USD 1.51), which represents a 15% increase year-over-year;
→ gross revenue = USD 80.539 billion (expected = USD 78.73 billion).
It was the fifth straight quarter in which Alphabet beat analysts' expectations on both revenue and profit. But the main surprise was the company’s decision to start paying dividends and increase the amount allocated for share buybacks to USD 70 billion.
According to Benzinga, Alphabet CEO Sundar Pichai made a number of important announcements about the future:
→ The company's combined YouTube and Cloud business revenues will be USD 100 billion in 2024, indicating a growth rate of 25% in each of the next three quarters.
→ Pichai also expressed confidence in Alphabet's ability to manage investments in AI, announcing capital expenditures of USD 12 billion.
As a result, the share price of Alphabet Inc. Class A (GOOGL) surpassed USD 180 in post-market trading, setting a new all-time record. In premarket trading today, GOOGL is trading around USD 176.
According to technical analysis of GOOGL stock price:
→ The ascending channel, in which the price fluctuated during 2023-2024, is now expanding upward. Its upper limit of USD 200 per share could be considered a target for bulls, provided the current positive sentiment continues;
→ Surely, at the opening of today's main trading session, a bullish gap will form on the GOOGL stock price chart, which in the future may serve as an area of support, as it did in the past (as shown by the purple figures).
According to TipRanks, the average analyst price forecast for GOOGL is = USD 167 in 12 months, but given recent events, it would not be surprising to see forecasts revised upward.
This article represents the opinion of the Companies operating under the FXOpen brand only. It is not to be construed as an offer, solicitation, or recommendation with respect to products and services provided by the Companies operating under the FXOpen brand, nor is it to be considered financial advice.

googleGoogle reporting earnings 4/26. a key day support at play with possible head and shoulders. #googl NASDAQ:GOOGL #google #stockmarket #investor #trader
What is going on with GOOGL?Price adjusted volume continues to make lower highs as the stock pushes to all time highs. What is behind it? (Money Flow Line shown here)
- Are people less interested in buying at these prices?
- Are people more interested in selling at these prices?
- Does this divergence mean is the trend expected to reverse? …or will it continue regardless?
- Are big players selling chunks to retail hype?

Trying to kick a 50yd field goal GOOGLafter watching 4 TTI vids im now an expert on longs and am calling it now. 159 or so i dunno when but its just what it loooks like to me. jk jk. really just trying to learn swing trading at a deeper level following market structure. looking to see how it plays out and what happens when it fails so i can replicate said results and play them to my advantage

GOOGLE with a bullish secret mountainI mean, let's be honest, everyone knows this pattern so I probably don't need to over-explain.
But basically, GOOGLE is quite bullish to 142.
The RSI on the bigger charts still have room to climb, and the smaller charts are all pretty high. The thing to notice is the rejection off a resistance trend, with a high short term RSI and a longer term RSI that is pumping. The high short term, at the rejection area implies that a drop would be soon to follow. That drop is starting to line up right with some pretty solid short term trend support. If the short term trend support holds up, we can keep pumping until we hit the next resistance trend, which would probably coincide with a cool down.
There are a few different paths that google could get up to the mid 140's, and the orange mountain drawing is one of them, and the one that provides a more natural growth in the short term with a healthier cool down. However, we could potentially see a more explosive move off the trend which might look more like this (pink)
On a trend break, depending on where this occurs, we could see some major downside (or some not so major downside depending on your position) with a nice little bounce back. Which might look more like this.
followed by a bounce somewhere (idk where) this is just a really really rough trading plan just incase we see a trend break and a drop. Lines are not accurate in terms of price and time frame.
If we drop to the secret base, maybe just under 126, expect a missile launch. Missile launch could be a dud and might not make it back past 133.

Google stock breakout - $300 price targetGoogle stock is showing a clear sign of breakout. Price target is $300.


Alphabet Q1'24 Earnings Report. Full UpAlphabet announced First Quarter 2024 Results.
Sundar Pichai, CEO, said: “Our results in the first quarter reflect strong performance from Search, YouTube and Cloud. We are well under way with our Gemini era and there’s great momentum across the company. Our leadership in AI research and infrastructure, and our global product footprint, position us well for the next wave of AI innovation.”
Ruth Porat, President and Chief Investment Officer; CFO said: “Our strong financial results for the first quarter reflect revenue strength across the company and ongoing efforts to durably reengineer our cost base. We delivered revenues of $80.5 billion, up 15% year-on-year, and operating margin expansion.”
Revenues B$80.539, Change in revenues year over year +15 %
Operating income B$25.472, Operating margin +32 %.
Diluted EPS $1.89 ($1.511 Estimated).
Dividend Program Alphabet’s Board of Directors approved the initiation of a cash dividend program, and declared a cash dividend of $0.20 per share that will be paid on June 17, 2024, to stockholders of record as of June 10, 2024, on each of the company’s Class A, Class B, and Class C shares.
The company intends to pay quarterly cash dividends in the future, subject to review and approval by the company’s Board of Directors in its sole discretion.
Stock Repurchases Alphabet’s Board of Directors today authorized the company to repurchase up to an additional $70.0 billion of its Class A and Class C shares in a manner deemed in the best interest of the company and its stockholders, taking into account the economic cost and prevailing market conditions, including the relative trading prices and volumes of the Class A and Class C shares.
The repurchases are expected to be executed from time to time, subject to general business and market conditions and other investment opportunities, through open market purchases or privately negotiated transactions.
Technical graph indicates on Strong Bullish Sentiment.

$GOOG Dreaded Double TopHere we are looking at NASDAQ:GOOG for long term market direction
We can see on the large time frame we are developing a double top scenario within a rising wedge.
With the higher time frames coming into focus as the dominant chart, we are likely to see Google fall over the coming weeks to close gaps at or very near to 143 and again at 112.
If you inspect the Daily CCI you will see we are breaking negatively to the downside below the zero line and implying a pick up in speed Coming Soon ™ on an impending pullback.
If the Daily CCI holds here we could see support forming for a leg Higher.

GOOG “Google” signaling Bearish Divergence before earnings!!!!This is a crucial week for the tech industry with the Mag 7 approaching earnings, and GOOG “Google” particularly has earnings Thursday After-Hours. We’ve been displaying Bearish divergence since January, and currently forming a Head & Shoulders pattern……given the current market sentiment I believe we could see a nice pull back from Google before continuing to the upside. Long-term I’m definitely bullish on GOOG, however short term I believe we’re due for a pullback!
-@Gutta_CEO_

$GOOG Bearish Reversal, next target is $145Hello everybody,
NASDAQ:GOOG has been trading within a rising channel. The recent rejection of price at channel top has reversed the trend and now NASDAQ:GOOG is heading to the lower bottom of channel, the short term price target is $145 where the previous gap fills.
This is not a financial advice.
Cheers!!
