GS Daily TimeframeSNIPER STRATEGY (new version)
It works ALMOST ON ANY CHART.
It produces Weak, Medium and Strong signals based on consisting elements.
NOT ALL TARGETS CAN BE ACHIEVED, let's make that clear.
TARGETS OR ENTRY PRICES ARE STRONG SUPPORT AND RESISTANCE LEVELS.
ENTRY PRICE BLACK COLOR
TARGETS GREEN COLOR
STOP LOSS RED COLOR
DO NOT USE THIS STROTEGY FOR LEVERAGED TRADING.
It will not give you the whole wave like any other strategy out there but it will give you a huge part of the wave.
The BEST TIMEFRAMES for this strategy are Daily, Weekly and Monthly however it can work on any timeframe.
Consider those points and you will have a huge advantage in the market.
There is a lot more about this strategy.
It can predict possible target and also give you almost exact buy or sell time on the spot.
I am developing it even more so stay tuned and start to follow me for more signals and forecasts.
START BELIEVING AND GOOD LUCK
HADIMOZAYAN
GS trade ideas

GS bearish divergence, SHORT nowBearish divergence in MACD. Think that we have a short oportunity going on here. Price has not strenght to keep going up. Stop Loss above previous high.

The case for the Goldman short.You can't short companies just because you think they are abhorrent (You just give your money to people you'd not like), but just for the record - I don't like GS. Been waiting a while for the shorting opportunity to set up in GS.
GS has been hy6per parabolic through the last swing. A common trait of a blown-off top. These moves often terminate in the 161 extension area of the previous fall. There can be some false breakouts but when the market gets back under the 161 the sellers come in hard and strong.
We have a bearish butterfly completing. The butterfly and the head and shoulders are two of the most common false breakout patterns I tend to see around large inflection points. When I see a butterfly here I am usually willing to speculate not only the butterfly will drop the market but also that the break it makes will develop into a second trade. The price action I am looking for here is there to be a hard sell-off. A breaking of the range and harmonic low. The market slowly ranging for a while (Probably at least a few days) and then a hard second break - which is where we'll be into the meat of the downtrend.
This is similar to a previous BTC forecast, which is linked for an example.

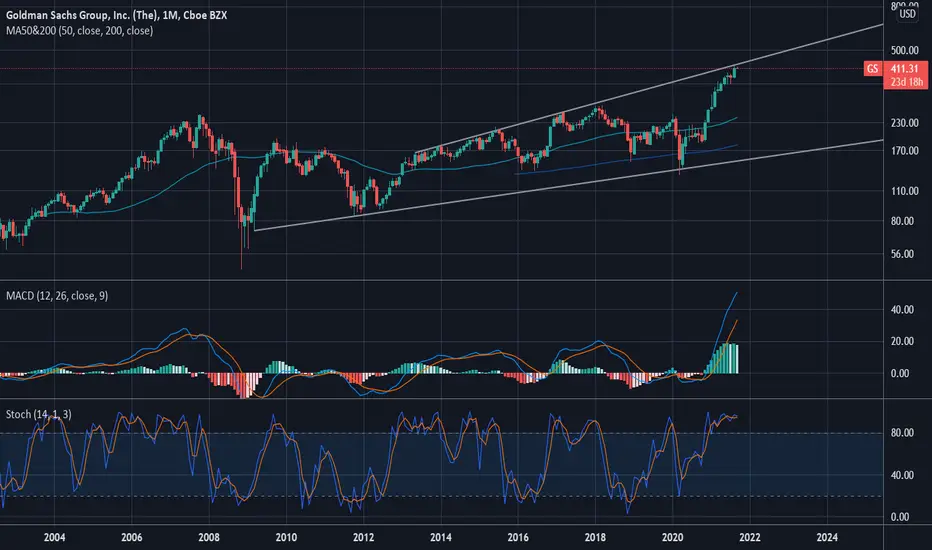
ANALYSIS ON W1 TFIf the current top holds, price will see a correction to complete the current cycle. Manage risk responsibly


GS on the breakout lately! nice breakout on GS this past week, look for continuation this week if SPY can go green today. our last price target at 410 can hit pretty quick. size is medium for me but the payout can be big! goodluck traders, like and follow for more.

Bullish- Triangle breakout- Bollinger bands starting to squeeze
- EMAs curling
- Buyers stepping in
- Will be looking for a breakout, just some support and resistance levels to keep an eye on along with some RSI based supply and demand zones
PT1- $381.06
PT2- $384.52
PT3- $386.93+

$GS with a Neutral outlook following its earnings #Stocks The PEAD projected a Neutral outlook for $GS after a Positive over reaction following its earnings release placing the stock in drift B
If you would like to see the Drift for another stock please message us. Also click on the Like Button if this was useful and follow us or join us.

Bullish- Triangle breakoutSymmetrical triangle forming off of a long-term uptrend line. Blew away earnings but had a solid run-up to ER so will be expecting a retracement back to the 370 level. However, am bullish & will be looking for an entry for a long play and a breakout from this triangle.

GS earningsWith the double tap on a -2 deviation and surprise earnings in the positive, we should see some upward movement on GS.

Long GSLong GS after earnings,
Was not a bad earnings so dont think the current up trend will buckle by breaking 317
50Ema also holding up the trend
target willbe after the next swing up and break ATH then it close below 9ema on daily
stop will be if it close below 317

$GS Goldman Sachs Fibonacci Levels
Hopefully you find the chart helpful in terms of Supports & Resistance etc.
we refrain from adding commentary on the chart as that is reserved for our members and we are very conscious of not giving financial or trading advice.
Thank you for taking time to consult our chart and we would really appreciate a like, follow or comment.

GOLDMAN SACHS FLAG AND POLE GOLDMAN SACHS DAILY TF GIVING A FLAG AND POLE WITH $43 UPSIDE DURING AN EARNINGS SEASON.
FEEL FREE TO DROP IN YOUR FEEDBACK..
Thanks

JPM swing idea$375 call July 23rd exp. Sitting above the 200 ma w a MACD crossover and parabolic SARS showing. Nice swing to the upside Price Target $385-$388


$GS looks like potential head and shoulders set up Many of the $XLF holdings look to be setting up head and shoulders patterns. Maybe it is sympathy to the big head and shoulders set up on #Bitcoin or is it Basel III standards going into effect.


$GS to 391 extended target for the month of JunePlay for June opex. GS to 391 extended target. Set stop loss at 362.
Pennant formation

GSLong GS🚀📊
It is not financial advice. This is my opinion. Please check yourselves and invest in the symbols in which you think have a huge opportunity to reach the best results.
please leave us your opinion and reviews.🙏🙂
Good Luck 👍😉

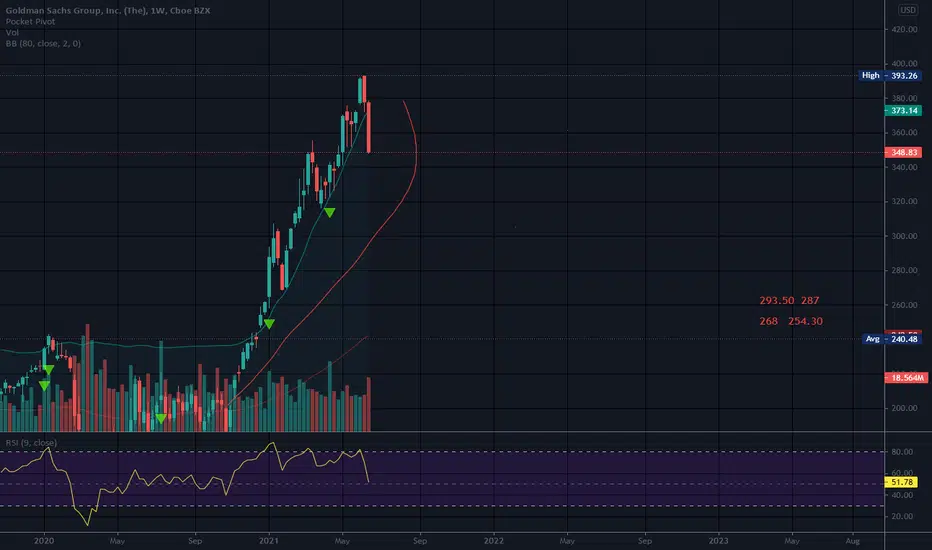
Possible Parabolic ArcWhat a run! This is a weekly chart. There are also several rising wedges on the daily chart that I did not draw with the lowest wedge being right under 240. Nothing slowed GS down!
No recommendation.
Arcs usually pull back anywhere between the .5 and .786 fib levels. I have seen some pull back only to the .382, but it is usually short lived before another fall occurs...not always though.
Arcs can be volatile to trade until they land, and even then can remain volatile for quite some time. They are volatile due to the extreme bullish stance folks have but as a rule, a move this steep is not sustainable long term.
Human nature usually wins this battle, and folks sell due to greed or pure common sense. Short percent is low and NV is high. If you want to buy this pull back, just be safe.
If or when it falls, or lands, it usually does not happen overnight. There will most likely be "Pull Ups" along the way. Good luck!