GS swing short ideaHey all, I think it is fair to say that Goldman Sachs is in a markdown phase, and has had a strong rally off of the bottom. When this rally subsides, which I believe will be soon, I think it presents solid reward to the downside.
GSD trade ideas

$GS with a Bullish outlook following its earnings #Stocks The PEAD projected a Bullish outlook for $GS after a Positive Under reaction following its earnings release placing the stock in drift A with an expected accuracy of 66.67%.
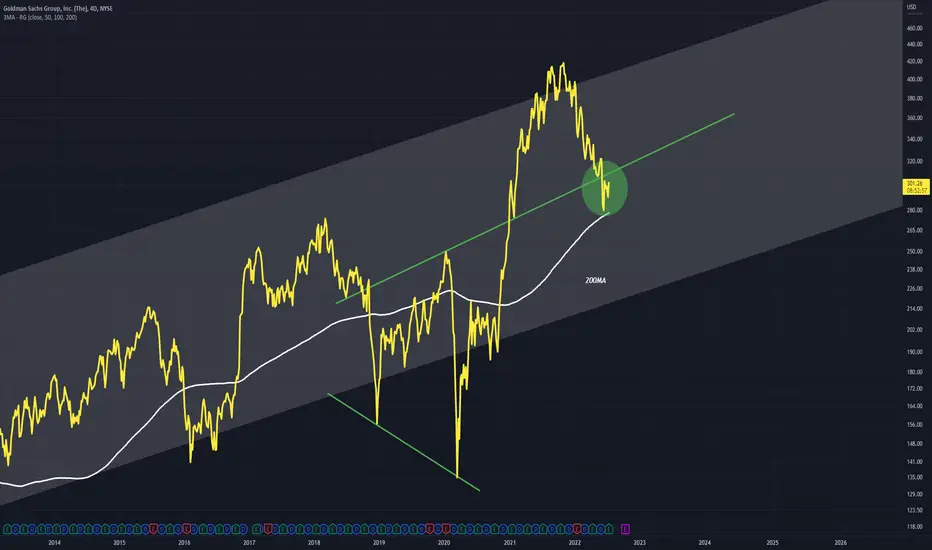
GS - 200MA RecoveryGS has hit a short term pattern support and is currently testing the 200MA
This is a good spot for a recovery within this long term upward channel
4D chart
Goldman Sach's VS US Money Supply Is A Mean Reversion OscillatorHello friends. Time for us to blow your minds for the Nth time. Goldman Sach's VS US Money Supply Is A Mean Reversion Oscillator For Risk Assets. What do we mean?
Let's first start with what Goldman Sach's is. They are an American multinational investment bank and financial services company. Since they are perpetually invested into the markets, their stock naturally flows with the waves of risk assets just like most other stocks do.
Charted alone, their stock is not very interesting at all. Charted against the supply of the US dollar, it becomes far more interesting indeed. You see, it has not left the range it currently trades within since the Global Financial Crisis. Every time their stock becomes overvalued in comparison to the amount of dollars that exist, it ends up crashing down. Every time their stock becomes undervalued in comparison to the amount of dollars, it ends up pumping.
We are currently in the "Dead Zone". That means we can definitively say that Risk Assets are not cheap, but they also are notably not expensive either. Another thing we could say is that Risk Assets are in fact more cheap than they are expensive. This is to say that if risk were to rise to the "Expensive" band once again, it would appreciate by 58% wheras if risk were to fall down to the "Cheap" band again, it would only fall by 27%. This could be an argument for buying risk assets, but in reality it's not usually wise to trade in the middle of a range. Intelligent traders will wait to buy support and sell resistance rather than messing around in the middle where anything can happen.
We think that the odds favor risk falling another 27% over the next few years and tapping the cheap zone. From there we could see very wealthy investors start to prop up the markets, and eventually the prices can rally back into the expensive zone. Long term and patient investors can easily profit from this, but pigs will get slaughtered as always.

Goldman Sachs Playing The Weekly Bullish Reversal PatternIn this update we review the recent price action in Goldman Sachs and identify the next high probability trading pattern and price objectives to target

Goldman Sachs Fib ConfluenceIn this update we review the recent price action in Goldman Sachs and identify the next high probability trading opportunities and price objectives to target

Goldman breaks supports Follow up to October 2021 post. Goldman has now given up supports and used them as resistance.

GS To Rise In Value?Good Day To The Investing World
Goldman Sachs has a bullish future, and its clear to see why. The graph shows us that the long entry is larger than the short entry, showing the value is increasing. Second, with US stocks going up in value, and the US Economy recovering from the big hit of increased interest rates, Goldman Sachs will almost very likely treat it as an opportunity. Lastly, the lines on the graph, which shows us that GS's high and low are both going upwards.
As always, read the graph if your opinion differs!

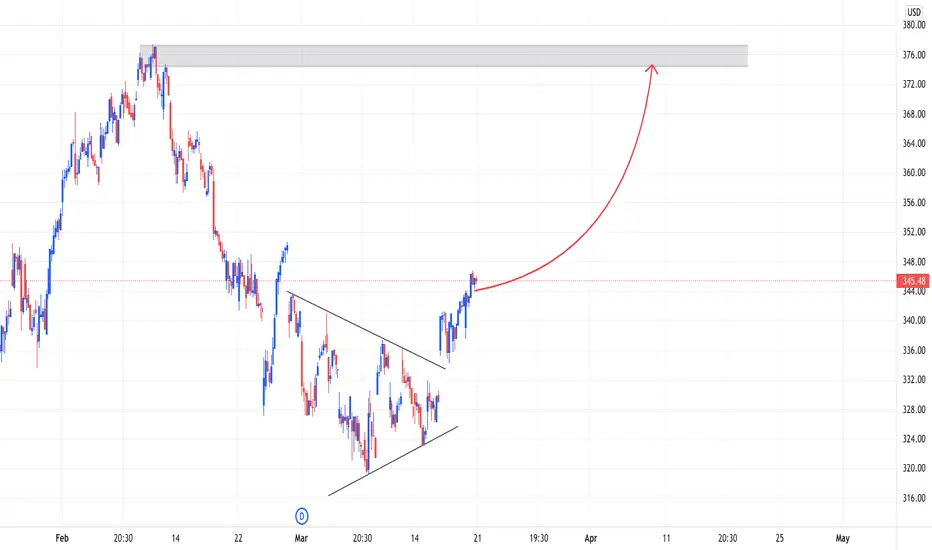
Falling Wedge- Bullish - UpdateJust posting a quick update here as GS has gotten beaten down as the broader markets pulled back but has seemingly found some support after reclaiming its 20-Day SMA. GS is lagging the XLF at the moment, however, looks to be setting up nicely for a big breakout. GS is holding within a nice falling wedge on the daily timeframe accompanied with some bullish hidden divergence on the RSI. Additionally, Bullish Gartley harmonic pattern on the 4-Hour timeframe along with Bollinger bands are squeezing, and a golden cross on the MACD to top it off (See Attached Chart Below). Bullish and will be looking for a breakout from this wedge (Broader Market Conditions Permitting). Just some support and resistance levels to watch along with some RSI-based supply and demand zones to keep an eye on in the meantime- Price Targets & Previous charts are attached below
PT1- $314.20
PT2- $323.73
PT3- $329.81
PT4- $337.64 + Gap Fill
--4-Hour Timeframe--
--Previously Charted--

GS Fibonacci Circle Price Positions There are two positions we are either in
The white rectangle which is the beginning of a rejection pattern along the circle, or a green circle which is a bullish pattern that finds support on the circle
I am leaning more towards the green circle position (bullish state) due to the position price being quite highly above the circle and it is more comparable to the green circle on the yellow fib ring
Being above the green trend line adds to this bullish assumption
This is the Weekly chart for GS (Goldman Sachs)

Long GS GS down into my early target areas on the short from the high. Buying 76 fib. Out if it breaks.

Goldman Sachs Watching For Bids at $280In the is update we review the recent price action in Goldman Sachs and identify the next high probability trading strategy and price objectives to target

Goldman Sachs Group BeatsGoldman Sachs Group (GS) reported 1st Quarter March 2021 earnings of $18.60 per share on revenue of $17.7 billion. The consensus earnings estimate was $9.79 per share on revenue of $11.7 billion.
R3 = $358.31
R2 = $348.85
R1 = $338.72
pivot = $328.58
S1 = $319.13
S2 = $308.99
S3 = $300.21
Do your own due diligence, your risk is 100% your responsibility. This is for educational and entertainment purposes only. You win some or you learn some. Consider being charitable with some of your profit to help humankind. Good luck and happy trading friends...
*3x lucky 7s of trading*
7pt Trading compass:
Price action, entry/exit
Volume average/direction
Trend, patterns, momentum
Newsworthy current events
Revenue
Earnings
Balance sheet
7 Common mistakes:
+5% portfolio trades, capital risk management
Beware of analysts motives
Emotions & Opinions
FOMO : bad timing
Lack of planning & discipline
Forgetting restraint
Obdurate repetitive errors, no adaptation
7 Important tools:
Trading View app!, Brokerage UI
Accurate indicators & settings
Wide screen monitor/s
Trading log (pencil & graph paper)
Big organized desk
Reading books, playing chess
Sorted watch-list
Checkout my indicators:
Fibonacci VIP - volume
Fibonacci MA7 - price
pi RSI - trend momentum
TTC - trend channel
AlertiT - notification
www.tradingview.com

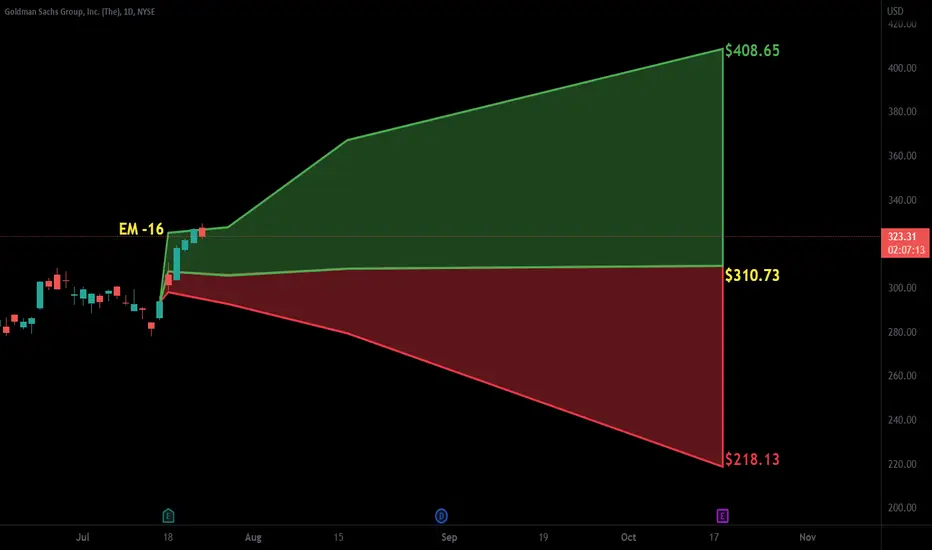
Expected Key Points Goldman Sachs 12 May 2022Godman Sachs 12 May 2022
The current implied volatility is at 46.4%/year
So that converted into daily is 2.92%
The close of yesterday was 301.55
So based on that our channel for today is going to be compressed within
TOP 310.5
BOT 282.5
with a probability chance of 78.2% based on the last 3007 candles
From fundamental point, today we have
PPI and initial jobless claims releases and these mark a huge volatility moment
At the same time the current values are expected to be bearish.

GS has great upside with PB 1.08I believe that $GS is a great opportunity to buy at this levels, their PB ratio is 1.08 which is one of the best ratios compared to other American banks at this point. They are one if not the largest investment banks in the world and they are also paying a 2.58% dividend yield. Combine that with the rising rates that will give even better margins and I truly believe its a great long term buy from this levels. I am thinking of opening a substantial position at this point and looking forward to hear your thoughts on that.


$GS with a Neutral outlook following its earnings #Stocks The PEAD projected a Neutral outlook for $GS after a Negative over reaction following its earnings release placing the stock in drift C with an expected accuracy of 66.67%.
GSHello everyone, the price is at an interesting number of 319.49
If it bounces from it down, we find it at the following levels
283
251.45
We find a strong support area at (251.45 and 239.43)
Done if we ascend we find at
338.91
373.76

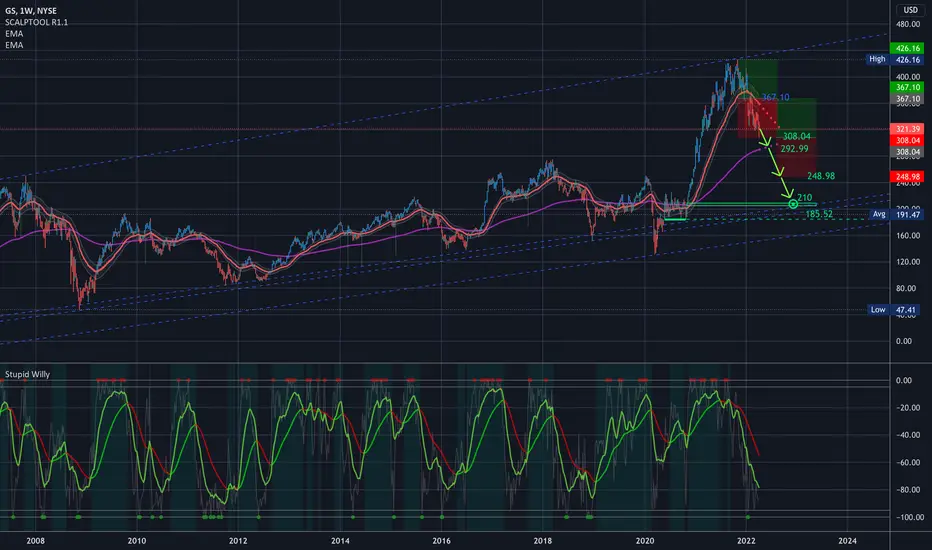
$GS Goldman Sachs - Key Levels, Analysis, & Targets$GS Goldman Sachs - Key Levels, Analysis, & Targets
This is a very long view, taking GS from the bottom of 2008 until today…. I’m expecting another 35% drawdown from here, but not necessarily by the end of the year which I have pictured… I was just running out of room so I didn’t want to push it further out.
I’d say by the end of 2023.
Around 210 I’d be comfortable truly going long again. Until then, it’s trader country.
Every target is a good target to add for a swing, and personally, I’m just going to continue selling puts at the bottom of the expected range until we’re at least under the 250 level.
Trade setup
1 at 308.04
1 at 292.99
2 at 248.98
4 at 210
8 at 185.52
(Then multiply by your multiplier (x5, x10, x100, x1000, etc to find your position size)
---
I am not your financial advisor. Watch my setups first before you jump in (or go back and review my past setups)… My trade set ups work very well and they are for my personal reference and if you decide to trade them you do so at your own risk. I will gladly answer questions to the best of my knowledge but ultimately the risk is on you. I will update targets as needed.
GL and happy trading.
IF you need anything analyzed Technically just comment with the Ticker and I’ll do it as soon as possible…
GS | GuidanceJournal Entry
Bias: Positive.
Sentiment: Optimistic.
Emoji (emotion): Energized🔋.
Null Hypothesis: Buy.
Alternative Hypothesis: Sell.
Signals: ...
Position: Short term day trade.
Notes: ...
Barron's Company Overview: www.barrons.com .
Other: ...
Tutorial: (Q/A) What exactly is the box labeled tolerance? The box labeled tolerance is a defined range of value & time that qualifies the right to exit the trade after a profit is made; as long as the security is inside the box and above the trade's entry one could say the profit is within tolerance, likewise if the security is outside the box either because of value or time one could say the profit is not within tolerance. It's a way to add parameters to the future outcome (as a means to grade the journal entry) while simultaneously providing leniency in the ability to achieve success with said journal entry.
About the Security: "Goldman Sachs Group, Inc. engages in global investment banking, securities, and investment management, which provides financial services. It operates through the following business segments: Investment Banking, Global Markets, Asset Management, and Consumer & Wealth Management. The Investment Banking segment serves public and private sector clients around the world and provides financial advisory services, helping companies raise capital to strengthen and grow their businesses and provide financing to corporate clients. The Global Markets segment serves its clients who buy and sell financial products, funding and managing risk. The Asset Management segment provides investment services to help clients preserve and grow their financial assets. The Consumer & Wealth Management segment helps clients to achieve their individual financial goals by providing wealth advisory and banking services. The company was founded by Marcus Goldman in 1869 and is headquartered in New York, NY."
Social: I'm happy to hear from my readers/audience and I encourage constructive feedback; although I'm busy I will give my best effort to reply. I do strive to build an esteemed reputation and plentiful following, I also strive to earn the title as a Tradingview pinescript Wizard and Top Author.
About the Author: I'm a financial scientist and my contributions offered to the community are apart of my scientific journal or goodwill to mankind. With that said I think it's prudent to make two things clear; (1) I'm not a Wall Street retailer, I'm not trying to sell you products or services (2) I'm not a Wall Street advertiser, I'm not trying to market the purchase of securities to you.
Disclaimer: My journal entry is not a complete prospectus, please consider it accordingly.


GS: Bullish RSI DivergenceDivergence between the current price chart and RSI. Even MACD putting lower lows

GSGoldman Sachs GS . 1H
A symmetrical triangle breakout with positive momentum (breakout gap) and a retest.
Expected target level of 355 riyals..
* Technical analysis and not a direct recommendation..