GlaxoSmithKline ShortShort from $42.01.
- Market Cap: $102B
- Beta: 0.83
- P/B: 20.42
- GSK’s consumer healthcare segment sales were down in 2017 due to a slowdown in global growth of its key consumer categories.
- They have also faced pricing pressure from competition and slow down in emerging markets. Although GSK have several candidates in different stages of development, the company has been set back on numerous occasions by the regulators. The largest setbacks in the past few quarters include the phase 3 data on chronic coronary heart disease, Duchenne muscular dystrophy candidate, kydrisa failing to meet the primary end point in a phase 3 study.
- The company phases massive competition from small start-ups to large pharmaceutical corporations. There consumer healthcare segment faces competition from big companies like Johnson & Johnson, Colgate Palmolive, Procter & Gamble and Pfizer.
- Advair, one of GSK’s largest revenue providers is facing intense competition in the asthma and COPD market from AstraZeneca and Merck respiratory drugs.
NeroTree Capital rates GlaxoSmithKline PLC as a SELL with a price target of $38.
GSKD trade ideas

Looking for an entry for GSK; expecting a 2% dropI'm long in the long-run, short in the short run. The RSI on the longer term chart shows we're a bit overbought, and history tells us this results in a ~2% correction. We're seeing divergances where we'd expect them to confirm that. A nice coincidence is that the 37.4 target for a 2% drop is also a good support line.
Wait for a confirmation of a bounce around 37.4 and buy.

Glaxo ShortPrice has tested 1380 numerous times which can be seen with the long wicks testing and rejecting this level.
There is RSI Divergence also which shows weakness in the price, sell a break of the counter trend and target the lows.
Alternatively set an alert just above 1380 if the price breaks and closes above this level it would be a strong buy signal.

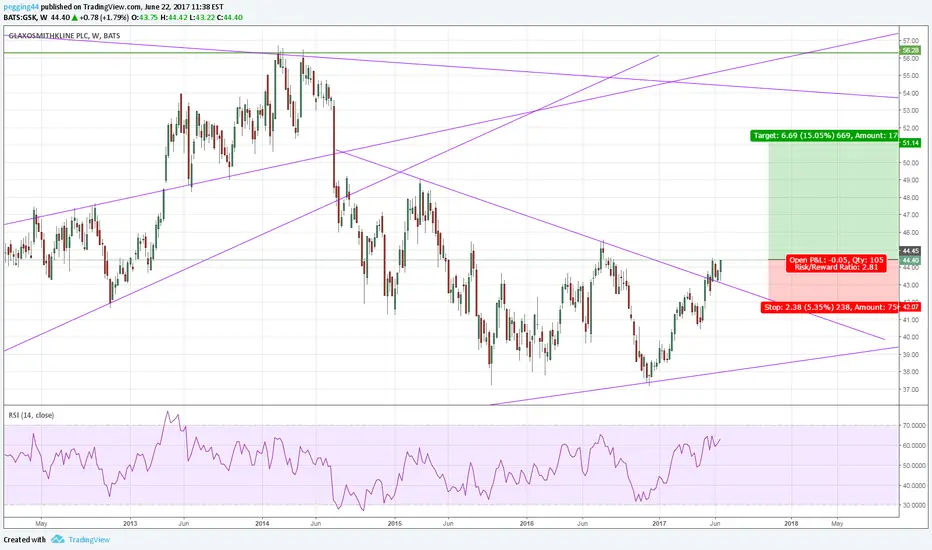
GlaxoSmithKline ~ Long Swing TradeSigns of an uptrend following the bearish run.
Hold till resistance level/overbought RSI/signs of bearish reversal
Place stop loss at 1264
Ris/reward ratio: 4

GSK on a critical supportGSK is currently rebounding on its 1270 - 1300 support. The stock has drawn a double bottom in monthly consolidated on the historical support of the 1000 pences. In April 2013, the neckline of the double bottom was broken but directly followed by a pullback on the 1270-130 level. We think it is now the good time to have the validation of the double bottom and a bullish increase to the 1500 level first and then the 2100 level. We need to be careful with the possible double top drawn between 2013 an now, in case this one is validated we will use the 1000 pences support as backup scenario.

Lock In A 5.88% DivividendIt looks like IF you Buy GSK , and wait for $36.07 = You can Hold it for a lifetime.


GSK: I spy with my little eye .. [possible trend change]It was Aug 1 and I was looking through the various constituents of my watchlist and I came to GSK on the FTSE. GSK has been trending down since Jun 22 and I was looking to see how that trend was developing. What I saw caught my attention. The last candle in what was looking to be a fairly well established downtrend was a doji . Dojis are usually interpreted as something like 'market indecision' or 'the mother-of-all-battles between buyers and sellers ending in a draw'. However dojis are fairly commonplace in charting so it could just be a sign that the market was 'taking a breather'.
The candle put up today is a possible gamechanger, I believe. It is another doji which in itself is nothing 'special'. However a "double doji" is considered to be fairly rare and has a reasonably good chance of preceding a fairly large change in the price of the share. So here's a fairly spartan chart showing GSK and the idea I believe could be about to play out. It goes something like this:
= Jun 22: A downtrend starts that goes on to establish itself for over a month
= Jul 27: a hammer forms which could be taken as a signal that a trend change could be about to happen. The low of this hammer candlestick is 1517.0 . The downtrend continues.
= Jul 28: A shaven top marubozu forms with a low of 1513.5 and a close of 1518.5
= Aug 1: the first doji forms with an open and close price of 1516.5
= Aug 2 (today): the second doji forms with an open price of 1516.0 and a close price of 1517.0
So there are four seperate candlesticks pointing towards a possible trend change and all seeming to show close S.P.s in the range of 1516.5 - 1518.0 . This is the "bounce" point/zone, I believe. The market is currently showing that it does not want to push the S.P. any lower than 1516.5 - 1518.0 and so this price range could possibly be "the floor" for the S.P.
The second indicator I'm using is stochastics with a setting of %k=5, %d=5 and smoothing=2. This is a setting I saw used on a webinar (by Barry Burns) and seems to be fairly credible. Now if you look at the last few days you can see that %k/%d has been "strengthening" with the last three days showing ratios of 2.9/6.8 , 4.8/5.4 and 16.4/8.1. This, I believe, shows that the strong selling pressure is slowing down. Traders are still selling GSK but not selling it as "eagerly" as before. The last ratio, 16.4/8.1, shows that buying pressure could build up faster than selling pressure and so the direction of S.P. travel should/may change.
So this all points to a pretty strong "Buy" signal, I believe.
Safety first! The lowest S.P. reached by the double doji couplet is 1508.0, so set a stop loss at least 1p down on that at 1507.0. With the current S.P. showing as 1517.0 that risks 10p/share.
Now the upside. As this potential trend change is in response to the downtrend that started on Jun 22 I've drawn the 0%-100% between the close on Jun 22 and the open/close of today. That forms the fib retrace levels labelled on the right of the chart. You can see that there is a 38.2% (major?) retrace level at 1595.1. The top trendline shows an S.P. for today of (around) 1592 so very close to the 38.2% retrace level.
Working with all this I'm going for a strong "Buy" with a trailing stop initially of 10p and a first target of 1595.1. This gives a potential reward of 78p, so I think this works out a a risk/reward ratio of 10/78.

GSK - Resilience of Pharmaceutical Stocks Despite ObamacareSince our last bullish outlook on the pharmeceutical sector, Revelation Trading feels that this is one stock to look out for. Though it has caused a slight dent, the failure of Congress to repeal and replace Obamacare has not caused the pharmaceutical stocks in our radar to tumble. In fact, they have held their well defined ranges. That to us, is strength.
Also, with reference to our post on 24th Jun, the NBI 0.00% has also been maintaining its upward momentum. Thus Revelation Trading concludes that apart from the media sensationalising the failure to replace Obamacare, there is no change to our analysis on the sector.
With regards to GSK 0.26% , we are looking for actionable ideas above 43 with an initial stop loss established at 40, targeting 45.50 and above.

GSK preparing for one last puff of the cigar before rotationA few week duration Long here.
GSK seems to be hitting symmetry in the last timeframe.
There's some remaining price structure to balance out from the 37 levels.
The market knows 37 it can find buyers, it doesn't know 2x as far away at 45.50 if it can find sellers again.
I believe it needs to see 45.50 before it can test the VPOC lower or move lower back to 37 and even lower possibly.
I see "thick enough" volume up near 42-43 to get one last puff on the cigar before it tops out near 45.50 and rotates lower.
It's not overwhelmingly a "P" shape volume profile, so I'm not expecting anything near 48 or higher unless volume suddenly rushes in to accept a 43 VPOC.
It's a nice 3.1x : 1 Reward ratio for this trade with a stop behind the Low vol node in Pink line to the left.
Theory is that the LVN is an unfair price range and market will reject it in the future causing it to advertise higher prices into symmetry at 45.50 until it attracts sellers.
IMO, there's nothing wrong with this company, it's all the Brexit stuff that is causing the rotations and lower re-valuations. Regardless, the market actively value GSK correctly with all the Brexit math, and I want to read where it finds value and trade the edges of those parameters..

Major pharma Co's struggle after Obamacare repeal delayLooking for more bearish price action moving forward after the latest delays, may see wave lows tested on the daily charts.

During market tomorrow earnings from #GSK #FTSE100 #UKSHARESobviously this will depend on the results but healthcare has been performing badly of late (Trump), and shares may be pressured


UK GLAXOSMITHKLINE, H4, LongPrice remove last 'peak' from left up moves and creating new wave up. I will wait on potential retracemnet arount to FIBO 61.8.

Long $GSKNice setup, down side is limited, it's in monthly range of 60-30, downside is limited, Buy bottom of the range, a potential breakout to the upside will go over 100...

GSK only falling in a corrective patternOn the hourly timeframe, the decline in GSK beginning in Aug 2016 can't be counted as an impulse for sure.
Maybe it's a leading diagonal that I'm not seeing, but I believe probabilities are best interpreted as a WXY pattern as labeled.
Which implies it is a 2nd X wave down in a larger WXY (Ending Diagonal) pattern depending on how you interpret the Feb lows.
I anticipate the potential for a Bullish reversal at the Red Oval 41.21 ending in 5 waves down for leg c of y of X.
My plan is to catch it on the way up if divergence exists, or late on positive reversal first pullback with a Lower Blue descending trendline break.
Long trade up into the Green Oval near 46.50.
Initial stop below wherever the c leg terminates near 41.27.
Duration on this is probably into Jan of 2017.

Glaxo bears run out of energy??Shameless pun, the bulls seem to be back in control after a retrace to the 61.8% coming off a break of key weekly support a pull back to the upwards trend line could present good long term up targets on GSK to 1800s again

Glaxosmithkline a bullish move awaiting tomorrows earnings?It might seem as a gamble especially that the earnings are scheduled for tomorrow, but there are some convenient technical points to be taken into consideration:
1) Down Trendline broken:
2) EMA 50 Crossed above EMA 200
3) The Market Broke above a resistance now support at 43.50$, rallied a bit and now hovering around it;
4) Stop loss level around 43.40$, compared to a take profit of 45.50$;
Inconvenient points:
1) Bearish divergences on the RSI and MACD;
2) MACD Turning negative;

GSKL flag patternthis pattern is developing after 2 weekly resistance breakouts, so I am really interested and I see lot of room for next move up.

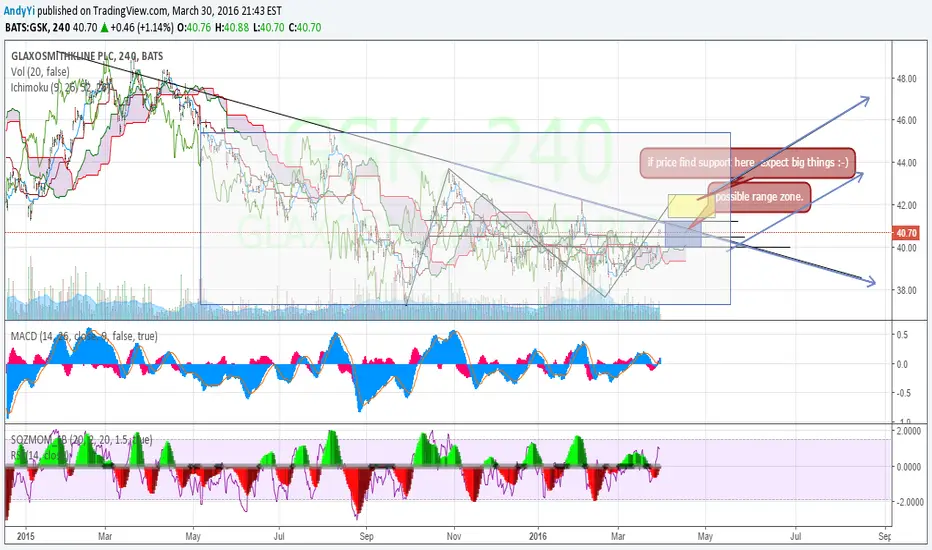
GSK Range bound for now....but price wants up!notes on chart. GSK bearish trend for a long time now. Looks like it is ready to make some movements higher.
Risk is high because it has been consolidating for a long time. --Not to long or short until further confirmation how price will react at downtrend line is very critical. could have a nice spike up.
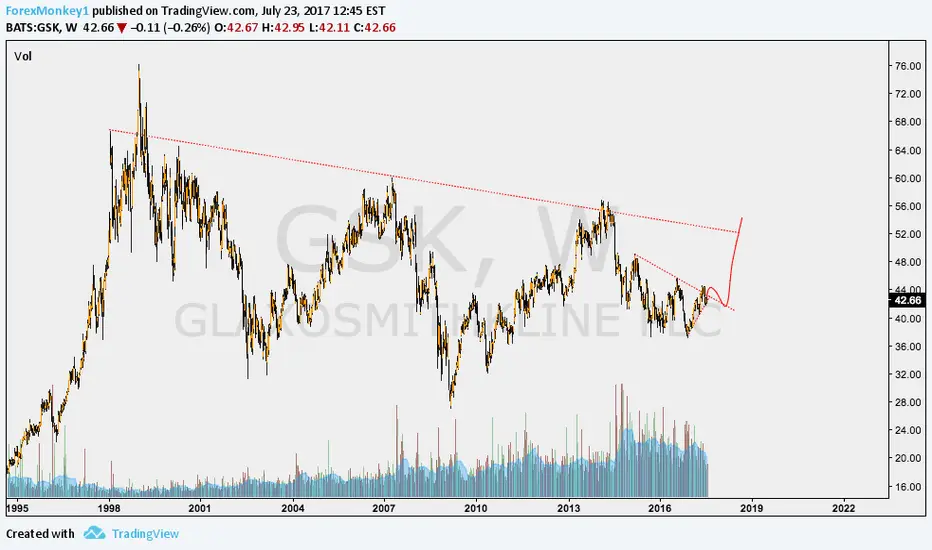
GSK, big move brewingGSK has been in consolidation since it topped up on Jan 1999
i reckon big move is brewing just like the lava is boiling to be oozed out of a volcano ^_^
Note: there is a scary HS pattern in orange box, if price fall below 37.50, then my bullish bias will
be wrong
