Home Depot (NYSE: $HD) Breaks 0.5 Fibonacci Range! 👀The Home Depot, Inc. operates as a home improvement retailer. It operates The Home Depot stores that sell various building materials, home improvement products, lawn and garden products, and décor products, as well as facilities maintenance, repair, and operations products The company also offers installation services for flooring, cabinets and cabinet makeovers, countertops, furnaces and central air systems, and windows. In addition, it provides tool and equipment rental services. The company primarily serves homeowners; and professional renovators/remodelers, general contractors, maintenance professionals, handymen, property managers, building service contractors, and specialty tradesmen, such as electricians, plumbers, and painters. It also sells its products through websites, including homedepot.com; blinds.com, an online site for custom window coverings; and thecompanystore.com, an online site for textiles and décor products. As of December 31, 2021, the company operated 2,317 stores in the United States. The Home Depot, Inc. was incorporated in 1978 and is based in Atlanta, Georgia.
HD trade ideas

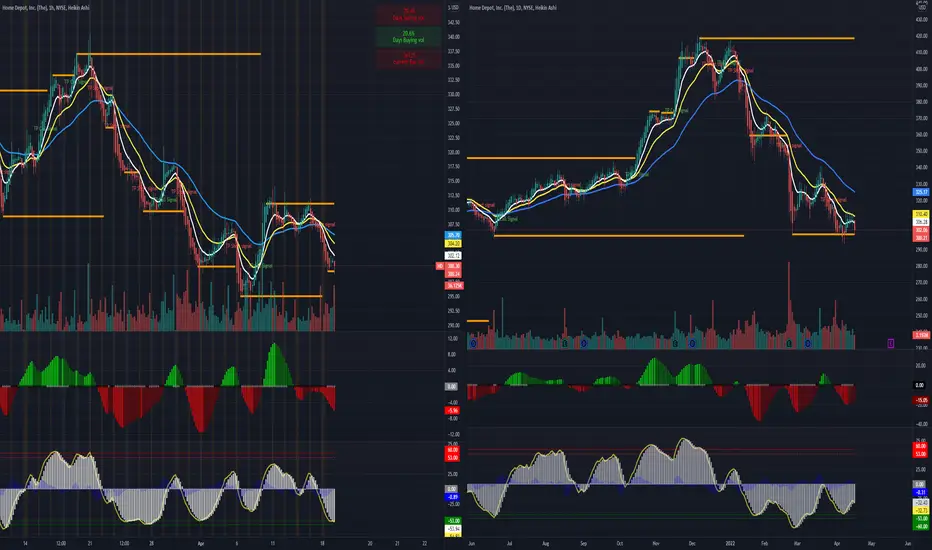
Low risk entry for HD swing putsPending home sales were lower than expected. HD will go down further, perhaps below 280, on the next selloff. The yellow bar on chart shows 300-302 resistance. White dot shows how high RSI is, which usually indicates a short term reversal as well (since this is 30min chart).
Considering how far price is away from 10/20MA's, and with 30min extreme RSI, I am buying puts for a short term reversal. Suggested stops are are partial exits between 302 and 303.50.

Bull or Bear??Do you feel it is time to pull back fish on HD?
Do you feel Bullish or Bearish about the market as a whole?
Are you buying dips or sitting out in cash?
Are you going Long or are you going Short on securities right now?
Are you tempted to buy the dip on your favorite stocks today? If you are, you may be a bull in a bear market.
But they always say in the long run, bulls will be okay. I do believe that but it is not my nature to watch my account go red while I wait. We are all different.
I see Wall street is still bullish on Home Depot. Short percent is very low at under 1%. There appears to be support trying to form under price, but will it be temporary?
It would seem it is against the odds that HD will fall. But is it? The chart says Yes, it will fall. Wall street says No and I see many analysts calling HD a strong buy.
There is a large structure at the top, and it looks like a head and shoulders or an ugly top. You may see it differently. Price is under the neckline. H&S tops are not valid until the neckline is broken as it serves as strong support while price is above it. The neckline becomes resistance after price falls below it. Folks who short this pattern often place their stop over the neckline and then trail the stop down if price continues to fall.
I love this stock. Am I bullish on much of anything right now? No
Would I buy the dip at this level? No but we are all different.
Will I buy the HD dip at a much lower level? Yes. I have alerts set and when I receive the text, I will re-evaluate.
Am I planning to jump off a building because SNAP missed earnings? NO (O:
I have wondered in the past why the stocks with the most gains can fall the most when we enter a bear market. I am guessing it is because there are more buyers in the more popular stocks than in the not so popular stocks. More buyers equals more sellers.
This is my first bear market since I started managing my accounts by myself. I have noted there are some securities folks are having trouble letting go of and they are holding on. HD may be one of those as this has been a slow decline.
Will they let go? I have noted when folks finally decide to let go, watch out below.
The impulse wave up for HD from the bottom, is very long.
No recommendation. Be safe//Laura

#SuakuFlowsWatchlist - 5/20/22#SuakuFlowsWatchlist
#LottoFriday 🎰
$HD C > 292.50 | P < 284.96
$LI C > 24.47 | P < 23.61
$NIO C > 16.89 | P < 15.79
Here're my levels that I'll be watching.
These are high risk 0DTEs! 🚨
Keep positions small and take profits quick.

Earnings watch 5/17Earnings watch 5/17:
ONON
SE
DOCS
QUIK
TCS
HD
KEYS
JD
WMT
LVLU
Do your own due diligence, your risk is 100% your responsibility. This is for educational and entertainment purposes only. You win some or you learn some. Consider being charitable with some of your profit to help humankind. Good luck and happy trading friends...
*3x lucky 7s of trading*
7pt Trading compass:
Price action, entry/exit
Volume average/direction
Trend, patterns, momentum
Newsworthy current events
Revenue
Earnings
Balance sheet
7 Common mistakes:
+5% portfolio trades, capital risk management
Beware of analyst's motives
Emotions & Opinions
FOMO : bad timing, the market is ruthless, be shrewd
Lack of planning & discipline
Forgetting restraint
Obdurate repetitive errors, no adaptation
7 Important tools:
Trading View app!, Brokerage UI
Accurate indicators & settings
Wide screen monitor/s
Trading log (pencil & graph paper)
Big, organized desk
Reading books, playing chess
Sorted watch-list
Checkout my indicators:
Fibonacci VIP - volume
Fibonacci MA7 - price
pi RSI - trend momentum
TTC - trend channel
AlertiT - notification
tickerTracker - MFI Oscillator
www.tradingview.com


HD out of consolidationSince April, HD has been trading sideways in between 315 and 300
Price finally picked a direction and pushed towards 280 , making the 300 level a strong resistance.
Last week we saw a first attempt to break above that resistance and failed, proving that it is a strong level (Also psychological level)
Watching to see which direction it will resolve. Maybe another retest of 300, if we get rejected again, could retest lows at 280.
If we push above and stay there, could once again move towards top of the channel at 315

$HD with a Bullish outlook following its earnings #Stocks The PEAD projected a Bullish outlook for $HD after a Positive over reaction following its earnings release placing the stock in drift B with an expected accuracy of 75%.

5/4/22 HDHome Depot, Inc. (The) ( NASDAQ:MSFT )
Sector: Retail Trade (Home Improvement Chains)
Market Capitalization: $325.831B
Current Price: $315.31
Breakout price: $319.40
Buy Zone (Top/Bottom Range): $313.75-$299.15
Price Target: $337.20-$340.60 (1st), $367.50-$372.80 (2nd)
Estimated Duration to Target: 42-44d (1st), 99-106d (2nd)
Contract of Interest: $HD 6/17/22 330c, $HD 7/15/22 340c
Trade price as of publish date: $7.06/contract, $6.60/contract

$HD Home Depot Bullish SharkPosted this one the other day, but wanted to follow up.
Clear impulsive wave down with a 1.13 Bullish shark to reverse momentum.
Reaction and confirmation low, with clear accumulation and a bullish engulfing candle on the 4HR here.
ADX & OBV bullishly diverging
Expanding volatility with a clear upside direction.
RSI nearing the control zone with the money flow and STOCH both coming up as well.

HD: Reversal H&S + Descending TriangleMain Pattern: Reversal H&S
Daily Pattern: Descending Confirmation Triangle
Short below 293

HD PUTS -I will be looking to play puts below 298.95 to recent lows
-Next I will be looking to get back in puts below 293.30

$HD bearish continuation? $HD slowly plunges since the beginning of this year. not much negatives news besides the overall supply chain issues and inflations. but the most reason why it took a dive is the short sellers.
there's been high percentage of short seller since the beginning of this year making $HD to a bearish mode until now. but the percentage of short seller starts to fade about 21% since march. but we still don't know
how many institution finish their shorts positions. In my opinion this is a good buying opportunity for long since its sitting in support line at 299.00 after its long rally.
HD average move per day is $5.00-7.00 per day.
Below is my ideal entry for day trading or scalp play.
HD: Day trade or scalp target play: 04/19/22
Buy call above 303.36 sell at 305.20 or above.
Buy puts below 297.19 sell at 295.17 or below.
option open interest: ideal expiration date: 5/20/22 6/17/22 8/19/22
Hello everyone,
welcome to this free technical analysis . ( mostly momentum play )
I am going to explain where I think this stock is going to go over the next day or week play and where I would look for trading opportunities
for day trades or scalp play.
If you have any questions or suggestions which stock I should analyze, please leave a comment below.
If you enjoyed this analysis, I would definitely appreciate it if you smash that LIKE button and maybe consider following my channel.
Thank you for stopping by and stay tune for more.
My technical analysis is not to be regarded as investment advice. but for general informational proposes onlY
HD SHORT -looking for a short down to 293.30
-as long as we can get a clear continuation down we will have an opportunity for puts
-Looking to enter after 1-2 candlestick confirmations


Home Depot Inflation killerHome Depot will and will always remain to be profitable and with the cost of goods increasing very quickly, well that just means sales will be through the roof and with the competitor being Lowes home improvement i don't think there's much to worry about.

HD - Tradable bounceHD formed a mini double bottom with bullish divergence seen between price and RSI.
THere is a fair chance of it rebound back towards it's recent high of 339. Whether it can break higher remains to be seen
Initial stop just below the recent low of 293.
Disclaimer: Just my 2 cents and not a trade advice. Kindly do your own due diligence and trade according to your own risk tolerance and don't forget that money management is important!

Trade Update: Close over yellow line breaks consolidationIf HD calls will work, I would like to see a quick move over the yellow line and over 310.

Changing Directions - Buy HD Swing Calls under 298I have to be fast with this one. Please see the chart indicators.
As I was describing in comments of my previous Swing Put post, you can recognize the Elliott wave pattern without knowing much about it. I only use the concept of 3- and 5-waves to make trading decisions.
Yellow dots show three waves down that complete a five wave pattern (3 down + 2 up). There should be a tradeable bounce after this. Also, red line indicates 3 waves down that match with the RSI-7 and stochastic %K dips (in green ovals).
Notice how RSI was much lower with the first two yellow dots, as compared to today. If price moves up tomorrow then this will be bullish divergence. Even if price goes a lower on Thursday RSI may still stay higher than the previous two drops.
Looking at Stochastic %D you can also see each yellow dot corresponds with a wave down. This is the third one below 20, which leads me to look for a counter move that will make a good trade. I have a very small position of 14Apr 300 calls and 13May 320 calls. If the idea does not work and HD goes below 295 I will exit with very little capital at risk.

HD - Long OpportunityI was looking at HD on 1h and found that price is at a cheap zone as per the ProTrader set up. Any retracement above 298 is opportunity to go long. It will attempt to reach marked levels. Let's see how it works out.

$HD slowly coming back up?$HD slowly coming back up after a long downward momentum similarly with $LOW. i personally don't know why it keeps going to downtrend with not much negative news. i believe the stock got over value and analyst tries to lower the price target to prevent the bubble to burst.
with the inflation and shortage going in the nation consumer is creating a panic buying creating a high supply and demand for retailers and might continue to happen for the past few weeks or months until the inflation subsides.
here's my personal take playing $HD
$HD: Day trade or scalp target play: 04/11/22
Buy call above 312.30 sell at 315.17 or above.
Buy puts below 307.92 sell at 34.16 or below.
option open interest: ideal expiration date: 4/22/22 , 5/06/22 or 5/20/22
Hello everyone,
welcome to this free technical analysis . ( mostly momentum play )
I am going to explain where I think this stock is going to go over the next day or week play and where I would look for trading opportunities
for day trades or scalp play.
If you have any questions or suggestions which stock I should analyze, please leave a comment below.
If you enjoyed this analysis, I would definitely appreciate it, if you smash that LIKE button and maybe consider following my channel.
Thank you for stopping by and stay tune for more.
My technical analysis is not to be regarded as investment advice. but for general informational proposes only

$Home depot is over sold Home Depot is oversold imo, beat earnings and price of goods are steadily going up from building a fence to a simple DYI project like tile or carpet... tools are more expensive especially the power tools and well in general home depot should outperform Lowes.

$HD Has A Falling Wedge With A Nice Support Below For BounceHome Depot has been hit hard lately and has been in a long falling wedge downtrend due to the most recent economic conditions. Looks like a small amount of support has been found around the $293 area for a nice bounce play. If Home Depot can hold up above the $293 area in the coming week then I think it has more room to run into the resistance area of $321 for a nice move to the upside.
