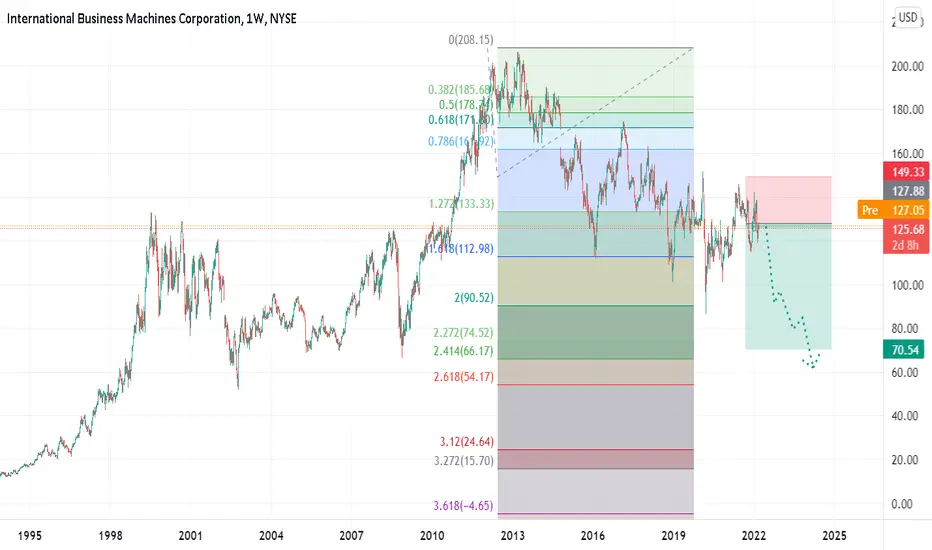
IBM AnalysisA bearish idea for IBM , showing a potential drop below the major trendline that has been established
it can be compared to a point in the past where price also went under the major trendline (in red) and took a steep drop
I'm not sure how far it could drop but under the major trendline we will consider it bearish for traders
IBM trade ideas

14/3/2022 NYSE (IBM)Short (Entry Price) within the sell zone area and exit (Stop Loss) above the red line. Can take profit at the suggested Target Price.
Entry Price: $123.79 / $124.95
Target Price: $121.99 / $123.13
Stop Loss: $126.77

IBM may be setting up a bear break. "IB who"?
Posting some IBM analysis mostly to remind you that up until 2011 IBM was the king of the stocks. IBM was most certainly "Going nowhere". And IBM are still in business - but the stock went somewhere. For those who think holding stocks that are industry leaders is risk free, I'd recommend you look up the top 20 stocks of 50 years ago and see how many of them are still performing today. Being in it for the long run does not give default success - over time, things cycle out of their bullish patterns and things that have been bullish for decades can be bearish for decades.
IBM Forecast and OutlookMonthly View
IBM is operating in a type of bull pennant on the monthly chart that has been building up since March of 2013.
I would have liked to see this break out, but unfortunately, owning to the current market circumstances, its probably not going to happen in the near future.
Tech is being hit hard with this current bear market and IBM has managed to retain an admirable amount of strength. But I think the market is catching up to it and we will see a, at least for the short term, bearishness.
Technical supports are charted in purple. The levels are:
1. 118
2. 112
3. 106
4. 101
Will it reach all of these levels? I am not actually sure, but I do anticipate some, at least short term, bearishness.
We have a flat top bearish candle formation on heikin ashi on the monthly chart as well which, looking at IBM historically, generally means at least another month of continuation downwards.
I was previously in a swing trade long position on IBM until I looked at the monthly chart. I closed out today for a small win because I anticipate IBM selling off.
I am not shorting it though.
I am bullish on IBM, I am just acknowledging the market and the chart.
As always, not financial advice.
Trade safe and feel free to leave your comments, thoughts, criticisms, etc. :)
Take care!

IBM with worldwire will grow exponentially. bullish.Bottom of bullish channel that goes back to the 1960's.
Broke out and retested supply line and resistance going back a decade.
Target 2K.

Gartley/BullishIBM seems to be in a Gartley pattern.
The final leg pull to the .786 and is labeled as D. The retracement leg, called AB pulls to the .618 or very close. Peak 2 is lower than peak 1 in the crooked M unlike a Bullish shark or a Bullish Cypher where peak 2 is higher than peak 1.
The structure is labeled XABCD. Possible stop below D or where you see support.
No recommendation/Gap top overhead so resistance possible/red dashed line. Look left for the gap.
IBM has made it past the bottom of the gap which can now be support.
Look in the rearview mirror in multiple time frames and also good to lookup and down and all around (o:

IBM is sued for age discrimination by widow of ousted workerHundreds of former IBM employees are suing for age discrimination
Widow Denise Lohnn is suing on behalf of her late husband Jorgen, who killed himself after being fired from the firm in 2016, when he was 57
A company executive allegedly referred to older employees as 'dinobabies' that should be an 'extinct species' in an email quoted in court filings
Another said the company's 'dated maternal workforce' was something that 'must change' , writing that they were 'Not digital natives. A real threat for us'
A spokesperson denied that IBM engaged in mass age discrimination, noting that 37 percent of the company's new hired since 2010 were over the age of 40
The median age of the company's employees was 48 in 2020, the company said in a statement, unchanged since 2010
But IBM had fired as many as 100,000 older employees in 2019, according to a court deposition from Alan Wild, former vice president of human resources
Between 2013 and 2018, according to ProPublica, older employees accounted for 60 percent of job cuts

IBM update Not every organisation has the same appetite to adopt new technologies, which may hold them back, according to Visvanathan. “IBM recognises that people have legacy. The answer is not about pushing new technology down their throat,” he says.
“The reason we bought Red Hat is to give customers choice, to wrap an architecture around legacy IT,” he adds. In IBM’s vision of this architecture, “it only needs to be built once and can be deployed anywhere, across multiple cloud environments”.
It used to be the case that people could be sure they would not get fired for buying from IBM – but IBM is no longer the only option for IT leaders looking to build a secure and resilient IT architecture. There are a number of IT suppliers associated with a culture of innovation, and these are often used to stimulate innovation in IT departments.

IBM's Sustainability Accelerator ProgramLatinX have high participation in weather-exposed industries, such as construction and agriculture, which are especially vulnerable to extreme temperatures. With that same two °C temperature increase due to global warming, LatinX individuals are 43% more likely to currently live in areas with the highest projected decrease in labor hours due to extreme temperatures.
Globally, disasters related to weather, climate or water hazard caused 2 million deaths and US$ 3.64 trillion in losses between the 1970s and 2019. Research published in 2021 in the Journal Nature Climate Change used machine learning to analyze and map more than 100,000 studies of events that could be linked to global warming. Researchers paired the analysis with a well-established data set of temperature and precipitation shifts caused by fossil fuel use and other sources of carbon emissions. Aside from the critical finding that despite existing pledges, the planet is on track to heat up about 2.7 degrees Celsius (4.9 degrees Fahrenheit) by the end of the century, the researchers identified an immense gap in studies. For example, fewer than 10,000 studies looked at climate change's effect on Africa, and about half as many focused on South America. By contrast, roughly 30,000 published papers examined climate impacts in North America.


IBM on the rise (don't mind the past). IBMImmediate targets 142, 149, 153. Invalidation at 114.
We are not in the business of getting every prediction right, no one ever does and that is not the aim of the game. The Fibonacci targets are highlighted in purple with invalidation in red. Fibonacci goals, it is prudent to suggest, are nothing more than mere fractally evident and therefore statistically likely levels that the market will go to. Having said that, the market will always do what it wants and always has a mind of its own. Therefore, none of this is financial advice, so do your own research and rely only on your own analysis. Trading is a true one man sport. Good luck out there and stay safe

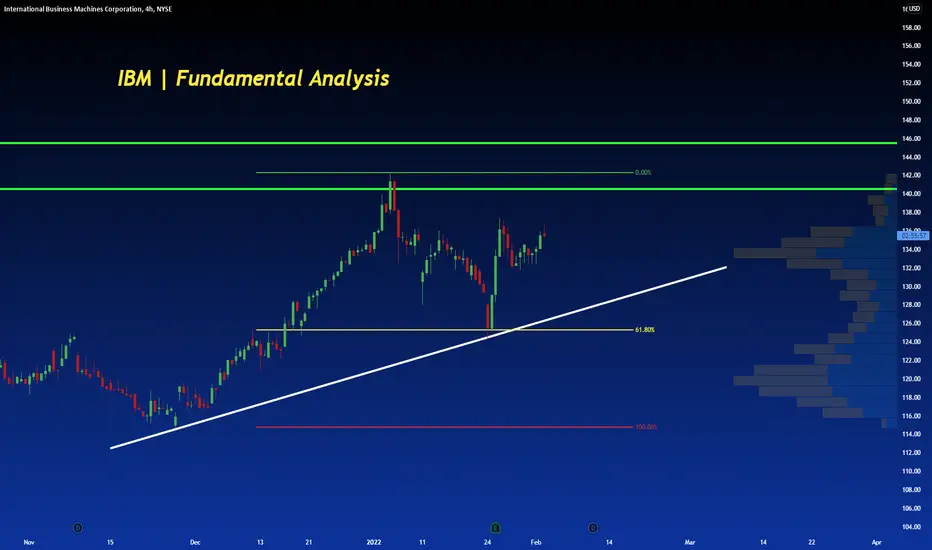
IBM | Fundamental Analysis | LONG International Business Machines turned in a positive direction after its first quarterly earnings report following the spinoff of Kyndryl Holdings. After regularly underperforming earnings growth in past quarters, the company delivered on its promise to deliver "single-digit" earnings growth.
The tech giant has endured years of struggle trying to transform itself into a cloud company, and it took nearly two years under CEO Arvind Krishna. Now that the company is more efficient, with a renewed focus, the question for investors is, can IBM outperform the market over the next few years?
IBM started its new future much stronger, reporting Q4 income from continuing operations of $16.7 billion. That figure, which sets off what is now Kyndryl's business from numbers from a year ago, was a 6.5 percent increase over the year-ago quarter. The software and consulting segments lead the way, increasing revenues by 8% and 13%, respectively, for the period. In addition, hybrid cloud revenue across all segments totaled $6.2 billion, up 16% from last year.
Further, in the earnings report, this led to the net income in Q4 of $2.3 billion, a 72% increase over last year's quarter. Expenses were down 25% to $6.6 billion, primarily due to lower sales and marketing expenses, as well as general and administrative expenses. Although the company paid $407 million in income taxes during the quarter, compared with $175 million in tax credits in Q4 2020, this did little to offset the savings in operating expenses.
IBM offered no estimates. However, for the fiscal year 2022, analysts are projecting a 6% increase in revenue and 24% consensus earnings growth, indicating a long-term continuation of Q4 performance.
IBM's free cash flow, on the other hand, reflects some adjustments given that Kyndryl is now out of the picture. IBM reported a free cash flow of $6.5 billion for the fiscal year 2021 or $7.9 billion excluding expenses related to the Kyndryl spinoff. That's significantly less than the $10.8 billion in free cash flow in 2020. It's also close to the $5.9 billion IBM spent on dividends in 2021.
Nonetheless, free cash flow should increase with earnings growth, and spinoff costs will be left behind. The company is projecting $35 billion in combined free cash flow between 2022 and 2024, slightly higher on average than before the spinoff. In addition, with a 4.8 percent yield and a 26-year history of payout increases, an annual dividend of $6.56 per share should continue to make IBM stock attractive to income investors.
In its 111-year history, IBM has transformed itself several times. Now that the company has spun off its former managed infrastructure business, it has become primarily a cloud company. The software and consulting segments combined, which accounted for about 70% of the company's Q4 revenue, accounted for much of the company's growth.
What's more, after buying Red Hat, the company became a leader in hybrid cloud, a cloud environment that allows public and private clouds to run seamlessly. IBM is far from the only company involved in the hybrid cloud. Nevertheless, Mordor Intelligence predicts a compound annual growth rate (CAGR) of 21% in this segment through 2026, raising the possibility that hybrid cloud will continue to drive significant revenue growth for IBM.
This broad-based growth contrasts sharply with the fourth quarter of 2020. All of the company's segments reported declining revenues this quarter, with the only double-digit growth coming from cloud revenue in the company's two segments. In addition, the segment that ran what is now Kyndryl accounted for 32% of the company's revenue at the time, not counting the infrastructure business, which is still owned by IBM.
Indeed, IBM still runs the infrastructure segment, which showed flat growth in the last quarter. But because that segment only accounts for 26% of the company's revenue, it didn't have as much of an impact on its financial performance, which contributes to IBM's reputation as a cloud company. Strong revenue growth in the software and consulting divisions more than offset weak infrastructure performance.
Although predicting the future may present unexpected challenges, IBM seems poised to outperform the market over the next few years. After the Kyndryl spinoff and significant growth in the software and consulting segments, IBM is growing again and must meet its revenue and cash flow projections.
Admittedly, some growth-seeking investors may continue to ignore IBM in favor of smaller, faster-growing technology stocks. Nevertheless, for shareholders looking for solid growth and a steady stream of earnings, IBM seems poised for a long-awaited comeback.
IBMfor a school project
Im using this space to fill up the description box
this is for coach balls 2nd period economics class

Long IBM @ 136.05. Fractal breakout.IBM crossed the last daily fractal of 136.05 today. The Alligator's mouth is closed in both daily and weekly charts.
Price has been above and around the weekly teeth, which could mean the beginning of a weekly wave c.
Adding on any other signals. Stop loss is close below the daily teeth.

IBM on 4 Hour Popping Cloud Continuation from YesterdayShould be hitting the white BB from the Weekly. You should see price interact with Orange BB on both sides meaning hitting resistance and then passing it and making it support. This is seen through one of our member only indicators where it combines 4 time frames Bollinger Bands so you can see different levels of support and resistance once it breaks your current time frames BB. This is based on an ideology I came up with that once Price Breaks out of a BB its not just floating in space. As all time frames are fractal in nature. meaning what is out of the BB on one Timeframe is actually just a normal move inside the BB on a larger timeframe. This move should make it to the white BB which would make this trade a 1 to 2 risk to reward.

IBM on the 1 hr popping the cloud meets all criteria easy $300We had a poppin of the cloud on IBM on the 1 hour with a 4hr Verifacation of Green candles. There was a link to the previous high and dip with Current indicator candle having significant retracement to one of these levels. We had the indicator candle. And we had a break of the last previous high. All things checked took the trade for an easy $300 same day. Option Call. Stay Tuned I believe there is more to come from this stock on a longer time frame. I will link it to this post.
by iCantw84it
11/25/22

I like this long term chart.I like this long term chart. New CEO and they dumped the legacy non growth assets kyndryl Trading at 13 times 22 earnings?

LongThe stock is showing growth after the positive report. I expect to enter the position the next day at a breakdown of 133.50 with confirmation. Target: $150 per share. 13% upside.
❤️ If you find this helpful and want more FREE forecasts in TradingView
. . . . . Please show your support back,
. . . . . . . . Hit the 👍 LIKE button,
. . . . . . . . . . . Drop some feedback below in the comment!
❤️ Your Support is very much 🙏 appreciated!❤️
💎 Want us to help you become a better Stock trader?
Now, It's your turn!
Be sure to leave a comment let us know how do you see this opportunity and forecast.

IBM earnings todayIBM expected to report its Q4 earnings of $3.39 per share, a 60% YoY growth, from $2.07 per share seen in the same period a year ago.
Taking into consideration also the 14K Calls and less than 1K Puts from last Friday, i think that $136 should be the price target.
looking forward to read your opinion about it.

**IBM*** Putspreadi am short IBM Via Long Put spread 132/120 for Jan28th expiry for .99c will update more trade details when market slows down

IBM : Looks bearish with the confluence of both harmonic Confluence of both harmonic pattern and and Macro bullish wedge of which is not yet completed. The anticipated sell off is about to complete a third torch to the lower trendline of the pattern.

Support/Resistance great example something that interests me, great example how resistance becomes support, not into waiting 10years for it to change tho, just a good real world example

IBM - Tremendous bullrun aheadWelcome my dear subscribers to my analysis featuring IBM! NYSE:IBM
Over the last few weeks me and my colleague had plenty of time to check up on our investments and plan our strategy for 2022.
We invested in IBM in the past because it formed very large and solid Wave 1 / Wave 2 setups.
As i mentioned in other posts such large formations always point to an upcoming multi-year bullrun.
In the past IBM may have disappointed some investors because it traded sideways or didn't made as large moves as other tech stocks.
However we are very certain that IBM will reach prices above 170$ in the upcoming months and prices above 200$ are very likekly in the next years.
We have two major supports which give us a solid foundation for the upcoming movements, consider following levels as very important.
Bottom of yellow Wave 1: 112.10$
Bottom of blue Wave : 101.17$
As long as we don't break below these lines IBM will continue to be a very safe investment and the dividend of 4.80% is a big bonus for everyone!
===================================================================================================================
If you have questions related to a specific stock or the Elliot Wave theory, feel free to contact me.
