IBM Stock Forecast and Technical OutlookIBM Stock Forecast and Technical Outlook.
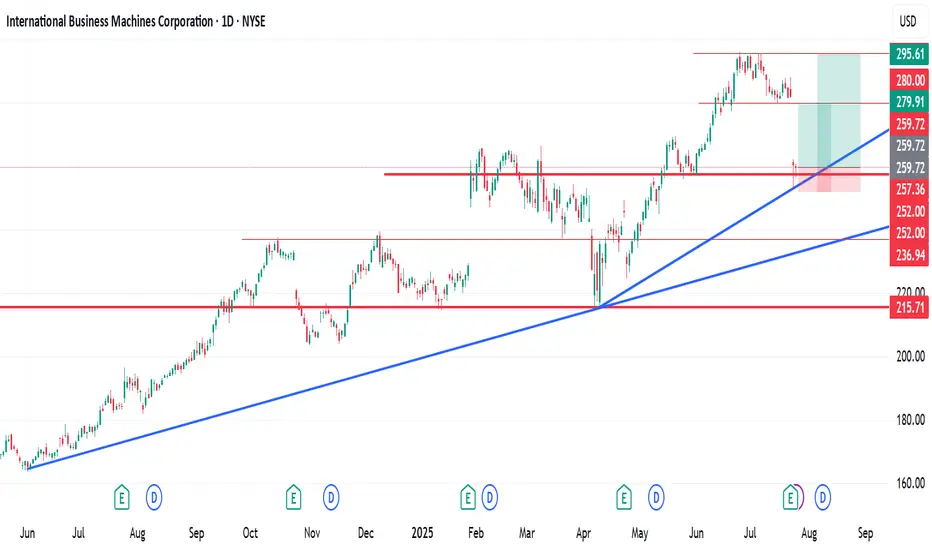
International Business Machines Corporation (IBM) reached a recent peak in June 2025 before experiencing a gradual decline. On July 24th, the stock saw a significant drop of over 10%, likely triggered by investor reaction to recent company news or broader market sentiment.
Despite this sharp decline, technical indicators on my chart suggest the potential for a short- to medium-term recovery. Based on my analysis, there are two potential setups with favourable Risk-to-Reward (R:R) ratios:
Scenario 1: R:R of 1:2.63
Scenario 2: R:R of 1:4.65
I bought some shares at $260.17
These figures indicate that for every unit of risk taken, there is a potential return of 2.63x or 4.65x, respectively, depending on the chosen entry and exit strategy.
As always, investors are advised to conduct their due diligence and apply proper risk management techniques before entering any position.
Hey friends, if this is helpful, kindly like, follow, subscribe, share and comment
IBMD trade ideas
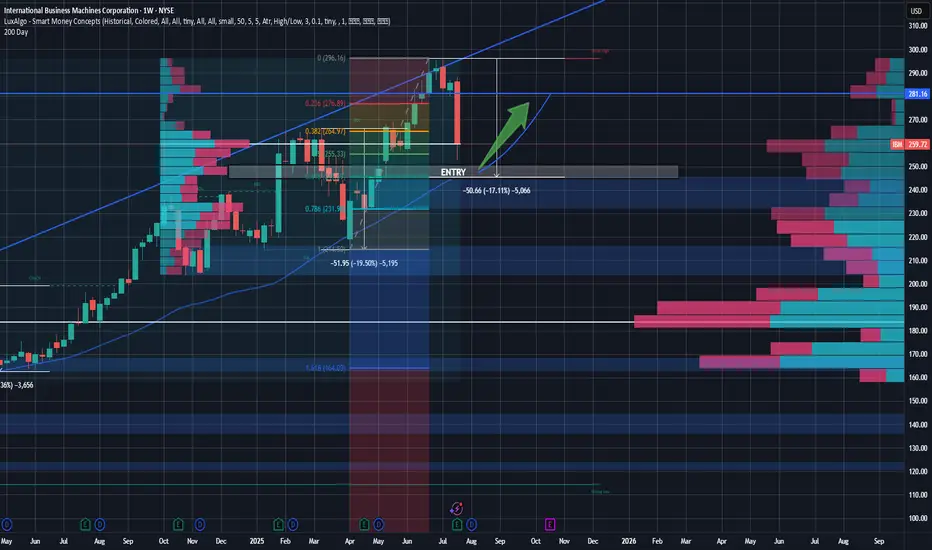
IBM Rebound Trade - Buying the Pullback at Key ConfluenceSetup:
IBM is setting up for a potential high-conviction long entry around the $245 level, a price zone marked by multiple layers of technical confluence and volume-based support. Over the last 18 months, IBM has seen two notable pullbacks—both in the 17–20% range, often around earnings events. The current drawdown is consistent with this historical behavior and may represent an opportunity rather than a breakdown.
Technicals & Indicators
Volume Profile Support:
Using a volume profile anchored from January 2024, a clear volume shelf exists between $245 and $265.
A second profile anchored 10 months ago confirms heavy volume at $260 and $245, indicating high institutional activity and potential support zones.
200-Day Moving Average:
IBM has consistently respected its 200-day MA over the past two years. The MA is now converging at $245, adding dynamic trendline support.
Fibonacci Retracement:
Applying retracements from the April 2025 lows to the recent ~ $300 highs, the $245 level aligns with the 61.8% Fibonacci level, a key zone for potential reversals.
GAP Fill:
Looking for the recent earnings gap to close within the next 2 months, as we see new opportunities for tech companies and rising demand. This overreaction created a gap that should be filled as investors digest the macro strength and re-enter long positions in IBM. Gap close ~ $280 level.
Candles & Buying Pressure:
Recent daily volume after earnings suggests strong buying pressure with a hammer/doji candle forming on the day after earnings. Investors are already buying back into this name.
Fundamentals & Business Operations:
Despite the post-earnings dip, IBM continues to display strong business fundamentals:
Free Cash Flow (TTM): ~$12.3B, supporting dividends and future investment.
FCF Margin: 19.1%
Gross Margin: ~58% | Operating Margin: ~ 17%
Forward P/E: ~22.45x | EV/EBITDA: ~19.85x
Dividend Yield: 2.6%
These metrics reflect operational efficiency, cash generation, and relative undervaluation compared to peers—especially given IBM’s AI and hybrid cloud positioning that remains strong. With margins that continue to be at the top of the industry, IBM also has the resources to execute on the tremendous opportunities arising in the tech world.
Macro & Industry Context:
We’re in the early stages of a long-term AI and data center growth cycle, and IBM, while not the most popular AI name, is deeply embedded in enterprise infrastructure, consulting, and mainframe compute. Their recent earnings beat didn’t change that narrative. Investor sentiment overreacted, giving patient traders a potential entry on weakness. Analysts still hold a buy on this name with price targets well above $270. This isn't a one-day trade, but in a few weeks, let's see where the market is at.
Price Targets & Risk/Reward:
Entry Zone: $245 (watch for confirmation & strength)
Target 1: $280 (resistance level with high volume in the range)
Optional Long-Term Hold: If the broader AI trend continues, IBM could break all-time highs and trend above $300 over time.
Strategy & Patience:
This is not a chase setup. I will wait for $245 to be reached and confirmed—a level backed by technical support, volume profile, and long-term valuation logic. If IBM holds and reverses with strength, this could be a strong swing trade or even a long-term position for investors who want value with AI exposure. I will be looking for a confirmation(maybe a candle pattern) before entering the trade, but if it gets there, I see good potential for a bounce.
Looking like an immediate buy on IBM! OptionsMastery:
🔉Sound on!🔉
📣Make sure to watch fullscreen!📣
Thank you as always for watching my videos. I hope that you learned something very educational! Please feel free to like, share, and comment on this post. Remember only risk what you are willing to lose. Trading is very risky but it can change your life!

IBM Earnings Trade Setup – JULY 22, 2025
📡 IBM Earnings Trade Setup – JULY 22, 2025
💼 IBM: Big Blue’s Rebound or Breakdown? Earnings Play Incoming
⸻
🔍 1. FUNDAMENTALS SNAPSHOT
📊 Revenue Growth: +0.5% YoY — flat in a fast-moving tech landscape
💰 Margins:
• Gross: 57.0%
• Operating: 12.4%
• Net: 8.7%
⚠️ Debt-to-Equity: 247.98 – Very high
🎯 EPS Beat Rate: 8/8 (Avg +3–5%)
📉 Analyst Sentiment: Mixed → PT = $273.36 < Current ($284.71)
🧠 Fundamental Score: 7/10 – Steady but slow
⸻
💣 2. OPTIONS FLOW SNAPSHOT
📍 Key Strikes:
• $280 Puts
• $310 Calls → Divergent sentiment
📉 IV: Moderate → ~5% expected move
📊 VIX: 16.65 → Favorable macro backdrop
🧷 Gamma Positioning: Volatility expected post-earnings
📟 Options Flow Score: 6/10 – Neutral bias, light commitment
⸻
⚙️ 3. TECHNICAL SETUP
📉 RSI: 33.17 → Oversold zone
📍 Support: $281.25 📍 Resistance: $287.96 (20MA)
📊 Volume: 0.84x average – Low conviction
📈 Technical Score: 6/10 – Setup for rebound, but watch for follow-through
⸻
🌐 4. MACRO & INDUSTRY CONTEXT
🚀 Tailwinds: Hybrid cloud & AI transition → long-term catalyst
⚖️ Risks: High rates + weak enterprise spend = potential margin drag
🌐 Low VIX = Calm backdrop, but high post-earnings reactivity
🌍 Macro Score: 8/10
⸻
🎯 DIRECTIONAL CALL
🟡 Moderately Bullish – 70% Confidence
→ Conservative management, solid margins, oversold technicals… but revenue flat and sentiment split
⸻
🛠️ TRADE IDEA
🔹 BUY $290 Call exp. 07/25 @ $6.00
🎯 Target: $12.00+ (→ stock > $296)
⚠️ Stop Loss: $3.00
📅 Entry: Before Earnings Close (Jul 23, AMC)
💰 Risk/Reward: 1:2 (100% risk, up to 200% reward)
⸻
🔐 RISK PLAN
💼 Max Risk = 2% Portfolio → 2 contracts (for $100k acct)
📉 Exit if down 50%
⏱️ Time Stop: Exit by 10AM EST post-earnings if flat
⸻
🧬 TRADE DETAILS (JSON Format)
{
"instrument": "IBM",
"direction": "call",
"strike": 290.0,
"expiry": "2025-07-25",
"confidence": 70,
"profit_target": 12.00,
"stop_loss": 3.00,
"size": 2,
"entry_price": 6.00,
"entry_timing": "pre_earnings_close",
"earnings_date": "2025-07-23",
"earnings_time": "AMC",
"expected_move": 5.0,
"iv_rank": 0.50,
"signal_publish_time": "2025-07-22 14:58:35 UTC-04:00"
}
⸻
#IBM #EarningsPlay #OptionsFlow #TechStocks #HybridCloud #CallOptions #VolatilitySetup #TradingView

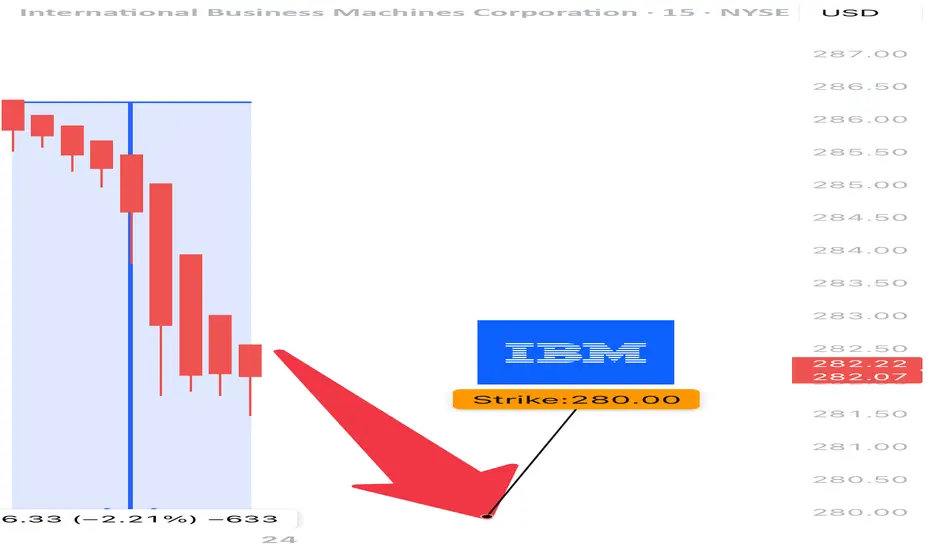
IBM Earnings Analysis Summary (2025-07-23)
🧨 IBM Earnings Trade Idea 🧨
Earnings Date: July 24, 2025 (AMC)
🧠 Confidence: 70% Bearish | 🎯 Expected Move: ~5%
⸻
🔍 Snapshot Summary:
• 🐢 Revenue Growth: Flat at +0.5% YoY
• ⚠️ High Debt: D/E ratio at 247.98 — compression risk
• ✅ Beat History: 100% past 8 quarters, but…
• 🤔 Forward EPS Projections: +81.7% looks too ambitious
• 🔻 Analyst Target Below Market Price: $273.36 avg (vs. $281.96 now)
• 📉 Pre-Earnings Drift: Trading below 20-day MA
• 🛡️ Options Flow: Bearish bias, heavy put flow at $275/$255 strikes
⸻
🧠 Strategy Rationale:
Despite a strong beat history, IBM’s fundamentals are weakening — growth is stagnant, debt is high, and guidance may disappoint. Institutions are hedging downside via puts, and recent technical action shows momentum fading.
⸻
📉 Earnings Trade Setup
{
"instrument": "IBM",
"direction": "put",
"strike": 280.00,
"expiry": "2025-07-25",
"entry_price": 6.30,
"confidence": 70,
"profit_target": 12.00,
"stop_loss": 3.15,
"size": 2,
"entry_timing": "pre_earnings_close",
"earnings_date": "2025-07-24",
"expected_move": 5.0,
"iv_rank": 0.60
}
⸻
💼 Trade Details (Simplified)
🔧 Parameter 🧾 Value
🎯 Strike $280 Put
📅 Expiry 2025-07-25
💵 Entry Price $6.30
🚀 Profit Target $12.00 (200% gain)
🛑 Stop Loss $3.15 (50% loss)
⚖️ Position Size 2 contracts
⏰ Entry Timing Before close 7/24
📈 IV Rank 60%
⸻
🎯 Exit Plan:
• 💰 Profit Exit: Close if premium hits $12+
• ⚠️ Stop Loss: Trigger at $3.15
• ⏱️ Time Exit: Auto-close within 2 hours post-earnings to avoid IV crush
⸻
🧠 Final Thoughts:
“IBM’s history says beat — but the setup says trap.”
If guidance stumbles, this low-beta name could slide, and bearish put flow is already sniffing it out.
📊 Are you riding the puts with this one, or fading the crowd? Let me know👇

IBM EARNINGS TRADE IDEA — BEARISH SETUP INTO EARNINGS
⚠️ IBM EARNINGS TRADE IDEA — BEARISH SETUP INTO EARNINGS ⚠️
📅 Report Date: July 25, 2025 (AMC)
🔎 Confidence Level: 70% Bearish Bias
🧠 Thesis: Fundamentals weak | Options market hedging | Price below key MA | Guidance risk elevated
⸻
🔍 Quick Breakdown:
• IBM is lagging in growth: TTM revenue up just 0.5%, margins OK but under pressure from high debt (D/E 248).
• 100% EPS beat history, BUT current price ($281.96) > analyst target ($273.36) → room for downside surprise.
• Heavy OTM Put flow ($275 & $255 strikes) + Put/Call skew suggests big-money hedging.
• Trading below 20DMA ($287.55) = bearish drift.
⸻
📉 OPTIONS TRADE IDEA (SHORT SETUP)
🛠 Play: Buy $280 Puts (Exp. July 25)
💵 Entry Price: ~$6.30
🎯 Profit Target: ~$12.00
🛑 Stop Loss: ~$3.15
⚖️ Risk/Reward: ~1:2.5
📦 Size: 2 contracts
📊 Expected Move: ±$5
📉 Support to Watch: $270 (Break = flush potential)
📈 IV Rank: 60 — juicy enough, but not extreme.
⸻
📍 Exit Plan:
• 🟢 Sell if premium hits $12+
• 🔴 Cut loss at 50% drawdown ($3.15)
• ⏱ Auto-exit 2 hours post ER if theta crush hits
⸻
📊 TL;DR (FOR THE CHART GANG):
{
"ticker": "IBM",
"direction": "PUT",
"strike": 280,
"expiry": "2025-07-25",
"entry": 6.30,
"target": 12.00,
"stop": 3.15,
"confidence": 70,
"iv_rank": 0.60,
"expected_move": 5,
"earnings_time": "AMC"
}
⸻
💬 Drop your thoughts — are you playing NYSE:IBM into earnings?
📉 Tag someone who loves short setups.
🔁 Repost if you like clean risk/reward with macro + tech + options alignment.
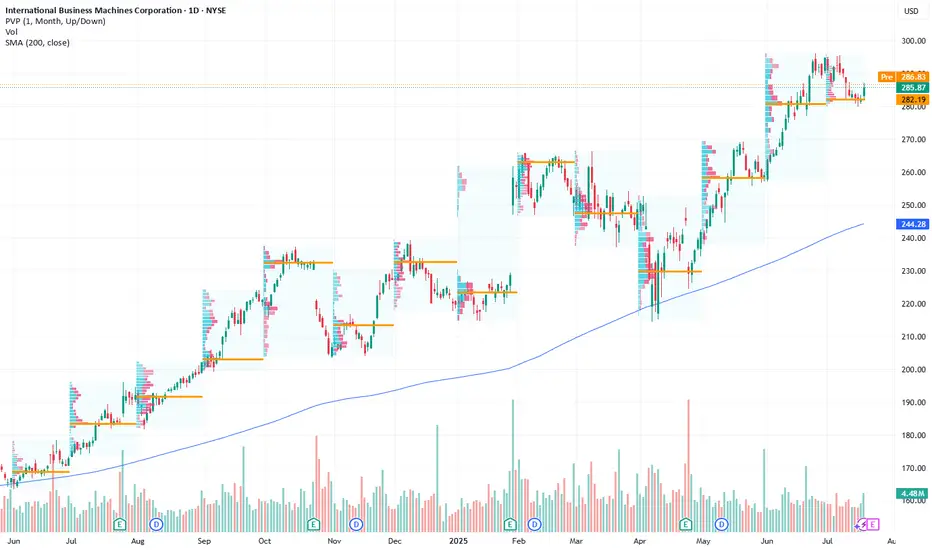
IBM's Cloud & Consulting Momentum Presents Bullish Setup Current Price: $285.87
Direction: LONG
Targets:
- T1 = $294.00
- T2 = $305.00
Stop Levels:
- S1 = $279.50
- S2 = $276.00
**Wisdom of Professional Traders:**
This analysis synthesizes insights from thousands of professional traders and market experts, leveraging collective intelligence to identify high-probability trade setups. The wisdom of crowds principle suggests that aggregated market perspectives from experienced professionals often outperform individual forecasts, reducing cognitive biases and highlighting a consensus opportunity in IBM.
**Key Insights:**
IBM stands at the forefront of digital transformation, benefiting from its strategic emphasis on hybrid cloud infrastructure and AI-driven solutions. The company's recent collaboration projects and client acquisitions demonstrate its growing popularity in enterprise IT solutions. The demand for scalable and efficient cloud services continues to rise, positioning IBM for future revenue expansion. Another notable focus has been the firm’s consulting services, which aid organizations in navigating complex IT challenges. This dual-pronged approach suggests a robust growth trajectory.
Traders also highlight the importance of IBM's consistent revenue streams driven by long-term contracts in tech services, which provide stability even during broader market fluctuations. Upcoming earnings reports will act as a key linchpin, with a strong showing likely to reinforce investor confidence.
**Recent Performance:**
IBM shares have exhibited a steady performance, reflecting market optimism around its enterprise tech offerings. The stock has outperformed broader indices over the past month, especially as tech-heavy names gain favor among investors rotating into defensive growth sectors. IBM's ability to weather volatility, aided by the strong growth in key business segments, has cemented its reputation as a resilient performer in uncertain market conditions.
**Expert Analysis:**
Market analysts remain upbeat about IBM’s growth prospects. Several industry experts have noted the company’s focus on its consulting division, which serves as an entry point to establish deeper client relationships. Analysts also point to the hybrid cloud business as a differentiator, particularly as it grows through innovative products and partnerships. The firm’s ability to leverage AI technologies across sectors such as financial services, healthcare, and supply chains is another feather in its cap, providing diverse revenue streams.
Technically, IBM's stock recently bounced off key support levels and is approaching resistance that, if surpassed, could trigger a rally. Trading volumes have built up ahead of earnings season, signaling strong investor interest.
**News Impact:**
Recent headlines in the tech sphere have buoyed IBM, especially as organizations across industries accelerate their digital initiatives. Positive sentiment around enterprise IT demand and macroeconomic data supportive of capital spending further enhance IBM's growth potential. Additionally, news indicating IBM’s role in pivotal tech partnerships has contributed to its bullish narrative, drawing attention to its competitive positioning.
**Trading Recommendation:**
With a positive earnings outlook and favorable macroeconomic conditions, IBM is well-poised for a breakout. Traders should consider taking a LONG position, targeting $294.00 as the first upside level and $305.00 subsequently. Stop-loss levels at $279.50 and $276.00 provide risk management against downside volatility. This setup rewards patient investors willing to leverage IBM’s momentum for mid-term growth.
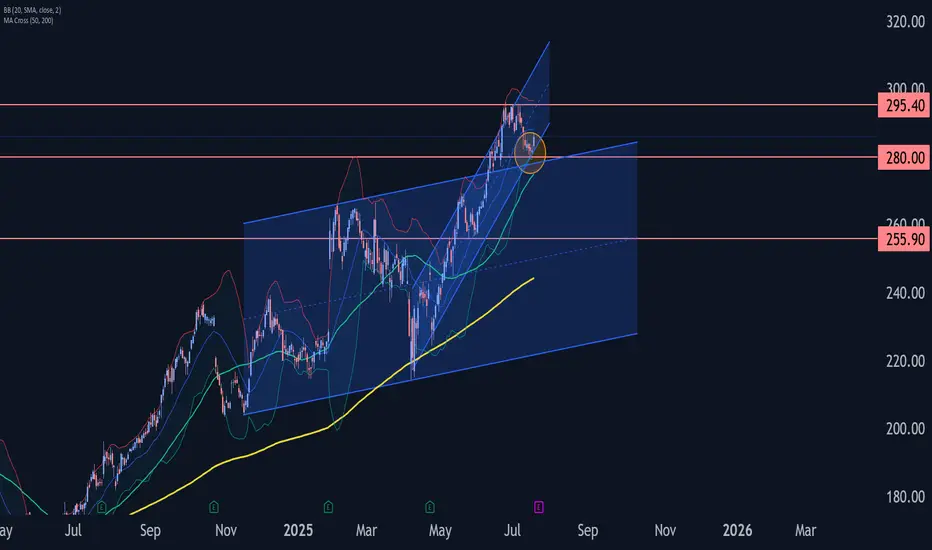
IBM Wave Analysis – 18 July 2025
- IBM reversed from support zone
- Likely to rise to resistance 295.40
IBM recently reversed up from the support zone between the support level 280.00, upper trendline of the recently broken weekly up channel from 2024 and the support trendline of the more recent up channel from April.
This support zone was further strengthened by the lower daily Bollinger Band and by the 38.2% Fibonacci correction of the sharp upward impulse from May.
Given the clear daily uptrend and the oversold daily Stochastic, IBM can be expected to rise further to the next resistance 295.40 (which stopped the previous waves 3 and (b)).
IBM eyes on $282.88: Golden Genesis fib a Key Support to uptrendIBM has been in a strong uptrend but looking top-ish.
It has pulled back to a Golden Genesis fib at $282.88
Look for a bounce but perhaps after a couple orbits.
.
See "Related Publications" for previous charts like this BOTTOM CALL:
Hit the BOOST and FOLLOW for more such PRECISE and TIMELY charts.
============================================================
.

IBM: SHA-ttering ExpectationsAs we move through 2024, NYSE:IBM continues to demonstrate its strength as a technology powerhouse, particularly in cloud computing, AI, and cybersecurity. With a legacy rooted in innovation, IBM's deep history in encryption technologies and its forward-looking strategies make it a compelling buy for investors aiming to capitalize on the next wave of tech advancements.
Financial Performance:
Revenue Growth: IBM reported a 5% year-over-year increase in revenue for Q2 2024, driven primarily by its hybrid cloud and AI segments, which saw a combined growth of 12%.
Earnings Beat: The company beat analyst expectations with an EPS of $3.15, outperforming the consensus estimate of $2.98. This marks IBM’s fourth consecutive quarter of earnings beats, underscoring its operational efficiency and strong market positioning.
Cash Flow: IBM’s free cash flow improved to $9.5 billion for the first half of 2024, reflecting a 7% increase compared to the same period last year, providing ample liquidity for continued investment in innovation and shareholder returns.
Quantum Computing and AI Leadership:
Quantum Breakthroughs: In 2024, IBM announced a significant breakthrough in quantum computing with its 127-qubit 'Eagle' processor, which is expected to accelerate quantum application developments in fields such as cryptography, materials science, and financial modeling.
AI Advancements: IBM’s AI platform, WatsonX, continues to gain traction in the enterprise space, with a 15% increase in new customer adoption in 2024. The platform’s integration with IBM’s hybrid cloud solutions positions it as a leader in the AI-driven transformation of industries.
Acquisitions: IBM’s strategic acquisition of ReaQta in late 2023 is already paying dividends in 2024. This cybersecurity firm enhances IBM’s X-Force Threat Management services, making IBM a more formidable player in the fast-growing cybersecurity market.
Partnerships: The expansion of IBM’s partnership with SAP in 2024 is set to deliver joint cloud and AI solutions that address the needs of global enterprises, further cementing IBM’s role as a key technology enabler.
Technical Potential:
Stock Performance: As of August 2024, IBM’s stock is trading at $190 per share, up 25% year-to-date, but still trading at a forward P/E ratio of 12.5x, which is below the industry average. This suggests the stock is undervalued relative to its peers, providing a buying opportunity.
Price Target: Analysts are bullish on IBM’s growth prospects, with a consensus price target of $250, representing a potential upside over the next 12 months. This target is supported by expected continued growth in IBM’s high-margin cloud and AI businesses.
Dividend Yield: IBM continues to offer a robust dividend yield of 4.7%, providing an attractive income stream while investors wait for the company’s growth initiatives to further drive stock price appreciation.
- Q3 2024 Earnings: October 23, 2024 (preliminary)
- Q4 2024 Earnings: January 22, 2025 (measurable)
Did IBM develop Bitcoin? Goodluck.
$194.75 NYSE:IBM

Surprising ups and downs in global indicesJune brought contrasting moves across global stock markets: while the U.S. and Asia posted gains, Europe struggled under pressure. Rising tensions between Iran and Israel, political instability in the EU, and shifting rate expectations fueled volatility. In search of stability, investors turned to U.S. tech and exporters — pushing the S&P 500 (#SP500) and Nasdaq 100 (#NQ100) higher.
Key market movers in June:
• #SP500 (+0.96%), Dow Jones (#DJI30) (+0.89%), #NQ100 (+0.94%) – buoyed by dovish Fed tone and Iran’s restrained response to U.S. strikes. #Tesla surged 8.2%, with #IBM also among top gainers.
• Hong Kong 50 (#HSI) (+3%) – lifted by strong retail data and hopes of new stimulus from China.
• Australia 200 (#ASX) (+1.25%) – boosted by RBA rate cut expectations and strong tech sector performance.
• France 40 (#CAC40) (–2.76%) – weighed down by political risks and weakness in luxury stocks.
• Europe 50 (#ESTX50) (–1.8%) – hurt by soft ECB tone and weaker business activity.
• DAX 30 (#DAX30) (–3%) – pressured by weak industrial data and fading Chinese demand.
S&P 500 and Nasdaq 100 continue to rise on solid macro data, a softer Fed stance, and strong earnings from major tech players. Analysts at FreshForex believe investor confidence in the U.S. recovery supports the ongoing bullish trend.

IBM: Still BullishAfter the increases over the recent weeks, we still place IBM within the magenta wave (3) and expect a bit more bullish headroom in the short term. However, in our medium-term alternative scenario, we would see a larger pullback with the green wave alt. . Such a detour is considered 30% likely and would be confirmed by a drop below the support at $260.48.
📈 Over 190 precise analyses, clear entry points, and defined Target Zones - that's what we do.

IBM – Long Trade Setup📈
🔍 Pattern: Bullish pennant breakout
📍 Entry: Around $281.88 (breakout confirmation)
🎯 Target: $287.52 (green resistance zone)
🛑 Stop-loss: Below $278.50 (support area)
✅ Why this trade?
Strong uptrend with clean pullback
Breakout from consolidation (pennant)
Solid volume and momentum follow-through
Favorable R:R setup above key levels
📊 Timeframe: 30-minute chart
🎯 Bias: Long / Breakout continuation

IBM: Strategic AI and Hybrid Cloud Expansion Signals Bullish Ups
Current Price: $277.22
Direction: LONG
Targets:
- T1 = $285.00
- T2 = $293.50
Stop Levels:
- S1 = $270.50
- S2 = $265.00
**Wisdom of Professional Traders:**
This analysis synthesizes insights from thousands of professional traders and market experts, leveraging collective intelligence to identify high-probability trade setups. The wisdom of crowds principle suggests that aggregated market perspectives from experienced professionals often outperform individual forecasts, reducing cognitive biases and highlighting consensus opportunities in IBM.
**Key Insights:**
IBM's ongoing transformation towards hybrid cloud and AI technologies positions the company for substantial future growth. Its aggressive pursuit of hybrid cloud as a core strategy has already demonstrated significant financial contributory results. Furthermore, IBM's expansion activities in high-growth markets such as India and its investments in next-generation AI tools create a dual engine of innovation and market capture. These strategic moves bolster IBM's competitive standing, earning market confidence for long-term growth.
**Recent Performance:**
IBM's stock shows consistent resilience, even as broader markets face volatility. The company’s focused shift towards higher-margin businesses has not only stabilized revenue but also attracted income-focused investors due to its appealing dividend yield. Recent price levels reflect steady demand and favorable valuation multiples, making IBM an attractive option for investors seeking a mix of growth and stability.
**Expert Analysis:**
Analysts assert that IBM’s strategic direction, under CEO Arvind Krishna, is effectively aligning the company with key emerging trends such as artificial intelligence and hybrid cloud computing. Notably, IBM has capitalized on partnerships in international markets, particularly in the Asia-Pacific region, signaling a concerted effort to de-risk revenue streams while opening doors to growth opportunities. This pivot has been widely acknowledged as a progressive strategy to maintain edge over its competitors and achieve long-term scalability.
**News Impact:**
IBM’s recently announced collaborations with Indian firms to adopt AI and cloud solutions underline its strategic focus on developing markets. These efforts further strengthen IBM’s footprint in APAC, a region historically underutilized within its portfolio. Combined with its investments in AI-driven innovations, these developments support IBM's bullish trajectory by providing fresh revenue streams and bolstering investor optimism about its growth potential.
**Trading Recommendation:**
IBM’s strategic transformation and proactive positioning in high-growth markets offer robust long-term upside for investors. Coupled with recent advancements in AI and hybrid cloud and the added support of strong market momentum, IBM appears well-positioned for a bullish rally. Thus, traders are recommended to adopt a long position with careful adherence to the stop levels provided to manage downside risks.

IBM Strong uptrend and may see target at 302NYSE:IBM uptrend remain strong and we have been holding on to it since our last report sharing
Price action shows a clear uptick above the 123.6% Fibonacci extension level and with that, we see a strong potential bullish upside as there is not strong bearish reversal at 123.6%.
Hence, we are reinitiating a buy on IBM witha target at 302.00

IBM Approaching Channel Resistance – Bear Call Spread Setup?IBM has rallied strongly within a clear ascending channel since late 2023, pushing recently into all-time highs and testing the upper boundary of the structure. This level has acted as resistance multiple times in the past — and we may now be approaching another potential rejection zone.
🔍 Key Technical Context:
✅ Price trading near ATHs, pressing against the top of the rising channel.
🟦 Structure remains bullish, but extended and overbought.
🔄 Prior touches of channel highs led to pullbacks (see red markers).
🧲 A demand zone remains intact around $266–270, but price is currently stretched above it.
🧠 Options Strategy Outlook:
With volatility elevated and price near structural resistance, this could be a solid setup for a Bear Call Spread:
Sell Call near: $285–290
Buy Call near: $295+ (to define risk)
Thesis: Price will remain below upper channel or stall around ATHs.
📌 Summary:
IBM is in a strong uptrend — but technical conditions suggest exhaustion risk near channel resistance. No short signals yet, but for non-directional traders, this could be a low-risk zone to build income-based spreads.
I'll be monitoring for:
🕯️ Reversal patterns at resistance
📉 Breakdown below $278 = early weakness
❌ Break and close above channel = invalidates idea

IBM Wave Analysis – 11 June 2025
- IBM broke key resistance level 270.00
- Likely to rise to the resistance level 290.00
IBM broke above the key resistance level 270.00 (which stopped the previous impulse wave (1) in the middle of May).
The breakout the resistance level 270.00 accelerated the minor impulse wave 3 of the intermediate impulse wave (3) from the end of May.
IBM can be expected to rise to the next resistance level 290.00 (target for the completion of the active impulse wave 3).

IBM Breakout in Motion: Eyes on $282.81 🚀"
📝 Caption/Description:
✅ Long Trade Setup on IBM (30-min Chart)
🔹 Entry: $276.29
🔹 Stop Loss: $273.96
🔹 Target: $282.81
🔹 R:R Ratio: ~1:2.7
🔸 Ascending triangle breakout with bullish volume spike
🔸 Minor resistance at $279.18 — monitor price reaction
📊 Strategy: Breakout + Trend Momentum
🦅 Chart by ProfittoPath

IBM heads up at $273: Serious Resistance may give a Dip-to-Buy IBM has been flying to new All Time Highs (finally)
Now testing a serious resistance at $272.98-273.65
It may need to retest support zone $267.46-267.86
.
Previous Analysis that caught the EXACT BOTTOM:
Hit the BOOST and FOLLOW to encourage more such PRECISE ideas.
==========================================================
.

IBM Wave Analysis – 3 June 2025
- IBM reversed from the support zone
- Likely to rise to the resistance level 270.00
IBM recently reversed up from the support zone between the support level 255.90 (low of the previous correction 2), the 20-day moving average and the 61.8% Fibonacci correction of the upward impulse from May.
The upward reversal from this support zone continues the active impulse waves 3 and (3).
Given the clear daily uptrend, IBM can be expected to rise to the next resistance level 270.00 (which stopped the earlier impulse wave 1 in the middle of May).

IBM - PRIMED FOR A PUNCH TO THE MOON!Good Afternoon,
Stumbled across this one today. IBM - It looks beautiful and it is. Great bullish volume, about to surpass the last high.
Bottoms up, Enjoy!

IBM: Bullish AttemptsIBM has made progress in our scenario: Currently, the price is rising above the crucial resistance at $265.72; clearly surpassing this mark is important in the ongoing wave (3) in magenta. While we cannot entirely remove our alternative scenario with a new low for wave alt. in green, it still holds a 33% probability. We primarily expect that the regular wave in green was already completed at $211.52 and are therefore preparing for a direct continuation of the increases in the broader wave in green.
📈 Over 190 precise analyses, clear entry points, and defined Target Zones - that's what we do.

IBM: Sneaking Toward a Breakout?International Business Machines is the top-performing member of the Dow Jones Industrial Average this year, and some traders may think it will keep climbing.
The first pattern on today’s chart is the push above $269 last week. The IT company pulled back after hitting that record peak, but found support at its rising 21-day exponential moving average (EMA).
It also closed above its 8-day exponential moving average (EMA), which is additionally above the 21-day EMA. Those signals may be consistent with a short-term uptrend.
Next, IBM is above $261.64, the previous weekly closing high from early March. That may suggest a breakout is being attempted.
Third, MACD is rising.
Fourth, you have some longer-term patterns. The 50-, 100- and 200-day simple moving averages (SMAs) are in a potentially bullish sequence, with faster SMAs above the slower. IBM also held its January low in April, avoiding the deeper declines experienced by the broader market.
Those patterns may be consistent with long-term strength.
Check out TradingView's The Leap competition sponsored by TradeStation.
TradeStation has, for decades, advanced the trading industry, providing access to stocks, options and futures. If you're born to trade, we could be for you. See our Overview for more.
Past performance, whether actual or indicated by historical tests of strategies, is no guarantee of future performance or success. There is a possibility that you may sustain a loss equal to or greater than your entire investment regardless of which asset class you trade (equities, options or futures); therefore, you should not invest or risk money that you cannot afford to lose. Online trading is not suitable for all investors. View the document titled Characteristics and Risks of Standardized Options at www.TradeStation.com . Before trading any asset class, customers must read the relevant risk disclosure statements on www.TradeStation.com . System access and trade placement and execution may be delayed or fail due to market volatility and volume, quote delays, system and software errors, Internet traffic, outages and other factors.
Securities and futures trading is offered to self-directed customers by TradeStation Securities, Inc., a broker-dealer registered with the Securities and Exchange Commission and a futures commission merchant licensed with the Commodity Futures Trading Commission). TradeStation Securities is a member of the Financial Industry Regulatory Authority, the National Futures Association, and a number of exchanges.
TradeStation Securities, Inc. and TradeStation Technologies, Inc. are each wholly owned subsidiaries of TradeStation Group, Inc., both operating, and providing products and services, under the TradeStation brand and trademark. When applying for, or purchasing, accounts, subscriptions, products and services, it is important that you know which company you will be dealing with. Visit www.TradeStation.com for further important information explaining what this means.
