ICICI BANK LTD.
ICICI BANK LTD.
.
Fundamental is Good.
.
(Private Banking Sector Looks Goods.)
.
Long-term view!
.
CMP 1203
Resistance -1235
.
SL -1176 on CB
Deep SL 1165 on CB.
.
.
This is Kartik Thakur,
Signing off
:)
IBN trade ideas

ICICI Bank Ltd intraday level for 19th Aug #ICICIBANK ICICI Bank Ltd intraday level for 19th Aug #ICICIBANK
Buying may witness above 1200
Support area 1179. Below ignoring buying momentum for intraday
Selling may witness below 1179
Resistance area 1200. Above ignoring selling momentum for intraday
Charts for Educational purposes only.
Please follow strict stop loss and risk reward if you follow the level.
Thanks,
V Trade Point

ICICI Bank Ltd: Ascending Trend Line and Potential Bullish BreakTechnical View
➡ Ascending trend line providing strong support
➡ Retrace from demand zone near 1150
➡ Next resistance at 1247
➡ Bullish breakout possible above 1192
➡ RSI at 52, indicating neutral momentum

ICICI BANK Ltd intraday level for 16th Aug #ICICIBANK ICICI BANK Ltd intraday level for 16th Aug #ICICIBANK
Buying may witness above 1172
Support area 1160. Below ignoring buying momentum for intraday
Selling may witness below 1153
Resistance area 1165. Above ignoring selling momentum for intraday
Charts for Educational purposes only.
Please follow strict stop loss and risk reward if you follow the level.
Thanks,
V Trade Point

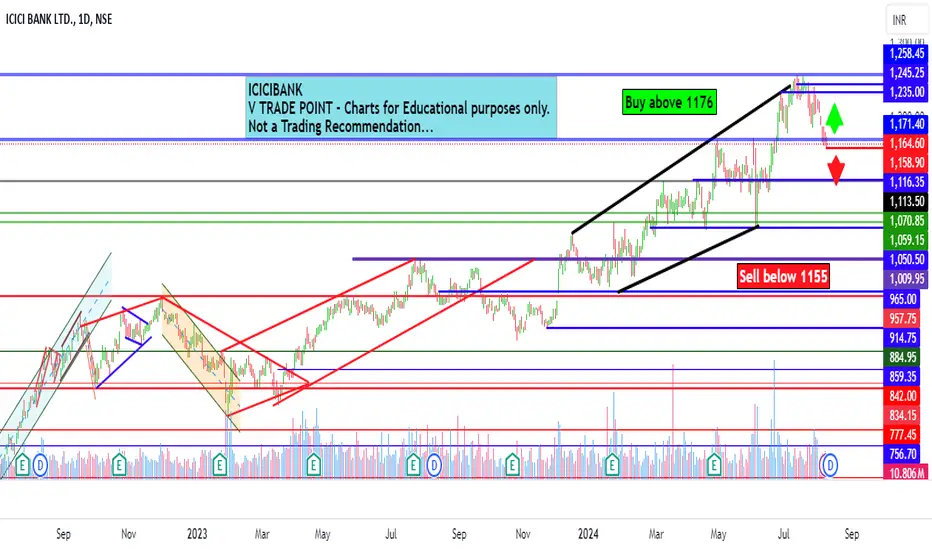
ICICI Bank Ltd intraday level for 14th Aug #ICICIBANK ICICI Bank Ltd intraday level for 14th Aug #ICICIBANK
Buying may witness above 1176
Support area 1165. Below ignoring buying momentum for intraday
Selling may witness below 1155
Resistance area 1165 Above ignoring selling momentum for intraday
Charts for Educational purposes only.
Please follow strict stop loss and risk reward if you follow the level.
Thanks,
V Trade Point

ICICI Bank ltd.Hammer at support line, similar pattern in axis bank, looks like banknifty is ready to boost nifty from here. Even HDFC Bank is showing some good turnaround from support. big Private banks are showing good strength.

ICICI BANK Elliot Wave Analysisicici bank 3 hour time period chart analysis . this stock down side create normal flat correction . normal flat correction internal wave a,b or c

ICICI BANK LTD S/R Support and Resistance Levels:
Support Levels: These are price points (green line/share) where a downward trend may be halted due to a concentration of buying interest. Imagine them as a safety net where buyers step in, preventing further decline.
Resistance Levels: Conversely, resistance levels (red line/shade) are where upward trends might stall due to increased selling interest. They act like a ceiling where sellers come in to push prices down.
Breakouts:
Bullish Breakout: When the price moves above resistance, it often indicates strong buying interest and the potential for a continued uptrend. Traders may view this as a signal to buy or hold.
Bearish Breakout: When the price falls below support, it can signal strong selling interest and the potential for a continued downtrend. Traders might see this as a cue to sell or avoid buying.
20 EMA (Exponential Moving Average):
Above 20 EMA: If the stock price is above the 20 EMA, it suggests a potential uptrend or bullish momentum.
Below 20 EMA: If the stock price is below the 20 EMA, it indicates a potential downtrend or bearish momentum.
Disclaimer:
I am not a SEBI registered. The information provided here is for learning purposes only and should not be interpreted as financial advice. It's important to remember that while these indicators can be useful, they are not foolproof. Always consider the broader market context and consult with a qualified financial advisor before making any investment decisions.

ICICI Bank Ltd intraday level for 9th Aug #ICICIBANK ICICI Bank Ltd intraday level for 9th Aug #ICICIBANK
Buying may witness above 1176
Support area 1160. Below ignoring buying momentum for intraday
Selling may witness below 1155
Resistance area 1140 Above ignoring selling momentum for intraday
Charts for Educational purposes only.
Please follow strict stop loss and risk reward if you follow the level.
Thanks,
V Trade Point
ICICI Bearish PossiblitiesIn the ICICI Bank. It displays multiple week candle in the chart.
Simple words :
1. Head & Shoulder pattern.
2. Multiple Rejection Candle.
3. Volume Increased (1220 to 1230).
Entry : Stock should break the neckline and if Candle body close below 1160 price.
Target : 1340
Reacting Points : 1164
Stoploss : Above 1230.
Explanation :
Technical analysis :
Trend is Uptrend. But it is forming Head & Shoulder Pattern. Once it breaks the neckline. It have more possibilities to go opposite direction.
Volume Analysis :
In the volume analysis , Some big institutional players sell or book the profit at the level of 1220 to 1230. That's why volume indicator shoot up and cross the moving averaging level. It means Big transactions happened, that transaction is not BUY. Because buy means Candle body should be strong, but it show INVERTED HAMMER.
Volume profile fixed range :
Red line show High transaction happened at the level.
If market close below 1660 level, then free fall.
So better square off the position or buy put option.
I am not a SEBI Register advisor. I am sharing information for educational purpose.

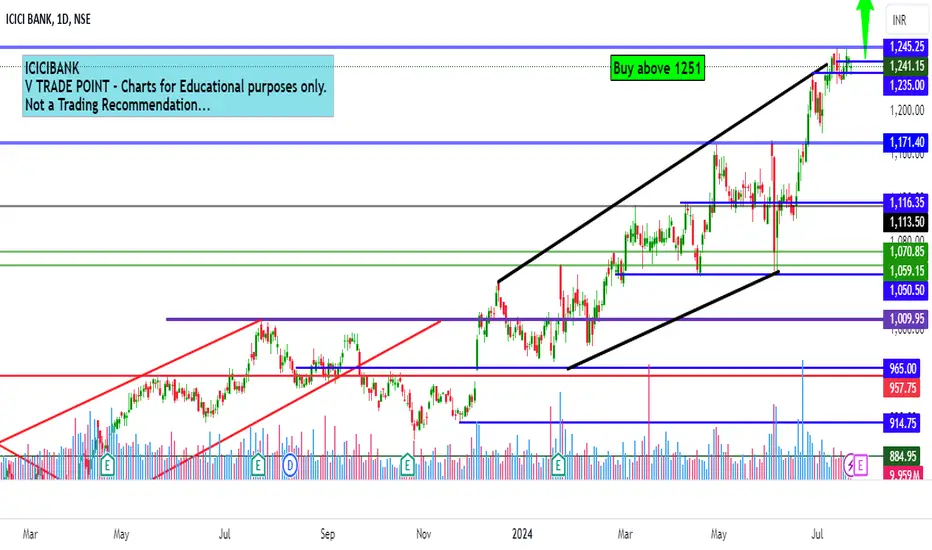
ICICI BANK Intraday level for 23rd July #ICICIBANK ICICI BANK Intraday level for 23rd July #ICICIBANK
Buying may witness above 1251
Support area 1235-1240. Below ignoring buying momentum
Charts for Educational purposes only.
Please follow strict stop loss and risk reward if you follow the level.
Thanks,
V Trade Point
ICICI BANKStock is in bullish trend since Feb-2024 from 980 levels and reached 1170 levels by end of April. I suggest to enter around 1110 - 1115 levels and wait for the target of 1170 in the near short term.
The stock can reach 1247, 1370 levels in the near term. Stop loss 1090 & 1075 levels..
Risky trade can be taken at the current market price since the stock is in uptrend

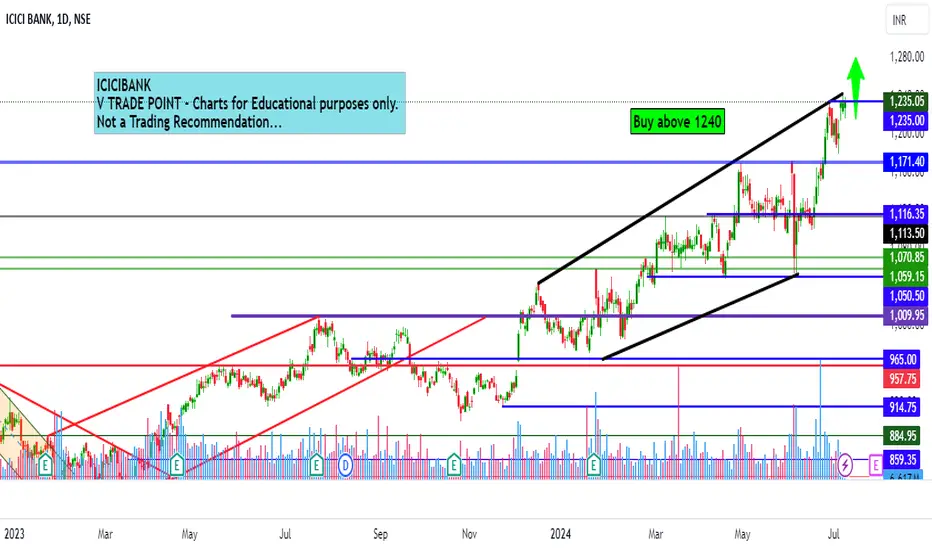
ICICI Bank Intraday level for 10th July #ICICIBANK ICICI Bank Intraday level for 10th July #ICICIBANK
Buying opportunity above 1251
Support area 1230-1235. Below ignoring buying opportunity
Charts for Educational purposes only.
Please follow strict stop loss and risk reward if you follow the level.
Thanks,
V Trade Point

Short on Icici bankA Failed breakout goes the other way. Thus I am short on this. Stop loss is in the chart.

ICICI Bank Intraday level for 9th July #ICICIBANK ICICI Bank Intraday level for 9th July #ICICIBANK
Buying opportunity above 1240
Support area 1225-1228. Below ignoring buying opportunity
Charts for Educational purposes only.
Please follow strict stop loss and risk reward if you follow the level.
Thanks,
V Trade Point
Icici bank reversal dueA big reversal due in ICICI bank and can just begin in matter of few dyas. Look out for the reversal.
Just a view.

ICICI BANK S/R for 5/7/24Support and Resistance Levels: In technical analysis, support and resistance levels are significant price levels where buying or selling interest tends to be strong. They are identified based on previous price levels where the price has shown a tendency to reverse or find support.
Support levels are represented by the green line and green shade, indicating areas where buying interest may emerge to prevent further price decline.
Resistance levels are represented by the red line and red shade, indicating areas where selling pressure may arise to prevent further price increases. Traders often consider these levels as potential buying or selling opportunities.
Breakouts: Breakouts occur when the price convincingly moves above a resistance level (red shade) or below a support level (green shade). A bullish breakout above resistance suggests the potential for further price increases, while a bearish breakout below support suggests the potential for further price declines. Traders pay attention to these breakout signals as they may indicate the start of a new trend or significant price movement.
20 EMA: The yellow line denotes 20 EMA, to interpret the 20 EMA, you need to compare it with the prevailing stock price. If the stock price is below the 20 EMA, it signals a possible downtrend. But if the stock price is above the 20 EMA, it signals a possible uptrend.
Disclosure: I am not SEBI registered. The information provided here is for learning purposes only and should not be interpreted as financial advice. It is important to consult with a qualified financial advisor before making any investment decisions. Tweets neither advice nor endorsement.

IBNEducational purpose and not a recommendation
INDIA based bank, election completed, the same govt. (with allied parties) has won the elections. Market will get around and start going up after this settles. Expecting this stock to do well, 4 to 5% in few weeks.

ICICI BANK Downtrend #icicibank
CMP : 1199.60
May be show some downtrend from here.
T1 : 1169
T2 : 1124
SL : Above Trendline

ICICI Bank's Global Ranking Ascends: A Bullish Trading SignalICICI Bank has climbed to become the 18th most valuable lender globally, signaling a bullish outlook for traders. The technical analysis of its stock reveals a recent breakout supported by an ascending trendline, indicative of strong buying momentum and potential for further gains. This key milestone underscores ICICI Bank's robust market presence and offers a promising trading opportunity in the financial sector.

ICICI bank chart analysisICICI bank chart analysis on daily time frame. Please share your feedback and follow for more such analysis

icici Bank channel support Long entryNSE:ICICIBANK icici Bank channel support Long entry above 1135 target 1170

ICICIBANK Intraday Levels: 24-Jun-24Stock closed near at Resistance Zone & Trendline support
Bullish > 1170
Bearish < 1150
Wait for proper rejections at zones, for entry add your strategy or indicator combination.
