ING trade ideas

WK Demand Triggered on INGWaited for last weeks candle to close, bull engulf at nested WK demand, great setup!
Price at 3M and MN demand as well. Long bias from here!

3rd Trade: ING and a Market CorrectionThe 3rd trade in the challenge is the INGA short. Recent press surrounding a money laundering investigation headed by the Dutch authorities, coupled with a weak trend, make ING Bank a perfect candidate for a short position. As previously stated i do not take a physical short, I use put options to gain exposure to the downside. With almost 40% of my £800 capital invested, I need to be sure about this trade.
Why ING Short?
B52 Trading Strategy gave a strong short on this stock with 4 different signals throughout June.
AlphaR Strategy Short signal on the 14th June
]Fundamental weakness with regulatory issues, coupled with uncertainty in the European banking sector (Brexit and Trump Trade Tariffs)
Trade Details
09/07/2018 09:26 09/07/2018 Buy 3 ING P12.00 21DEC18@0.52 EUR (NLENX5822038) ING P12.00 21DEC18 EUR -156.00
In summary i purchased 3 Dec 12.00 Puts on ING at a cost of 52c (EUR 156).

INGresistance at 14.470 is holding strong, i think we will see a bottom here and if we can see some bullish momentum from this resistance it is possible we will see 17.9 in couple of months.

ING / INGA - 3 targets04/25/2018:
Price has found support on Warningline of TrendChannel up.
Will it hold again and push to:
- € 15,50 (target 1 for long)
- € 17,50 - 18,00 (target 2 for long)
or will it fail on retest and fall to:
-€ 11,50-12,00 (target for short)

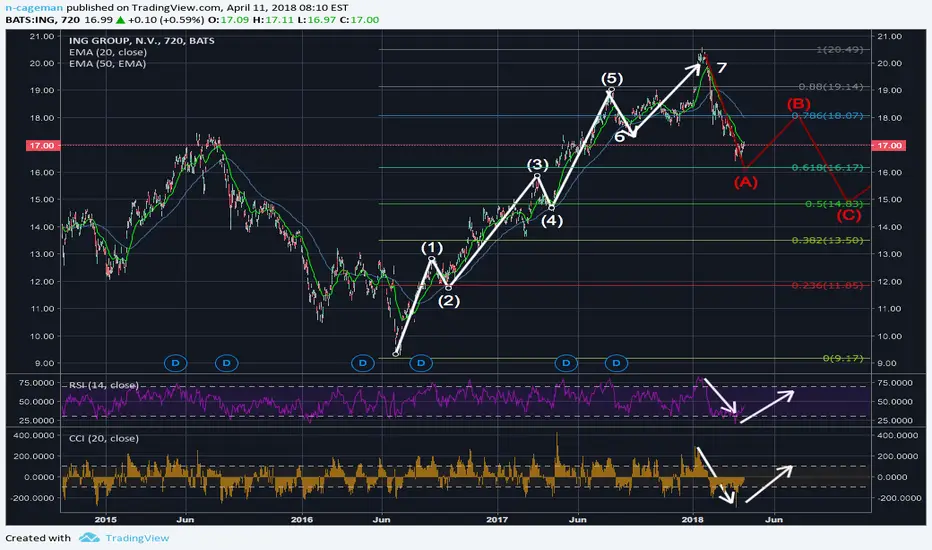
ING Started the correction in Elliot waveWe might see a long term of correction / consolidation. This can take some time however it's just a healthy market, when we go up we once have to go down as well. The indicators show the lower bottoms which results in a downtrend.
For questions please comment.
Peace out
ING / INGA - 2 scenariosWhere can price move from here? 2 logical 2 scenarios for targets and entry levels.

ING / INGA - 2 scenariosWhere can price move to from here (Close March 27, 2018)? 2 logical scenarios


INGING broke multi year resistance
strong bullish sign in my eyes and with the overall rally in banks worldwide im buying ING
just my idea, trade your own plan!

ING Channel Line BounceStochastic divergence on a channel line support. Not a big move, but it's a high percentage trade.
Buy: 18.13
Target: 18.30 - 18.57 (0.97 - 2.47%)
jbzstocks.com
@jbzstocks


ING _ yearly outlook _ short zone projection into Time&PriceAfter a strong run up from the Brexit Low in the banking stocks, ING seems to lose momentum for extra buying power. However a correction may scare out a lot bulls, it will set in the last wave leg up on the weekly timeframe.
As investors are following the information servive from TradingEcology it would be a sure thing to close out all long in the zone 15.17 - 15.55 euro
Harmonics are plotted around 15.33 euro in ING and are approved by Gann in time&price.
TradingEcology will update around 20th of March 2017 to fine tune short 'opp. in lower timeframes.
Best to your trading!

ING (NYSE) Short harmonic ratios applyNormally I look into patterns only on Dutch stocks and index, but as of Dutch ING N.V (inga) is going flat and closed today slightly higher while stochastic lowered. It got my attention to look into more detail.
The Dutch AEX-index is still going flat after hitting 484 and a bit in FTI (future contract), so did the major financial stock in the index. It goes flat, and in candle patters the valid short pattern is building up power and more power.
It may seems possible that time is not yet in place and we may have to wait till 3rd of January. However the price harmonic is perfect.
Heads up for selling into strength, point D with 14.68 dollars is an hot level, I will place my stop at 15.00 dollars or if for tape reading skills I have an ultimate stop at 15.50dollar.
In general this trade would be a good scalp based on risk:reward ratio. Even I am not confincend that we have a top in the financials yet.
Hope you like this simple analysis and you may add some thoughts below in the comment field.
Best to your trading!

ING short towards 12.18Simple analysis but more deep things are happening here as not displayed to public.
Short target 12.18
after that we target on 15.10


Short ING on 1 novemberbased on time&price a very likely short towards old top 11.60 and I would like to target 11.45 as a save exit.

ING Bear'ingNot much into harmonic theory, but this is a clear AB=CD pattern.
Strong correlation between price action and downwards pitchfork.
RSI, Stochastic, CCI, and MACD are showing signs of retreating from their overvalued status.

ING going down In short, the next few days will be in a bearish or sideways move. I'm predicting a strong correction to the median line in the next week or so

