Next report date
—
Report period
—
EPS estimate
—
Revenue estimate
—
180 ARS
−18.38 B ARS
332.69 B ARS
265.60 M
About IRSA INVERSIONES Y REPRESENTACIONES
Sector
Industry
CEO
Eduardo Sergio Elsztain
Website
Headquarters
Buenos Aires
Founded
1943
ISIN
ARP588091073
FIGI
BBG000BZW3X1
IRSA Inversiones y Representaciones SA engages in the real estate business. It operates through the Operations Center in Argentina and Operations Center in Israel segments. The Operations Center in Argentina segment operates in the following segments: shopping malls, offices and others, sales and developments, hotels, international, and financial operations, corporate and others. The Operations Center in Israel segment operates in the following segments: real estate, supermarkets, telecommunications, insurance, and others. The company was founded on April 30, 1943 and is headquartered in Buenos Aires, Argentina.
Related stocks

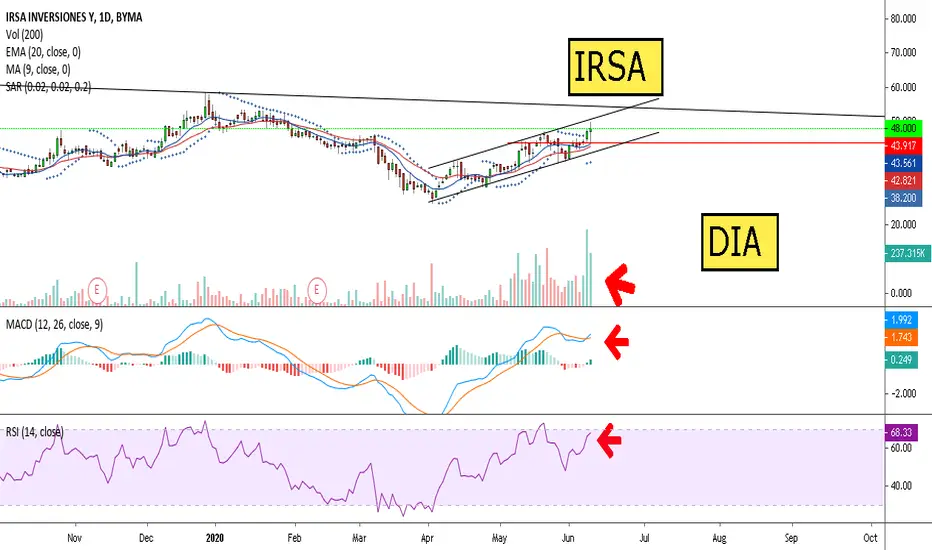
IRS - Repeating Double Bottom Swing Double Bottoms evident on chart show each time price swings upward following these bottom patterns
The first one and this current one are very similar as they are Ascending Double Bottoms, with a higher low
I expect price to rise accordingly to the pattern

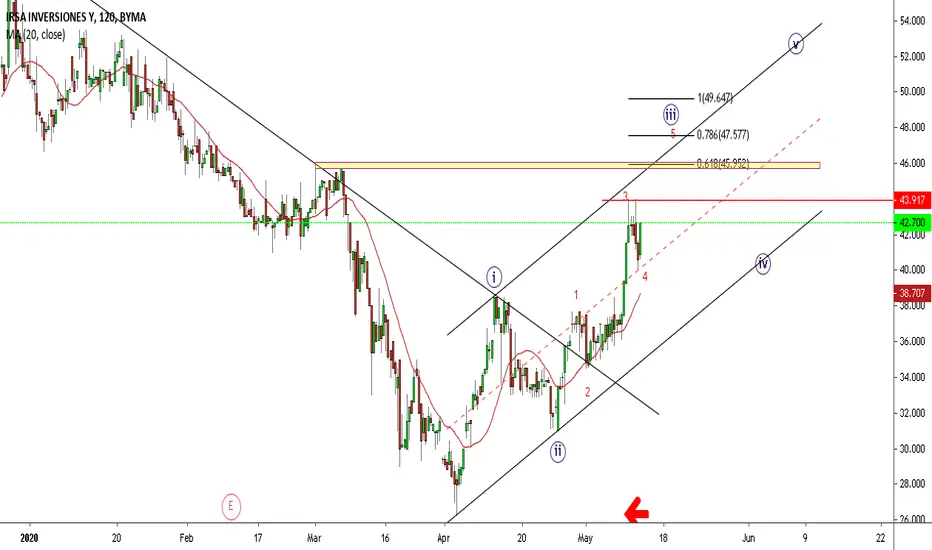
IRSA - Triangulo descendente anticipa caida de la cotizacionInversiones y Representaciones Sociedad Anónima (IRSA) formando un triangulo descendente, con base en los ARS 43, y objetivo de precios en el soporte de ARS 38,50. la figura se confirma con la caida en volumen de operaciones, asi como también la tendencia del histograma MACD y la debilidad del Deman


IRS llegando a gran soporte del 2009Semana clave para este papel ya que veremos si toma impulso en un soporte que viene desde el 2009.


See all ideas
Summarizing what the indicators are suggesting.
Neutral
SellBuy
Strong sellStrong buy
Strong sellSellNeutralBuyStrong buy
Neutral
SellBuy
Strong sellStrong buy
Strong sellSellNeutralBuyStrong buy
Neutral
SellBuy
Strong sellStrong buy
Strong sellSellNeutralBuyStrong buy
An aggregate view of professional's ratings.
Neutral
SellBuy
Strong sellStrong buy
Strong sellSellNeutralBuyStrong buy
Neutral
SellBuy
Strong sellStrong buy
Strong sellSellNeutralBuyStrong buy
Neutral
SellBuy
Strong sellStrong buy
Strong sellSellNeutralBuyStrong buy
Displays a symbol's price movements over previous years to identify recurring trends.
IRCFD
IRSA Inversiones y Representaciones Sociedad Anonima 8.75% 22-JUN-2028Yield to maturity
27.36%
Maturity date
Jun 22, 2028
CRES6039514
IRSA Propiedades Comerciales S.A.Yield to maturity
8.06%
Maturity date
Mar 31, 2035
CRES5449302
IRSA Inversiones y Representaciones Sociedad Anonima 8.75% 22-JUN-2028Yield to maturity
8.03%
Maturity date
Jun 22, 2028
IRCOD
IRSA Inversiones y Representaciones Sociedad Anonima 7.25% 23-OCT-2029Yield to maturity
5.33%
Maturity date
Oct 23, 2029
IRCJD
IRSA Inversiones y Representaciones Sociedad Anonima 7.0% 28-FEB-2027Yield to maturity
4.05%
Maturity date
Feb 28, 2027
IRCHD
IRSA Inversiones y Representaciones Sociedad Anonima 7.0% 25-JUL-2025Yield to maturity
−58.20%
Maturity date
Jul 25, 2025
See all IRSA bonds
Frequently Asked Questions
The current price of IRSA is 1,855 ARS — it has decreased by −3.00% in the past 24 hours. Watch IRSA INVERSIONES Y REPRESENTACIONES stock price performance more closely on the chart.
Depending on the exchange, the stock ticker may vary. For instance, on BCBA exchange IRSA INVERSIONES Y REPRESENTACIONES stocks are traded under the ticker IRSA.
IRSA stock has fallen by −3.78% compared to the previous week, the month change is a −1.66% fall, over the last year IRSA INVERSIONES Y REPRESENTACIONES has showed a 43.42% increase.
We've gathered analysts' opinions on IRSA INVERSIONES Y REPRESENTACIONES future price: according to them, IRSA price has a max estimate of 2,626.96 ARS and a min estimate of 2,626.96 ARS. Watch IRSA chart and read a more detailed IRSA INVERSIONES Y REPRESENTACIONES stock forecast: see what analysts think of IRSA INVERSIONES Y REPRESENTACIONES and suggest that you do with its stocks.
IRSA reached its all-time high on Nov 29, 2024 with the price of 1,985 ARS, and its all-time low was 0 ARS and was reached on Mar 2, 2009. View more price dynamics on IRSA chart.
See other stocks reaching their highest and lowest prices.
See other stocks reaching their highest and lowest prices.
IRSA stock is 6.29% volatile and has beta coefficient of 0.55. Track IRSA INVERSIONES Y REPRESENTACIONES stock price on the chart and check out the list of the most volatile stocks — is IRSA INVERSIONES Y REPRESENTACIONES there?
Today IRSA INVERSIONES Y REPRESENTACIONES has the market capitalization of 1.36 T, it has increased by 2.23% over the last week.
Yes, you can track IRSA INVERSIONES Y REPRESENTACIONES financials in yearly and quarterly reports right on TradingView.
IRSA INVERSIONES Y REPRESENTACIONES is going to release the next earnings report on Sep 9, 2025. Keep track of upcoming events with our Earnings Calendar.
IRSA net income for the last quarter is 76.60 B ARS, while the quarter before that showed 74.36 B ARS of net income which accounts for 3.02% change. Track more IRSA INVERSIONES Y REPRESENTACIONES financial stats to get the full picture.
EBITDA measures a company's operating performance, its growth signifies an improvement in the efficiency of a company. IRSA INVERSIONES Y REPRESENTACIONES EBITDA is 196.32 B ARS, and current EBITDA margin is 52.71%. See more stats in IRSA INVERSIONES Y REPRESENTACIONES financial statements.
Like other stocks, IRSA shares are traded on stock exchanges, e.g. Nasdaq, Nyse, Euronext, and the easiest way to buy them is through an online stock broker. To do this, you need to open an account and follow a broker's procedures, then start trading. You can trade IRSA INVERSIONES Y REPRESENTACIONES stock right from TradingView charts — choose your broker and connect to your account.
Investing in stocks requires a comprehensive research: you should carefully study all the available data, e.g. company's financials, related news, and its technical analysis. So IRSA INVERSIONES Y REPRESENTACIONES technincal analysis shows the strong buy rating today, and its 1 week rating is buy. Since market conditions are prone to changes, it's worth looking a bit further into the future — according to the 1 month rating IRSA INVERSIONES Y REPRESENTACIONES stock shows the buy signal. See more of IRSA INVERSIONES Y REPRESENTACIONES technicals for a more comprehensive analysis.
If you're still not sure, try looking for inspiration in our curated watchlists.
If you're still not sure, try looking for inspiration in our curated watchlists.