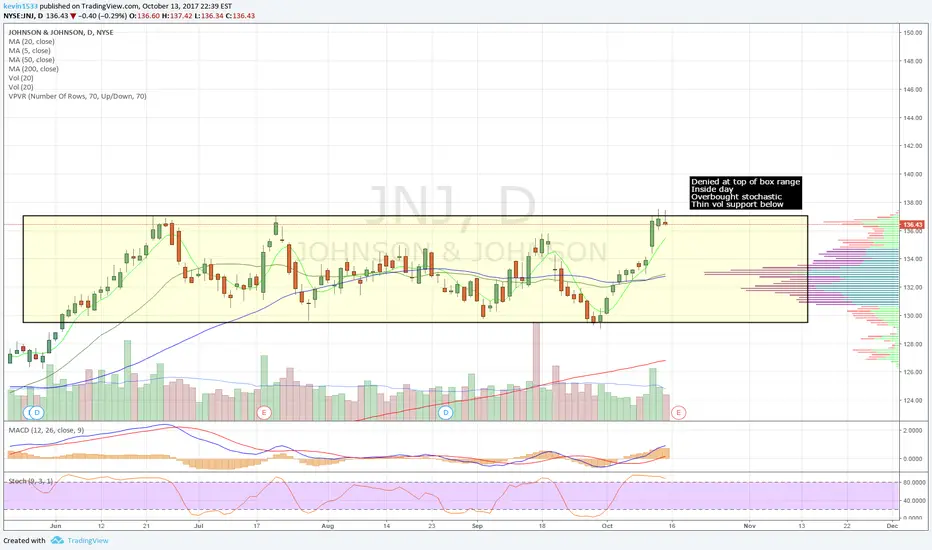
Classic Bounce after breakoutShe broke out with higher than average "bullish" volume and is currently coming down to re-test that new support on lower "bearish" volume. It might hang around this price level for a bit, but Its a good opportunity to go long around 136-138. If it manages to hold on this support level, you will see higher prices as it can continue on the upward trend channel. If not, you will probably see it come down to that 128 level.
JNJC trade ideas


Johnson & Johnson Long Setupgreat opportunity to buy and hold good accumulated from smart money and good effort departure area of re accumulation targeting 152$ then 164$

JNJ Elliott WaveLooking for a long Wave 3 to continue higher from here. There was some nice sideways action over the last few moths. Earnings came out on October 17th, sending price right through the old resistance, and initiating what I believe was leg 1 of another 5 wave move.

JNJ - RiskReversal on Johnson & JohnsonThis is my first trade I post not only here, but also on my new blog (see footer) & chat here on TV.
I start this group education on TV because I see how many traders could be more successful, if they only had more knowledge, how to trade by combining high probability strategies.
My method is the combination of the Forks and Options.
But I also trade 100% directional with the underlying, leaning on my one strategy.
If you like my style, then join the ForkTrading Method chat here on TV.
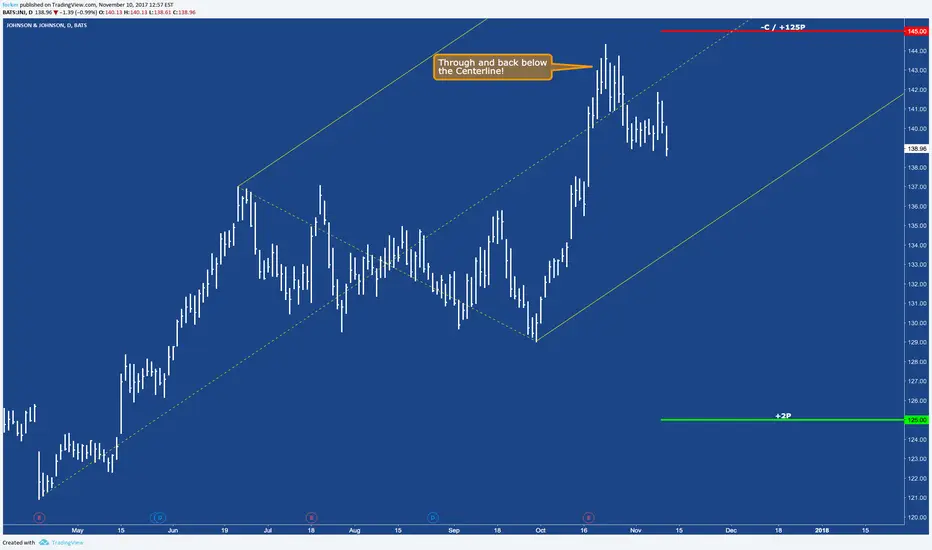
The chart shows you how I combine my Forks with Options.
Currently I see a bounce to the downside, as price leaves the Centerline.
I post a detailed description about the trade with a PNL graph on my website (see footer), so I can keep the chat as clean and lean as possible.
Always appreciate your comments, questions and constructive criticism too ;-)
P!
JNJ Good opportunity with high R/R, break out tradeHi,
The title is bullish, but now we have a small congestion.
We must await until the break out for trade, if the price goes up than we can follow the trend. If the price goes down we can make profit with the retracement.
Every levels are drawn on the imagine.

Johnson & johnson Missing a leg up?Looks like Johnson & johnson (JNJ) is heading up, to complete a 5 th wave target of 129.05$. a close below 112$ would invalidate the scenario.

Breakout & Waiting for retest to buy & hodlElliott Wave, Supply and Demand, Support and Resistance, Parallel Channel, Cup & Handle.


It's time! This idea is being spiced up now!As a reminder: Based on 17 analysts offering 12 month price targets for JNJ in the last 3 months:
The average price target is $ 147
The maximum price target is $ 165
The lowest price target is $ 110
The entry into this idea is currently at $ 144.33.
What say the technical analysis methods I use?
The risk management tool used here is the own-developed “Traffic Signals System” (TSS) and it will be implemented in my future analyses.
The yellow circle on the 11th of October in the chart indicates a possible break-away GAP for me.
The 2nd yellow circle on October 30 in the chart could be closed in a counter-movement and serve as a catalyst in the short term.
The yellow line in the chart could be a short-term support.
The black line in the chart: The starting price of the idea is $140.33.
The red line in the chart: The stop-loss is $134 (GAP of October 11, 2017).
The green line in the chart: This is in my opinion a possible first turning point in the idea = first target at about 145 US-Dollar (high October 23).
The chart-based indicators such as RSI and MACD do not show a very positive picture, but a turnaround could be ushered in.
Conclusion:
Johnson & Johnson promises pure excitement! An entry into an idea is currently made and based on the fundamental data and the news! Stay on the pulse of this idea at nextmarkets.com.
Parameters of the idea - Start Course Idea: $140.33
Recent price: $140.33 (+ 0.00% of starting price)
Stop loss currently: $134 (-4.51% of starting price)
Take Profit: $ 165 (highest short)
This idea runs since today.
Disclosure:
“Both Wikifolio's, UMBRELLA (www.wikifolio.com) and FuTureUS (www.wikifolio.com ) can be invested in Panasonic Corporation.
The trading ideas published here are neither to be understood as a recommendation nor as an offer or an invitation to buy or sell financial instruments and should not be understood as such.
You must also assume that the author holds the recommended position in his portfolio and benefits from the implementation of his trading ideas.”

Strong pharmaceutical growthJohnson & Johnson is an American multinational medical devices, pharmaceutical and consumer packaged goods manufacturing company. Includes more than 275 companies that sell its products in almost all countries of the world.
Newsflow:
Recently some good news for Johnson & Johnson!!! First of all, the Superior Court of California tossed the the record breaking cancer verdicts against J&J. This saves the company from a penalty payment up to 400 million US-Dollar.
Secondly, the company reported on October 17, 2017 Third-Quarter Results.
Sales of $19.7 Billion Increased 10.3% versus 2016. EPS was $1.37. Adjusted Third-Quarter EPS of $1.90 increased 13.1%.
Based on 17 analysts offering 12 month price targets for JNJ in the last 3 months:
The average price target of 147 US-Dollar
The maximum price target of 165 US-Dollar
The lowest price target of 110 US-Dollar
Today J&J’s stock price is about 142 US-Dollar a share.
Fundamental Data:
P/E ratio: 23.57 / Sales growth: 2.59% / Profit growth: 7.34% / Dividend: $3.15/2.21% (Source: teletrader).
Chart Tools:
What say the technical analysis methods I use?
Oscillator: The RSI of Johnson&Johnson breaks the overbought line and still forwarding in an upward direction. I consider this situation in short-term as slightly negative or neutral.
Trend indicator: In the chart with the yellow eclipse was marked the situation, when the MACD line crosses to the upside of the 9 EMA and that was a bullish opportunity setting up. MACD of Johnson&Johnson is still in the positive zone and rises above the 9-period EMA line and indicates an upward trend.
CONCLUSION:
Johnson & Johnson won on a court issue and saved 400 million US-Dollar !!!
Further, the company accelerated growth in the third quarter. This is driven by the strong performance of the Pharmaceutical business, and augmented by Actelion and other recent acquisitions across the enterprise that will continue to fuel growth, said Alex Gorsky, Chairman and Chief Executive Officer.
The fundamental growth of Johnson&Johnson is impressive! Chart-based indicators as RSI and MACD show more negative picture, because they both indicate an overbought situation for short-term traders.
Johnson & Johnson promises pure tension! An entry into a position-trade will be evaluated in the next few days depending on the chart situation!
Stay tuned for updates!
Disclosure:
“The trading ideas published here are neither to be understood as a recommendation nor as an offer or an invitation to buy or sell financial instruments and should not be understood as such.
You must also assume that the author holds the recommended position in his portfolio and benefits from the implementation of his trading ideas.”

JNJ - New all time highJNJ is at new all time high on nice earning
out of trading range with impruving volume


October 17 Earnings: Johnson&Johnson- Generic Competition GaloreJohnson & Johnson has been on an impressive intra-quarterly run with solid performance across major segments.
Strengths in the company's performance are to be driven by:
-Imbruvica and Darzalex should continue to perform well. Meaningful improvement from Stelara and Xarelto.
-New product launches like Tremfy (approved in the US late 2017 for plaque psoriasis)
-Revenue contribution from Swiss biotech Actelion, which J&J bought in June.
-Medical devices segment is expected to continue its strong growth trajectory with new product launches.
Weaknesses for the quarter are expected to be:
-Key arthritis drug Remicade to remain under pressure from generic competition.
-Invokana hurting from higher managed care discounting.
-Sluggish FDA review requiring more information before approving new drug treatments.
-Lawsuit from Pfizer to be clarified during the conference call.
Overall, I believe high expenses and generic competition will overcome the positives for the quarter.
I'm starting Johnson&Johnson with a $130 PT for the post earnings move with a tight but flexible 2.5% stop.


JNJ, waiting for the breakoutJNJ is consolidating the previous bullish movements by moving in a sideways parallel channel. If the stock breaks lower the minimum target is around 126 and if the bearish movement goes on the T2 would be around 122. If the stock breaks higher, then the target is around 144. The breakout must be confirmed by very high volume. If it doesn't, it may be a fakeout.
The informations and the strategies discussed are strictly for educational and illustrative purposes. They are not a
recommendation to buy, sell or trade any securities.

