JPMD trade ideas


JPMJPM Long🚀📊
It is not financial advice. This is my opinion. Please check yourselves and invest in the symbols in which you think have a huge opportunity to reach the best results.
please leave us your opinion and reviews.🙏
Good Luck 👍

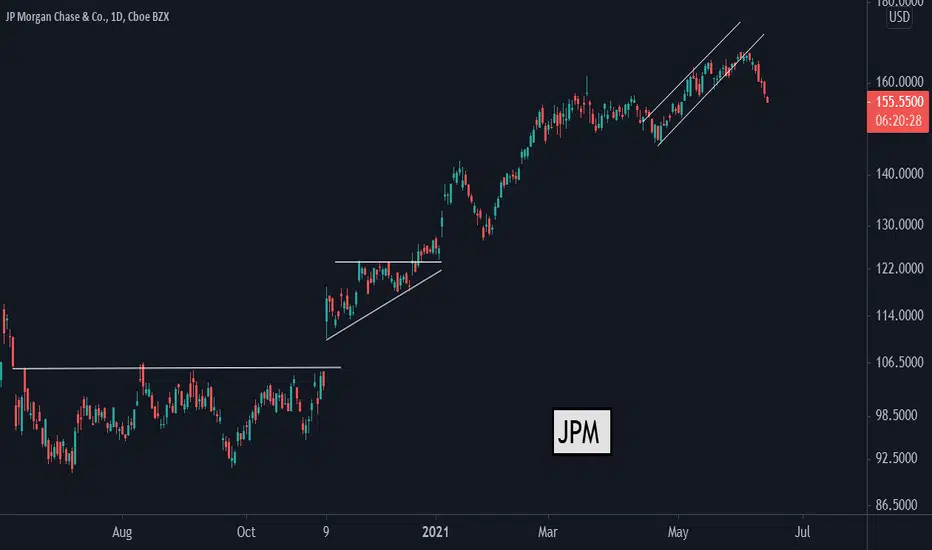
Cup and HandleJPM has been a cup and handle for quite a while. Earnings 7-13. Sometimes it is difficult to trade a security when earnings are around the corner. Folks sometimes sell due to fear of the event and how the news will be received.
Strange looking top but keeps on going.
Odd formation (flag or channel up?) recently at the bottom of the last pull back which is a sharp pull back almost like a pole but downward. I would not deem to label this as folks are very bullish on JPM (o:
Pocket pivot not far below price.
The reaction to the news is often more important that the news itself.
No recommendation

-23 juni 2021 trading analysis JPM
-23 juni 2021
trading analysis JPM
Disclaimer:
This information is for educational purposes and is not an investment recommendation or representative of professional expertise. This analysis used herein is for illustration purposes only. This personal opinion should not be considered specific investment advice. I am not responsible for any trades, and individuals are solely responsible for any live trades placed in their own personal accounts.
- - - - - - - - - - - - - - - - - - - - - - - - - - - - - - - - - - -
good luck, and happy profit
see you for next update
#keep learning bakkarianz metode

JPM D1Goldman Sachs (NYSE: GS) bought a security with a reverse sale commitment through smart contracts on the Onyx blockchain. Bloomberg writes about this with reference to an American bank.
The first deal took place on June 17, when Goldman traded a tokenized version of a U.S. Treasury bond for a digital version of the dollar, JPMCoin. Matthew McDermott, head of digital assets at Goldman, declined to disclose the size of the deal.
“This is a turning point for us in the digitalization of transactions,” McDermott said.
Unlike traditional repo, on the blockchain it is possible to calculate the time to complete an operation. For example, in the case of Goldman, the repo transaction took 3 hours 5 minutes. Timing is important because banks pay interest on a per-minute basis, McDermott said.
“We strongly believe this will change the nature of the intraday market,” he added.
The JPMorgan blockchain is built on the Ethereum ecosystem. It is reported that the bank has been conducting daily trades through it in the amount of more than $ 1 billion since December 2020. JPMorgan spokeswoman Jessica Francisco said the bank is already in talks with more than 10 clients from among the banks to join the repo blockchain network.
This is not the first blockchain development by JPMorgan. In August last year, an American bank sold its Quorum blockchain network to Ethereum incubator ConsenSys. As part of the deal, JPMorgan even invested in ConsenSys itself, but financial details remain unknown.

Neckline has HeldJPM formed a head and shoulders pattern, proceeded to hit the neckline and bounce back to surpass the head of the pattern.
Approached neckline once again and bounced off.
The neckline is a very strong source of support.
I did this chart a while back (4-21 to be exact) but did not post it because I had a funny feeling the head and shoulders would fail, and it did. Head and shoulders patterns often do fail in a bull market. The support could hold. Just watching with curious eyes (o: Appears today's candle filled the gap down. Almost looks like another H&S formed at the last top, but there may be no stopping JP for now (o:
No recommendation.
There is always a right choice, plus all the others.


possible Head n Shoulders on JPM dailyPossibly head and shoulders may be forming on the D, we recently seen distribution before this sell off. Volume and price action will give us a better look. What do you think?


JPM longI think that this stock is a great investment long term. So my thought process is that as a young individual I should wait for a great opportunity to buy in and hold for the long term to make more profits. The NASDAQ is also at highs so an eventual setback will affect the stock as well and that will be a good opportunity to buy in and hold on forever in my opinion

JPM to $156, then $128JPM should close this week on daily chart at about $150. In the next few weeks I’m expecting price to hit $147, then bounce back to about $156 to create right shoulder of H&S formation. This would signal lower price in the coming months. Minimum price target of $128 once neck of $147 is penetrated to the downside. We can also expect $116 being reached further down the line, but that’s TBD.
This is in line with my analysis on financial sector using XLF ETF as a base (in linked article). It’s going to be interesting how big of an impact it will have on SPY.


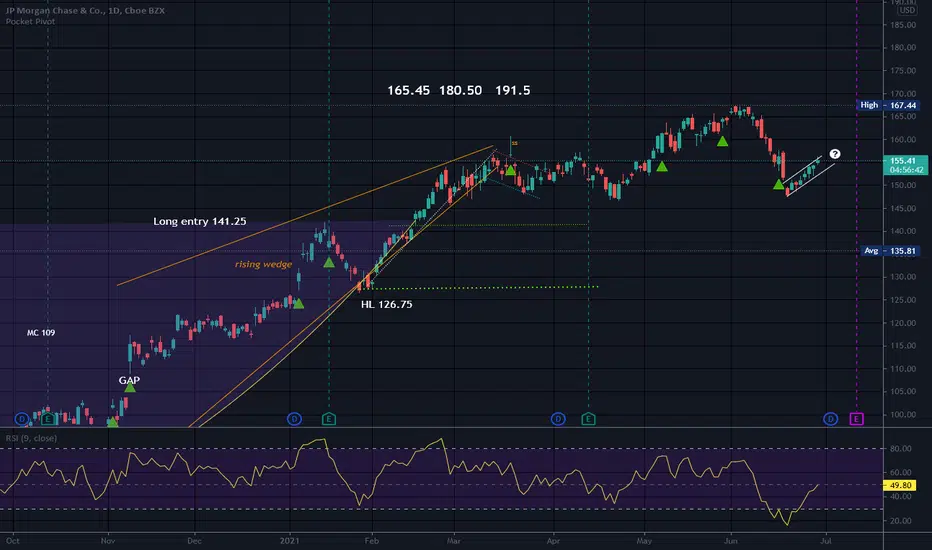
JP Morgan Chase & Co. bearish scenario:We have technical figure Rising Wedge in US company JPMorgan Chase & Co . ( JPM ) at daily chart . JPMorgan is an American multinational investment bank and financial services holding company. The Rising Wedge has broken through the support line at 15/06/2021, if the price holds below this level we can have possible bearish price movement with forecast for the next 30 days towards 146.13 USD. Our stop loss order should be placed at 167.44 EUR if we decide to enter this position.

JPM ONG SHOTCrossig ichimoku clouds, , nice green bar, also doing a pull back on previous support zone
Price Target $170- $190 (Wells fargo - DA Davidson - Piper Sandler - Jefferies)

JPM: Closing Half For $7The share just outside of our short/sell target, with $7 gained thus far.
Traders could look to take half off here and reduce further into the target range.
Things Looking Up for JPM this Summer?Based on historical movement, the trough could occur anywhere in the larger red box. The final targets are in the green boxes. The pending top should occur within the larger green box as has been the historical case. Half of all movement has ended in the smaller green box. In this instance, the signal indicated BUY on June 11, 2021 with a closing price of 159.92 on the hourly chart.
If this instance is successful, that means the stock should rise to at least 161.6855 which is the bottom of the larger green box. Three-quarters of all successful signals have the stock rise 2% from the signal closing price. This percentage is the bottom of the smaller green box. Half of all successful signals have the stock rise 3.7815% which is the end point of the black dotted arrow. One-quarter of all successful signals have the stock rise 5.577% from the signal closing price which is the top of the smaller green box. The maximum rise on record would see a move to the top of the larger green box. These are the same concepts for the levels in the red boxes as well.
The ends/vertical sides of the boxes are determined in a similar fashion. The peak of the rise can occur as soon as the next trading bar after signal close, while the max rise occurs within the limit of study at 50 trading bars after the signal. A 0.4% rise must occur over the next 50 trading bars in order to be considered a success. Three-quarters of successful movement occur after at least 23.5 trading bars; half occur within 36.5 trading bars, and one-quarter require at least 44.5 trading bars.
The black dotted arrow represents median historical movement. Medians are a good metric, but they are just one of many I use when forecasting future movement.
As always, the stock could decline the very next bar after the signal without looking back (therefore the red boxes would not come into play) or the stock may never decline (and the green boxes may never come into play).

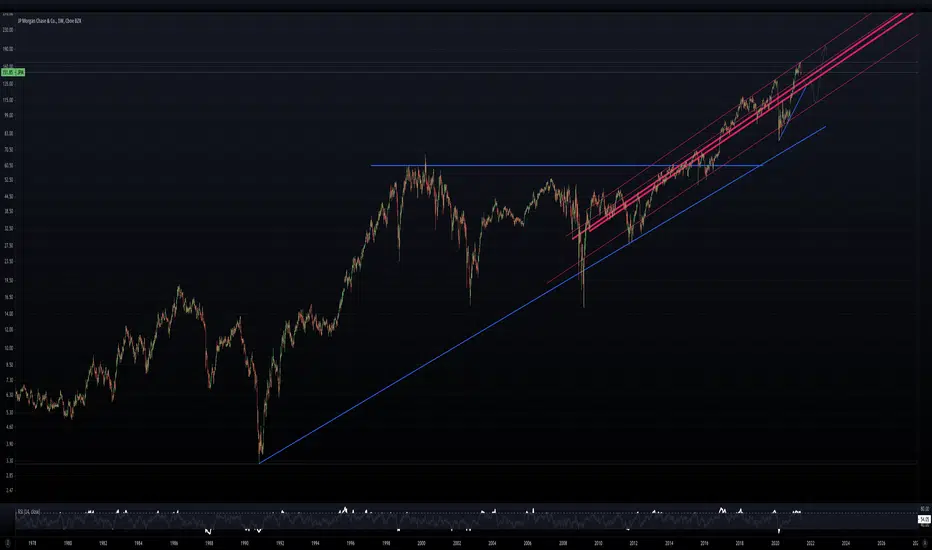
JPM hot run slowing down?Since fall of 2020 financials sector has been one of the leading drivers behind SPY run. JPM one of top stocks in finance sector has been on a tear as well.
In Nov price finally broke multi year long resistance around $117. Typically violated resistance levels are retested and act as a support. Worth noting 200 weekly MA is getting close to that level.
Will price retrace to test $117 anytime soon? Short answers: it’s definitely possible.
Detailed answer: current trend is showing signs of slowdown and a bit of weakness:
- Week of March 15 price tested another multi year resistance line on high volume, created a doji and closed lower than opened (can be seen on candlestick chart)
- since week of Mar 15 volume has seen significant decline
- PPO has been trending lower, and created negative divergence with price action.
All this eludes to some sort of a pullback. It would have to be almost (30%) decline from current highs to reach $117. It makes sense for this to happen in the foreseeable future, considering other option being price climbing higher and then eventually taking even larger dive down to reach $117. I am watching PPO in case it reverts back to the uptrend, along with higher volumes to signal higher prices.

Rising wedge JPMorgan bank of America Showing same pattern.. this is important because bank stocks played a big part in the spy making news this year along with cyclicals as tech declined.
Resistance is at 167.90
targets are green lines
Overbought On weekly RSI


Technical Trade Setup: JP Morgan - Hitting Resistance & -Ve DivSell NYSE:JPM
Current level: $163.86
- Hitting Resistance & -Ve Divergence
- Potential channel break (Line A_B)
Trade Levels:
Sell/Short Range: $163.80-$164.60
Stop-loss: $167.80
Target Range: $152 - $154
