JPM getting squeezedcoiling with in the range. It can break either way depending on how it breaks and market condition.
JPMD trade ideas


JPM to resolve. JPMorgan continues in a bearish channel with a short range between 96 and 106 dollars. We can to see a sort of triangle can to resolve bullish, but the international economic context seems to dilate the recovering of the financial sector. However, if you go to long then, clearly, this moment is an opportunity to buy and hold.


JPM Long PotentialFinancials look strong. Watching for a potential breakout from the stronger banks (GS, JPM) as XLF tests the 200. The market cannot recover without financials and tech has gotten love for too long. Let's see what happens.

JPMORGANThe banker in short or long always win
Long Run bullish until the whole break down or brake down...
See what´s next...
See you later!

JPM: Looking for a new high in Wave 5I use Elliott Wave analysis in combination with fibonacci ratios of extension and retracement. JPM new high incoming, to touch at least the 1.618 fib extension at $128

Symmetrical Triangle ABC BullishBullish Chart but find a good entry for you if you want to buy this stock. Always do your research and remember targets 2 (T2) can be a long time coming and may not come. I keep my eyes on T1 then I worry about T2. If a stock becomes overbought etc..use your trading skills. IE..I bought PCAR. The stock made it to 91.27 and it was extremely overbought. I sold it at 91 and bought it again on the pull back. PCAR did not make it to targets of 93.27 100 and 106 without becoming extremely overbought. It just depends I guess and nothing is written in stone.
It appears there is a market rotation going on. But things are not as they appear so I always tip toe as of late
Short interest low
Watch out for market volatility. There is an awful lot going on in our world right now
Targets and long entry possibilities listed on chart for both patterns.
Possible stop below 90.7
Be safe
Not a recommendation

Sector Rotation?XLF seemed to avoid selloffs on Thursday/Friday where the rest of the market couldn't. Looking for further confirmation Tuesday/Wednesday 9/8 & 9/9


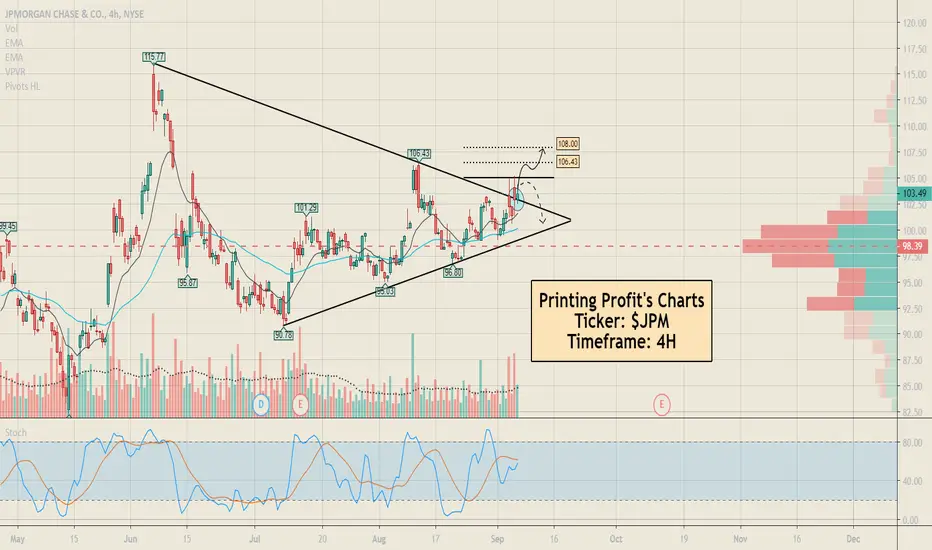
$JPM Triangle BreakoutJPM closing the week above our triangle breakout... however we need 105 to see higher. Above 105 my main price target is 108

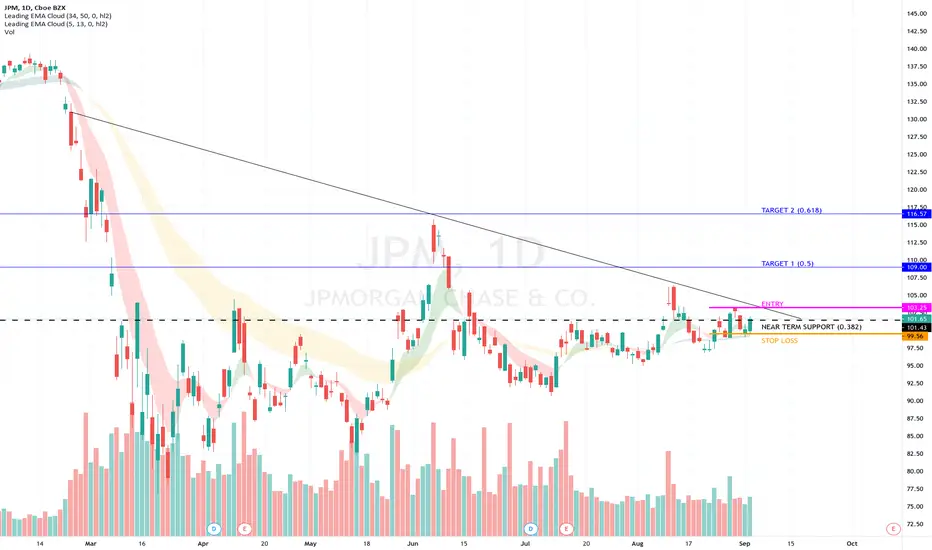
JPM long entry with break of downtrend lineA downtrend line has been forming since pre-COVID highs forming a solid setup. Recent highs over $106 failed to break upwards, a break out of the downtrend can see targets above, with the marked fib close as the support below. Stop loss set below the lows of the most recent daily candle.

Potential buy in JP Morgan ChaseUsing pivot points, institutional price (100), moving averages (8, 20, 200 and 2000) and market geometry. Analysis in 4 temporalities: 1d, 30m, 15m and 5m.

JPMORGAN LONG POSITIONANALYSIS ON 1 HOUR CANDLE
USING ELLIOT WAVES, INSTITUTIONAL LEVELS AND FIBONACCI RETRACEMENT.
LONG POSITION (PE: 100.00, SL: 91.25, TP:125.00)

jpmorgan dale que vastoch leve abajo de 50.. dmi por abajo de 25... adx bajando perdido fuerza. positivo histograma de macd y la linea principal en aumento pero aun no puede pasar el 0. rsi clavado en 50. clara tendencia alcista.. viene con buen volumen. le meto una moneda...

JPM Banking Recovering (Burrr Powell Printing Machine)JPM remains in uptrend channel after march sell-off recovery, if you like banks or wants to get dividends it might be a good choice.
Support area around $95, resistance around $100, a solid week above $100 or going above MA 200 is considered positive sign.
Please Drop a Like or Dislike, Share your opinions, Not investment advice please seek professionals


JPMorgan Holds the 50-day as Curve SteepensTechnology stocks have undeniably led the market for several months. However the banks are showing signs of strength.
JPMorgan Chase has been quietly making higher lows along its 50-day and 100-day simple moving averages (SMAs). That suggests its intermediate-term trend is at least neutral, and possibly nearing a bullish state.
In and of itself, the chart is still inconclusive. But another chart, 30-year Treasury Yields , could add a fundamental reason to consider the banks. As we highlighted on August 10, bond prices were slamming into resistance as the economy showed signs of rebounding from coronavirus. (That pushes yields higher.) Jerome Powell’s new commitment to hotter inflation might also keep upward pressure on long-term rates.
The result could be a push/pull from the Fed. Inflation pushes long rates higher as the FOMC's target range pulls short rates lower.
That’s potentially a positive environment for banks like JPM that profit from a steeper yield curve. It could also get a cyclical boost if the economy continues to recover. (The second item on Powell’s agenda was a recovery in the job market.)

JPM 131JPM 131
Current Price: 99.09$
Price target: 131.17$
% Increase: 32.3%
Timeframe: October 13
Confidence Level: Very High

JPM Bullish sentiment coming Waiting for October may be the best scenario to have some #JPM stocks
As it recovers from the Corona sentiment
