MCD - Expanded flat likely completed Mcdonald's NYSE:MCD is looking at a resumption of the uptrend after price action indicates a strong bullish rebound at 123.6% extension of wave A-B (US$282.71). We believe further upside is likely to continue as Stochastic has shown clear oversold confirmation signal. Volume is also in a healthy position.
Strategy
Buy spot @ 302.67 or buy stop above 303.00. Limit buy @ 286.04 support in the event of a correction.
1st Target is at 311.50 (Est 1 month)
2nd Target is at 341.00 (Est 2-5 months)
3rd Target is at 360.00 (6 months and beyond)
MCDD trade ideas

McDonald's Signals Long Trade Opportunity: Bullish Momentum MounCurrent Price: $297.07
Direction: LONG
Targets:
- T1 = $305.50
- T2 = $312.00
Stop Levels:
- S1 = $294.00
- S2 = $290.00
**Wisdom of Professional Traders:**
This analysis synthesizes insights from thousands of professional traders and market experts, leveraging collective intelligence to identify promising trade setups. The wisdom of crowds principle indicates that aggregate perspectives often outperform single forecasting efforts—helping detect potential bullish movements in McDonald's.
**Key Insights:**
McDonald's has recently benefited from strong consumer demand in its core markets, bolstered by ongoing economic recovery trends and increased spending in the dining-out segment. The company's strategic pricing adjustments and menu innovation continue to attract new customers while retaining long-term loyalty. Technically, the stock is showing robust momentum, with moving averages aligning positively to support upside potential.
Investor sentiment around McDonald's remains optimistic amid its ability to weather inflationary pressures better than many competitors. Furthermore, labor cost efficiency and supply chain stability highlight operational success, strengthening its fundamental case for a long-term bullish bias.
**Recent Performance:**
The stock has recovered steadily from its mid-year slump, advancing over 10% in the last quarter. Over the past month, McDonald's shares have shown resilience during periods of broader market volatility, making new highs amid strong earnings reports and upbeat guidance. Its price is testing major resistance levels—a breakout could signal sustained upward movement.
**Expert Analysis:**
Technical experts point to a rising RSI (Relative Strength Index), suggesting no overbought risk, while MACD crossover confirms bullish tendencies. Support levels identified around $290 provide an attractive risk-reward ratio for long positions. Analysts emphasize McDonald's 2023 growth prospects, driven by innovation in product offerings and enhanced digital ordering platforms.
**News Impact:**
Recent news highlighting McDonald's expansion in international markets, particularly Asia-Pacific, adds further optimism to investor outlook. Regulatory adjustments easing food imports and operational barriers have been positive for sales growth abroad—building momentum for stronger quarterly performance. Moreover, partnerships with third-party delivery services keep McDonald's positioned for incremental revenue growth.
**Trading Recommendation:**
Traders should consider taking a long position at current levels, targeting $305.50 and $312.00. Set clear stops at $294.00 and $290.00 to manage downside risk. The bullish technical setup, coupled with favorable fundamental drivers and steady global expansion strategies, makes McDonald's a compelling short-to-medium-term investment opportunity.

The key is whether it can be supported and rise near 300.17
Hello, traders.
If you "Follow", you can always get new information quickly.
Have a nice day today.
-------------------------------------
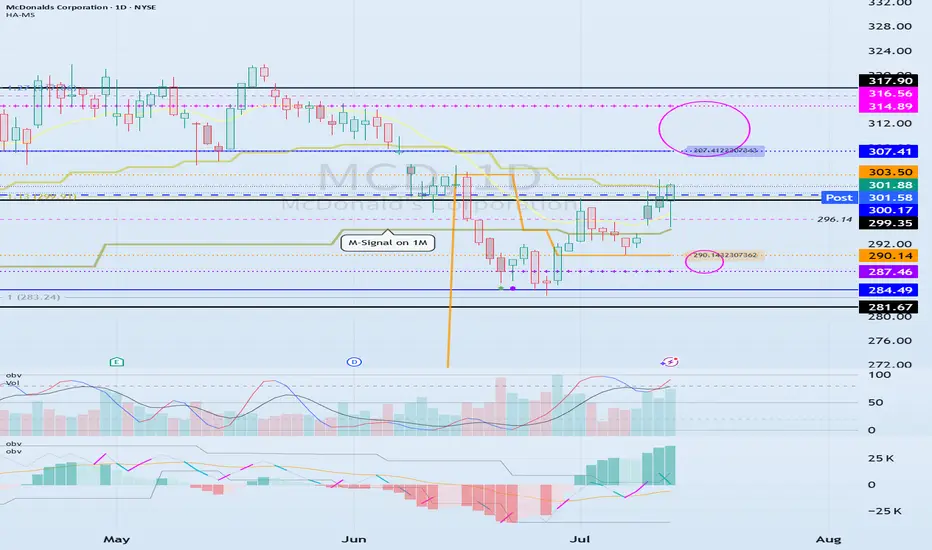
(MCD 1D chart)
Before following the basic trading strategy, the first thing to check is whether the current price is above or below the M-Signal indicator on the 1M chart.
If the price is below the M-Signal indicator on the 1M chart, there is a possibility that it will turn into a medium- to long-term downtrend.
Therefore, if possible, it is recommended to trade stocks whose prices are above the M-Signal indicator on the 1M chart.
If the price is below the M-Signal indicator on the 1M chart, you should respond quickly and briefly using the short-term trading (day trading) method.
-
The support and resistance zones can be seen as the 287.46-290.14 zone and the 307.41-314.89 zone.
The 287.46-290.14 zone is the DOM(-60) ~ HA-Low zone, and the 307.41-314.89 zone is the HA-High ~ DOM(60) zone.
These two zones are likely to form a trend depending on how they break through, so they can be seen as support and resistance zones.
-
The 300.17-316.56 zone is the HA-High ~ DOM(60) zone on the 1W chart.
Therefore, we need to check whether it can receive support and rise in the 300.17-316.56 zone.
Therefore, if it falls near the 307.41-314.89 range, you should check for support near 300.17.
-
If it rises above the HA-High ~ DOM(60) range, it is likely to show a step-up trend, and if it falls in the DOM(-60) ~ HA-Low range, it is likely to show a step-down trend.
-
Thank you for reading to the end.
I hope you have a successful transaction.
--------------------------------------------------
I'm McShortMcDonalds has received a few downgrades recently and I think we see it retest $280, followed by $260.
Not financial advice, good luck to all

McDonald 1H Long PositionMy self-built strategy has sent me a signal for a long position. I bought a tranche of NYSE:MCD long and will be targeting the upper gaps as my profit targets. The first station will be around $306, and the second target lies between $318 and $319. Currently, the 1H chart is forming a nice divergence and had a huge volume spike, and my strategy indicates a high probability setup for this chart.
Given the current market volatility, I’ll be keeping a close eye on my open position to be able to react quickly if needed.
McDonald (MCD): Near Critical Trendline Support Overview: McDonald's (MCD) on the daily chart has been consolidating within a broad range after a significant uptrend. The stock is currently trading at a pivotal point, testing a long-standing ascending trendline that has supported its bullish movement. Bearish pressure is evident from repeated rejections at a key resistance zone, suggesting a potential shift in market sentiment.
Context & Price History:
Ascending Trend: From approximately July 2024, MCD embarked on a strong uptrend, consistently finding support along the depicted blue ascending trendline. This indicates underlying bullish momentum and buyers stepping in on dips.
Major Resistance Zone (317 - 323): Since late 2024, MCD has repeatedly faced strong selling pressure in the 317 to 323 range, labeled as "320". This area has acted as a formidable ceiling, preventing further upward progression. We can observe what appears to be a multi-peak formation (potentially a triple top) at this resistance, a classic bearish reversal pattern.
Consolidation: Following the initial uptrend, the price action has entered a consolidation phase, oscillating between the "320" resistance and the rising trendline support.
Key Levels & Patterns:
Ascending Trendline (Blue Line): This is the primary support for the current market structure. A break below this line would signal a significant shift in the trend.
Major Resistance Zone (Red Shaded Area): Strong supply zone between $317 and $323. Multiple rejections here indicate significant selling interest.
Immediate Support Zone (Green Shaded Area): Around $290, this level represents the next key horizontal support below the trendline.
Key Level Support (Deep Green Shaded Area): A broader support range between $270 and $280. This area could provide strong demand if the stock experiences a deeper correction.
Minor Resistance/Bounce Point (Labelled 310): While not a strong horizontal support currently, the "310" label aligns with potential prior horizontal action and is shown as a retest point in the projected bearish scenario.
Current Situation: MCD is currently trading around $303.21. It has seen a sharp decline from the 317-323 resistance zone and is now directly approaching the confluence of the ascending trendline and recent lows. The highlighted blue circle indicates this critical area.
Potential Scenarios:
Bearish Breakdown (Primary Indication on Chart):
Breakdown Confirmation: If MCD fails to hold the ascending trendline support and closes convincingly below it (e.g., below $300), especially with increased volume, it would confirm a bearish breakdown.
First Target: The immediate target for bears would be the $290 horizontal support zone.
Second Target: If 290 fails to hold, the price could then move lower towards 270 to $280.
Bullish Reversal / Trendline Hold:
Reversal Confirmation: If MCD finds strong buying pressure at the current trendline support, we could see a bullish reversal candlestick pattern (e.g., a hammer, bullish engulfing, or morning star).
Upside Potential: A successful bounce could lead to a retest of prior minor resistance around the
310 and then towards 320
Trend Continuation: A decisive break above the $323 resistance would invalidate the current bearish pressure and signal a continuation of the broader uptrend.
Conclusion:
MCD is at a crucial juncture. The repeated rejections at the 317-323 resistance zone and the current approach to the ascending trendline indicate a potential for a significant directional move. Traders should closely monitor price action around the trendline. A break below opens the door for a move to 290 and potentially 270-280, while a strong bounce could see a retest of the higher resistance levels.
Disclaimer:
The information provided in this chart is for educational and informational purposes only and should not be considered as investment advice. Trading and investing involve substantial risk and are not suitable for every investor. You should carefully consider your financial situation and consult with a financial advisor before making any investment decisions. The creator of this chart does not guarantee any specific outcome or profit and is not responsible for any losses incurred as a result of using this information. Past performance is not indicative of future results. Use this information at your own risk. This chart has been created for my own improvement in Trading and Investment Analysis. Please do your own analysis before any investments.

Is the Golden Arches Losing Its Shine?McDonald's, a global fast-food icon, recently reported its most significant decline in U.S. same-store sales since the peak of the COVID-19 pandemic. The company experienced a 3.6 percent drop in the quarter ending in March, a downturn largely attributed to the economic uncertainty and diminished consumer confidence stemming from President Donald Trump's tariff policies. This performance indicates that the unpredictable nature of the trade war is prompting consumers to curb discretionary spending, directly impacting even seemingly resilient sectors like fast food through reduced customer visits.
The link between sinking consumer sentiment and tangible sales figures is evident, as economic analysts note the conversion of "soft data" (sentiment) into "hard data" (sales). While some commentators suggest that McDonald's price increases have contributed to the sales slump, the timing of the decline aligns closely with a period of heightened tariff-related anxiety and a contraction in the U.S. economy during the first quarter. This suggests that while pricing is a factor, the broader macroeconomic environment shaped by trade tensions plays a critical role.
In response, McDonald's emphasizes value offerings to attract and retain customers navigating a challenging economic landscape. The company's struggles mirror those of other businesses in the hospitality sector, which also report reduced consumer spending on dining out. The situation at McDonald's serves as a clear illustration of how complex trade policies and the resulting economic uncertainty can have far-reaching consequences, affecting diverse industries and altering consumer behavior on a fundamental level.

The 3 Step System Used To Buy This Stock Trying To forgive someone is very hard for me because I am emotional.Once a person disappoints me it's hard to trust that person again.
And because I enjoy keeping people accountable.Its not safe for me to enter that zone when I have not forgiven them.
So before I hold an account on anyone I need to make sure I forgive them first because emotions cloud judgement.
Even in trading your emotions will cloud your judgemental thinking.This is why I designed this system.
To cut out the extra fat from whatever strategy you decide to use.
It has 3 Steps:
👉Price has to be above the 50EMA
👉Price has to be above the 200 EMA👉Price should Run up or Gap up*
*This means the price should show you a sign of a trend upwards
This chart has fit all 3 Steps ✅
This is called the "rocket booster strategy "
To learn more 🚀 Rocket Boost This Content.
Disclaimer ⚠️ Trading is risky please learn more about risk management and profit taking strategies. Also feel free to use a simulation trading account before you use real money.

McDonald's Corporation (MCD) – Lovin’ the GrowthCompany Snapshot:
McDonald’s NYSE:MCD is the undisputed global leader in quick-service restaurants, with over 40,000 locations worldwide and a brand that resonates across generations. The company blends cultural relevance with operational excellence, continuously innovating to stay ahead of changing consumer trends.
Key Catalysts:
Pop Culture Marketing Wins 🎯
The Minecraft-themed Happy Meal creates emotional connection with younger audiences
Drives family traffic, social media buzz, and larger basket sizes
Reinforces McDonald’s strategy of tapping into nostalgia + digital engagement
Smart Value Play 💸
The $5 combo hits at the perfect time amid inflationary pressure
Maintains volume without sacrificing margin, appealing to price-sensitive consumers
Combines affordability with iconic menu consistency
Financial Strength & Dividend Power 💼
Over $214B market cap and reliable free cash flow engine
A favorite for dividend growth investors, with a track record of consistent payouts
Strong global real estate holdings provide stability and leverage for expansion
Tech-Driven Operations 📲
Continued investment in mobile app, AI drive-thru, and kitchen automation
Enhances customer experience and boosts operating efficiency
Investment Outlook:
✅ Bullish Above: $278.00–$280.00
🚀 Upside Target: $370.00–$380.00
📈 Growth Drivers: Digital engagement, brand partnerships, resilient demand across economic cycles
📢 MCD: A timeless brand evolving with the times—one meal, one moment at a time.
#MCD #Dividends #BrandPower #FastFoodInnovation #PopCultureMarketing

Comprehensive Research - McDonald’s Stock Set to SoarQuick read:
McDonald's stock is poised for a bullish move, with Wave 3 likely starting and strong support near 290.50–295.00. Traders should long on dips within this range, for next resistance levels, 326.00 and 348.00 with a invalidation below 276.00. This setup offers a solid risk-to-reward in a long-term uptrend. Alternative safe entry is possible after the break of corrective channel breakout of wave (2).
Elliott Wave Forecast:
TF - Daily
The chart suggests that McDonald’s stock is in the middle of a larger upward move known as Wave C, which comes after completing a complex correction. Wave C is expected to unfold in five smaller waves, a pattern that usually points to a strong uptrend. It appears the correction is behind us, and a fresh bullish phase is underway.
Starting from the low at 276.53 , marked as Wave B, the price climbed to 326.32 , forming Wave one. After that, the stock pulled back to 290.50 , forming Wave two. This pullback followed a typical ABC pattern within a corrective channel, which often signals the end of a downturn and the beginning of an upward move.
Now, Wave three seems to be starting, and this is usually the strongest part of Wave C. The price is expected to move above 335 , take a small pause for Wave four, and then rise again to complete Wave five somewhere around 345 to 350 dollars. This positive outlook remains intact as long as the price stays above 290.50 . With the breakout from the corrective channel, the setup looks strong and clear for buyers.
Fibonacci levels:
Fibonacci Extension Targets:
1.000 extension: 326
1.618 extension: 348
Correction Retracement Levels:
Wave 2 retracement: 78.6%
A = C in A-B-C correction: 289.21
Price Action & shifting of value:
TF: Weekly
McDonald’s stock has been steadily climbing inside a rising channel since late 2020, showing a clear long term uptrend. The price has respected both the top and bottom edges of this channel very well, and interestingly, the middle line has acted like a pivot, providing support or resistance multiple times over the years.
Recently, the stock made a higher low at 276.53 and bounced back strongly, keeping the bullish structure intact. It then pulled back to 290.50 , right around the middle line of the channel, and held above an upward sloping trendline. This kind of price action shows strength and suggests buyers are stepping in.
The sharp move from 276.53 up to current levels looks like a strong bullish leg, possibly driven by accumulation. If the stock can break above its recent high of 326.32 , it could head toward the upper end of the channel. As long as the price stays above 290.50 and especially above 276.53 dollars, the bulls remain in control. Even if the price dips a bit, the long term trend stays positive unless the lower boundary of the channel breaks down.
I will update more Information here.

McDonald's (MCD): Digital Expansion Fuels Stock StrengthMcDonald’s Corporation (MCD) is one of the most recognized global fast-food brands, known for its burgers, fries, and drive-thru convenience. With thousands of locations worldwide, McDonald’s continues to grow through menu innovation, digital ordering, delivery partnerships, and modernized restaurants. Its strong brand loyalty and focus on speed and consistency keep it competitive in the quick-service space, especially as global demand for affordable and reliable meals stays high.
The stock chart recently showed a confirmation bar with increasing volume, pushing the price into the momentum zone—defined as when the price breaks above the 0.236 Fibonacci level of the current trend. This pattern suggests rising investor confidence and the potential for continued upward movement if bullish momentum holds.

$MCD with a bullish outlook following its earnings #StocksThe PEAD projected a bullish outlook for NYSE:MCD after a positive under reaction following its earnings release placing the stock in drift A with an expected accuracy of 66.67%.


McDonalds is a beast, but short term price dropI love MCD and will always love to eat and trade.
For me MCD is like water ETF. Automation will increase the profits in the future...
BUT price of the stock won't increase more in short term...It will drop.
It is not an investment nor trading advice do your own analysis. I am not responsible for your losses.

McDonald’s Builds Momentum After Quarterly ResultsMcDonald’s share price has been stuck in the slow lane for months, but its latest earnings report has given the stock a much-needed boost. A stronger-than-expected sales performance saw shares jump nearly 5% during yesterday’s session, signalling that investors are starting to take notice again.
Quarterly Results: Signs of a Turnaround
McDonald’s reported a 0.4% rise in global comparable sales for the fourth quarter, a sharp contrast to the 0.4% decline analysts had been expecting. The recovery was driven in part by a stronger performance in international markets, particularly in the Middle East, where sales have improved following last year’s boycott-related weakness. While total revenue remained flat at $6.4 billion, the market’s reaction suggests confidence in the company’s ability to navigate recent challenges.
The US market was a notable weak spot, with comparable sales falling 1.4% as customers reined in spending. An E. coli outbreak in late 2023 also took a toll, temporarily forcing restaurant closures in some states. However, McDonald’s expects US sales to stabilise by Q2, helped by continued promotions and a steady recovery in footfall. Despite these near-term pressures, the latest figures suggest that the worst may be behind the company.
Technical Analysis: Momentum Building Again
McDonald’s share price has been struggling since the October E. coli outbreak triggered a sharp drop, leaving the stock stuck in a choppy range while the wider market pushed higher. Buyers finally stepped in at the 200-day moving average in mid-January, providing the foundation for a recovery. Since then, the stock has broken back above the 50-day moving average, signalling improving momentum.
Yesterday’s earnings reaction saw the shares gap higher and push further into positive territory on strong volume, closing near the highs of the session. The next key test lies ahead, with resistance at the top of the October gap and trend highs just above. A break through these levels could open the door for a more sustained move higher, shifting the focus firmly back towards the long-term uptrend.
McDonald’s (NYSE: MCD) Daily Candle Chart
Past performance is not a reliable indicator of future results
Disclaimer: This is for information and learning purposes only. The information provided does not constitute investment advice nor take into account the individual financial circumstances or objectives of any investor. Any information that may be provided relating to past performance is not a reliable indicator of future results or performance. Social media channels are not relevant for UK residents.
Spread bets and CFDs are complex instruments and come with a high risk of losing money rapidly due to leverage. 83% of retail investor accounts lose money when trading spread bets and CFDs with this provider. You should consider whether you understand how spread bets and CFDs work and whether you can afford to take the high risk of losing your money.

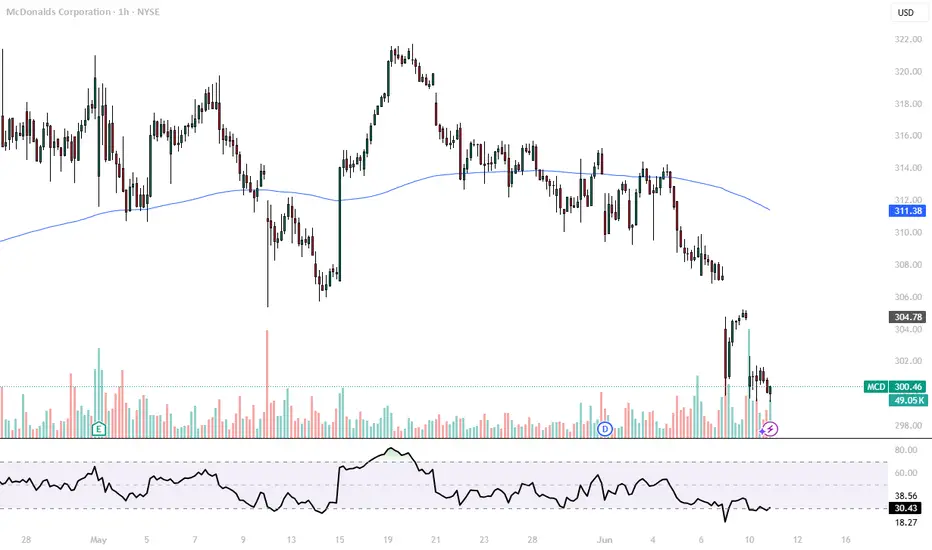
MCD, Short, 4h✅MCD is overbought and is pulling back to retest the key support at 304.00 before determining its next move.
SHORT 🔥
✅ Like and subscribe to never miss a new analysis! ✅

McDonald's Stock Crosses $300McDonald's stock has surged over 4.5% , reinforcing its bullish momentum, which had been paused after a prolonged neutral phase. Today’s earnings report has been a key driver, as the company posted earnings per share of $2.83 , in line with forecasts, along with a questionable sales figure of $6.39 billion , slightly below the $6.44 billion expected.
However, what has fueled the temporary bullish momentum is the board of directors’ decision to eliminate certain discounts that had been in place during previous quarters. These promotions are no longer considered essential for boosting sales growth, as they may have negatively impacted the company’s revenue figures. Now, the market sees this shift as a potential catalyst for sustained sales growth, which could in turn support long-term stock price appreciation.
Breaking the Sideways Trend
Until a few sessions ago, McDonald's stock had been trading within a tight range, fluctuating between $300 resistance and $286 support. However, the rising bullish momentum has pushed this sideways phase into the background. Now, analysts are evaluating whether this new upward gap could mark the beginning of a stronger trend movement. This scenario could materialize if the stock manages to reach its previous highs at $317.
Technical Indicators
RSI: The RSI line has spiked rapidly and is now reaching overbought levels, as indicated by the 70-mark threshold. If the stock remains above this level, it could signal a potential downward correction in the coming trading sessions.
MACD: The histogram has started to diverge from the neutral 0 level , indicating that the latest moving average trends continue to support the bullish movement. As long as this bias remains in the MACD, buying pressure could become even more significant.
Key Levels to Watch
$317 – Current key resistance, aligning with the October 2024 high. Consistent movements above this level could signal the beginning of a new and fresh uptrend in the stock.
$300 – New support level, corresponding to the top of the previous lateral channel. If the price dips back below this level, it could increase neutral bias and lead to extended sideways movement. This also serves as a potential retracement area in the short term.
$293 – Support zone, marked by the 50- and 100-period moving averages. If the price falls below this level, it would signal an end to the current bullish momentum, potentially confirming the start of a larger downtrend.
By Julian Pineda, CFA – Market Analyst

Amidst Q4 Revenue Estimate, $MCD is Up 2.86% Premarket TradingMcDonald’s (NYSE: MCD), the global fast-food giant, delivered a mixed bag of results in its Q4 CY2024 earnings report. While the company missed both revenue and earnings estimates, the stock surged nearly 2.86% in premarket trading, defying expectations. This paradoxical reaction highlights the interplay between technical and fundamental factors driving investor sentiment.
Revenue and Earnings Miss
McDonald’s reported Q4 revenue of $6.39 billion, falling short of Wall Street’s $6.46 billion estimate. This represents flat year-over-year growth and a 1.1% miss. Adjusted earnings per share (EPS) of $2.83 also came in 1% below the consensus estimate of $2.86. While the company maintained strong profitability, with an operating margin of 44.9% (up from 43.7% in the prior year), the revenue and EPS misses raised concerns about its growth trajectory.
Comparable Sales
Global comparable sales grew by 0.4%, beating expectations of a 0.41% decline. However, U.S. comparable sales dropped 1.4%, worse than anticipated. This decline was partly attributed to an E. coli outbreak in October, which impacted traffic in several states. Additionally, McDonald’s has faced criticism for raising prices too aggressively, alienating budget-conscious consumers. In response, the company has rolled out value-centric deals and promotions to win back customers.
Long-Term Growth Strategy
Despite the short-term challenges, McDonald’s remains committed to its "Accelerating the Arches" strategy, which focuses on expanding market share and driving operational efficiency. Chairman and CEO Chris Kempczinski emphasized that this strategy is delivering results, even as the company navigates macroeconomic headwinds and shifting consumer preferences.
Strong Full-Year Performance
For the full year 2023, McDonald’s posted revenue of $25.49 billion, a 9.97% increase from the previous year. Earnings surged 37.09% to $8.47 billion, underscoring the company’s ability to maintain profitability despite inflationary pressures and competitive challenges.
Technical Analysis
Despite the negative revenue and earnings reports, MCD’s stock price is trading within a bullish reversal pattern. Here’s what the technicals suggest:
Immediate Support: The stock is finding support at the 38.2% Fibonacci retracement level, a critical technical indicator that often acts as a floor during pullbacks.
- Resistance Point: The resistance lies just ahead of the 1-month high. A breakout above this level could sustain the bullish rally, potentially pushing the stock toward target of $319.58 (an 8.59% upside from current levels).
Momentum Indicators
The stock’s 2.48% gain at the time of writing indicates strong buying interest, despite the weak fundamentals. This suggests that traders are focusing on the company’s long-term growth potential and its ability to navigate short-term challenges.
#Market Sentiment
Analysts remain bullish on MCD, with an average rating of "Buy" and a 12-month price target implying significant upside. The stock’s resilience in the face of disappointing earnings reflects confidence in McDonald’s ability to execute its strategy and deliver value to shareholders.
Conclusion
McDonald’s Q4 results may have fallen short of expectations, but the stock’s rally reflects a broader narrative of resilience and long-term growth potential. While the U.S. market remains a challenge, the company’s global footprint, improving margins, and strategic initiatives position it well for future success.

Long MCD: Earnings Could Boost Momentum in the Coming Week
- Key Insights: McDonald's upcoming earnings report is set to significantly
impact its stock price. Analysts anticipate positive consumer sentiment
driven by the brand's value proposition amid inflation concerns, with
particular attention on same-store sales growth. Digital initiatives and
menu innovations could bolster revenue and improve market positioning.
- Price Targets: Next week targets: T1=305, T2=320. Stop levels: S1=290, S2=280.
- Recent Performance: MCD has shown stability in its recent trading activity,
with fluctuations reflecting broader market trends and consumer behavior in
the fast-food sector. The stock is currently positioned around $294.3,
navigating within market expectations leading up to earnings announcements.
- Expert Analysis: Analysts retain a bullish outlook on MCD, especially if the
upcoming earnings reports reveal strong customer traffic and operating
margins. Market sentiment leans towards positive, emphasizing the brand's
resilience and potential for growth in a competitive landscape.
- News Impact: Anticipated earnings reports alongside company initiatives in
sustainability and product innovation are expected to influence not just MCD
but also the fast-food sector's outlook as a reflection of consumer
discretionary health.
Does McDonald’s Chart Look Tasty Ahead of Monday’s Earnings?Legendary American fast-food chain McDonald's NYSE:MCD will release its fourth-quarter results Monday (Feb. 10). What does technical and fundamental analysis say about whether MCD stockholders will deserve a break that day?
Let’s see:
McDonald’s Fundamental Analysis
As I write this, analysts expect the "Golden Arches" to post $2.86 in adjusted earnings per share for the quarter on roughly $6.5 billion of revenue.
Those numbers, if realized, would compare to $2.95 in adjusted EPS on $6.4 billion in revenue for the year-ago period. That would represent sales growth of only 1%, so analysts aren’t really expecting much.
In fact, 17 of the 31 sell-side analysts that I found that cover the stock have cut their earnings estimates since the current quarter began, while none have revised their forecasts higher.
Still, Wall Street might watch more closely this time around at McDonald’s comparable-store sales, which have sagged of late.
Total comparable sales fell 1.5% year over year during the third quarter, and that came after a 1% y/y decline in the second quarter.
Hmm ... two successive quarters of negative comp-sales growth after going years without seeing any kind of quarterly contraction.
The blame? International markets have turned on McDonald's. Performance outside of the United States has been far worse than domestic performance has been.
That hasn’t helped MCD’s stock price, which has surrendered about 9% of its value since peaking in mid-October just ahead of the third-quarter earnings release.
McDonald’s Technical Analysis
But what if Mickey D's posts positive fourth-quarter comp-sales growth next week?
I mean, I don't have a tip on this, but the stock’s chart as of Wednesday afternoon (Feb. 5) was showing a technical set-up for a positive surprise:
Readers will see that MCD is trying to break out of a so-called “falling wedge” pattern, which is historically a pattern of bullish reversal.
What we see above is that the shares have found help close to $280.40, marked by the middle gray horizontal line above. (MCD closed at $294.36 Thursday.)
That’s the 50% retracement level of McDonald’s late-June through mid-October rally, which was running along what was at the time the stock's 200-day Simple Moving Average (or “SMA,” marked with a red line above).
Meanwhile, McDonald’s 50-day SMA (the blue line above) has acted as resistance for the stock, with a $291 pivot point.
But look to the left of the recent action and what do we see? An unfilled gap that would require a tick at $313 or above in order to completely fill it in.
You know what they say about unfilled gaps, right? “They don't always fill -- but they usually do.”
Looking elsewhere on the above chart, there’s nothing to be discerned from the Relative Strength Index (above the chart), which is neutral.
However, look at the daily Moving Average Convergence Divergence indicator (MACD) at the bottom of the above chart. No, it's not postured bullishly -- at least not yet.
But the histogram of the 9-day Exponential Moving Average (or “EMA,” marked with blue bars) is above zero, while the 12-day EMA (the black line) is above the 26-day EMA (the gold line). Those two lines just have to get themselves above zero for this set-up to look truly bullish.
The Bottom Line
While nothing is certain, the chart above does suggest that McDonald’s could be ready to make a move -- potentially upward.
(Moomoo Technologies Inc. Markets Commentator Stephen “Sarge” Guilfoyle had no position in MCD at the time of writing this column.)
This article discusses technical analysis, other approaches, including fundamental analysis, may offer very different views. The examples provided are for illustrative purposes only and are not intended to be reflective of the results you can expect to achieve. Specific security charts used are for illustrative purposes only and are not a recommendation, offer to sell, or a solicitation of an offer to buy any security. Past investment performance does not indicate or guarantee future success. Returns will vary, and all investments carry risks, including loss of principal. This content is also not a research report and is not intended to serve as the basis for any investment decision. The information contained in this article does not purport to be a complete description of the securities, markets, or developments referred to in this material. Moomoo and its affiliates make no representation or warranty as to the article's adequacy, completeness, accuracy or timeliness for any particular purpose of the above content. Furthermore, there is no guarantee that any statements, estimates, price targets, opinions or forecasts provided herein will prove to be correct. Moomoo is a financial information and trading app offered by Moomoo Technologies Inc. In the U.S., investment products and services on Moomoo are offered by Moomoo Financial Inc., Member FINRA/SIPC.
TradingView is an independent third party not affiliated with Moomoo Financial Inc., Moomoo Technologies Inc., or its affiliates. Moomoo Financial Inc. and its affiliates do not endorse, represent or warrant the completeness and accuracy of the data and information available on the TradingView platform and are not responsible for any services provided by the third-party platform.

McDonald’s: Trendline Breakout Before EarningsMcDonald’s has slid for about three months, but it may be attempting a breakout as earnings loom.
The first pattern on today’s chart is the series of lower highs since October. MCD pushed above that falling trendline in late January and has stayed above it since. That may suggest an intermediate-term decline has ended.
Second is the August 16 weekly close of $278.49. The hamburger giant tested and held that level a few weeks ago. The bounce coincidentally occurred near the 200-day simple moving average (SMA).
Speaking of moving averages, the 50-day SMA had a “golden cross” above the 200-day SMA in September. Is the longer-term trend getting more bullish?
Next, the 8-day exponential moving average (EMA) is above the 21-day (EMA). MACD is also rising. Both of those signals may be consistent with a short-term uptrend.
Quarterly results are due Monday morning.
TradeStation has, for decades, advanced the trading industry, providing access to stocks, options and futures. If you're born to trade, we could be for you. See our Overview for more.
Past performance, whether actual or indicated by historical tests of strategies, is no guarantee of future performance or success. There is a possibility that you may sustain a loss equal to or greater than your entire investment regardless of which asset class you trade (equities, options or futures); therefore, you should not invest or risk money that you cannot afford to lose. Online trading is not suitable for all investors. View the document titled Characteristics and Risks of Standardized Options at www.TradeStation.com . Before trading any asset class, customers must read the relevant risk disclosure statements on www.TradeStation.com . System access and trade placement and execution may be delayed or fail due to market volatility and volume, quote delays, system and software errors, Internet traffic, outages and other factors.
Securities and futures trading is offered to self-directed customers by TradeStation Securities, Inc., a broker-dealer registered with the Securities and Exchange Commission and a futures commission merchant licensed with the Commodity Futures Trading Commission). TradeStation Securities is a member of the Financial Industry Regulatory Authority, the National Futures Association, and a number of exchanges.
TradeStation Securities, Inc. and TradeStation Technologies, Inc. are each wholly owned subsidiaries of TradeStation Group, Inc., both operating, and providing products and services, under the TradeStation brand and trademark. When applying for, or purchasing, accounts, subscriptions, products and services, it is important that you know which company you will be dealing with. Visit www.TradeStation.com for further important information explaining what this means.

McDonald's Long OpportunityIntroduction
This stock report analyzes the current market trends based on trend lines, chart formations, and potential breakouts. Using the provided chart, we identify key levels and possible trading opportunities.
Technical Analysis: Trend Lines and Formations
The chart analysis illustrates several trend lines, indicating a consolidation phase and a potential reversal pattern. Key aspects of the analysis:
Downtrend Channel: The upper resistance line shows a clear series of lower highs, indicating a downward trend structure.
Uptrend Support: The lower orange line represents a crucial support level, highlighting buying interest at lower price levels.
Breakout Signals: Multiple attempts to break above the upper resistance line suggest a potential trend reversal. If the price breaks above this resistance, an upward movement could follow.
Flag and Falling Wedge in Uptrend: The flag and falling wedge chart patterns signal a possible continuation of the existing uptrend. While the flag suggests a short-term consolidation within the trend, the falling wedge indicates a narrowing price range, often leading to a bullish breakout.
Key Zones for Trading
Resistance and Support Zones: The red and green zones mark significant selling and buying areas. A breakout above or below these levels could trigger a strong price movement.
Conclusion and Trading Strategy
The current market structure shows a tight trading range, indicating a possible breakout soon. Traders should watch for a confirmed break of the trend lines. A bullish breakout above the resistance level could present new buying opportunities, whereas failure to surpass this area might signal a continuation of the downtrend.

McDonald’s (MCD): 50% Retracement Attracts New BuyersMcDonald's Corporation (MCD) is a global fast-food leader, serving millions daily with its iconic menu of burgers, fries, and shakes. Known for its brand strength and convenience, McDonald’s drives growth through international expansion, digital innovation, and menu updates like its growing focus on delivery and loyalty programs.
On the stock chart, MCD recently showed a confirmation bar with rising volume, moving higher after finding new demand at the 50% Fibonacci retracement. For traders, this new demand signals a potential area of support, where buyers stepped in to drive the price higher. Trailing stops can be set using Fibonacci levels with the snap tool, helping manage risk while staying in the trade.
